Learn DevOps Helm/Helmfile Kubernetes deployment
Github Repositories
The Learn DevOps Helm/Helmfile Kubernetes deployment Udemy course help learn DevOps Helm/Helmfile Kubernetes deployment with practical HELM CHART examples.
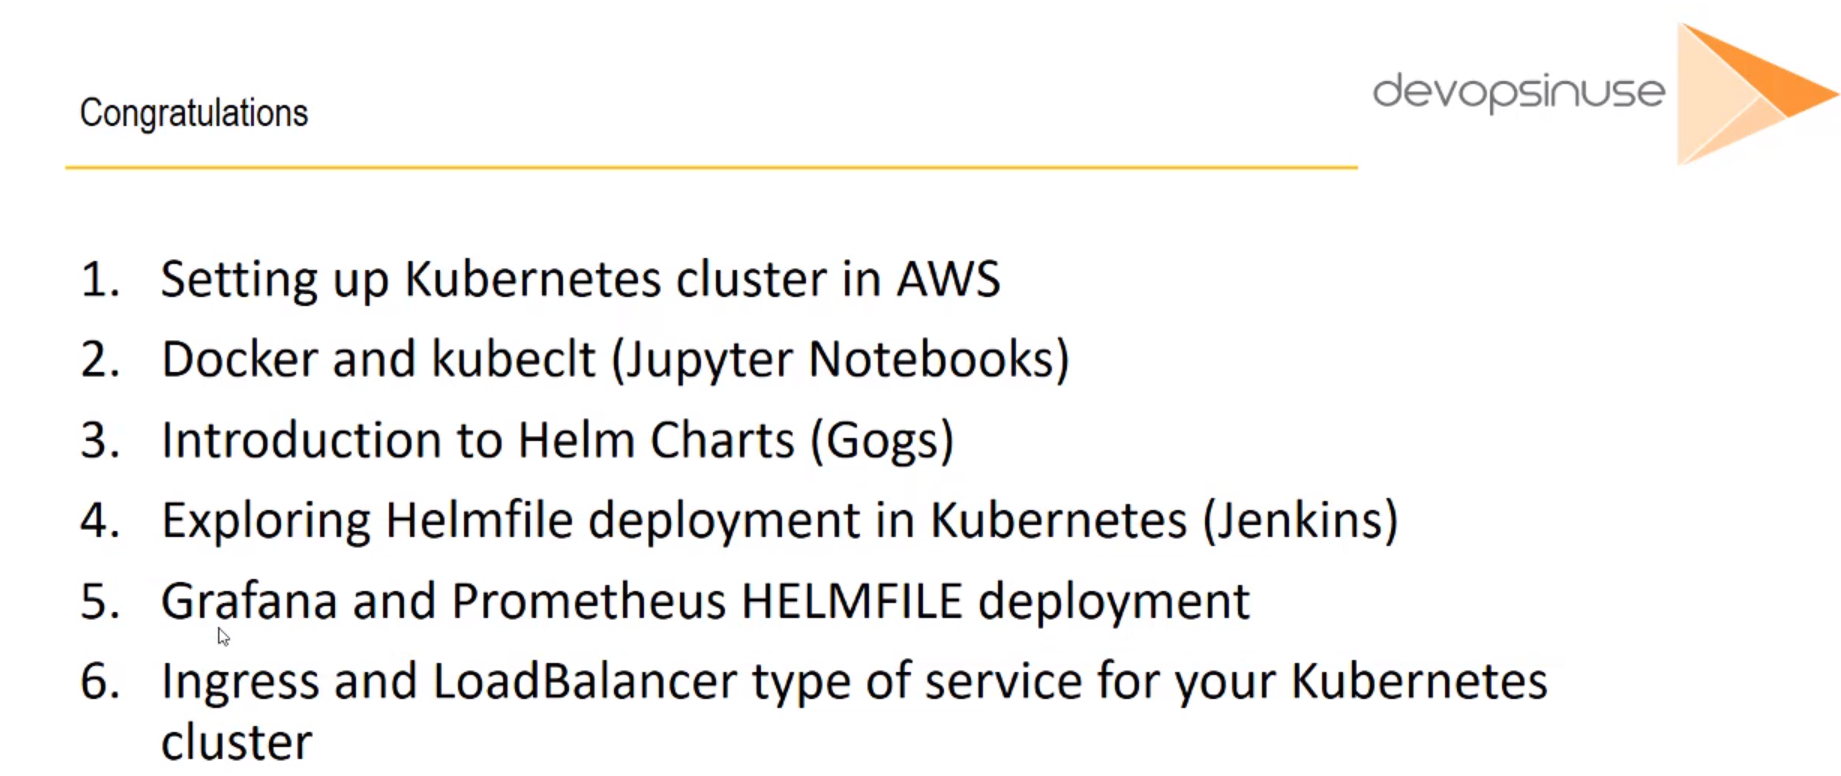
Table of contents
- What I've learned
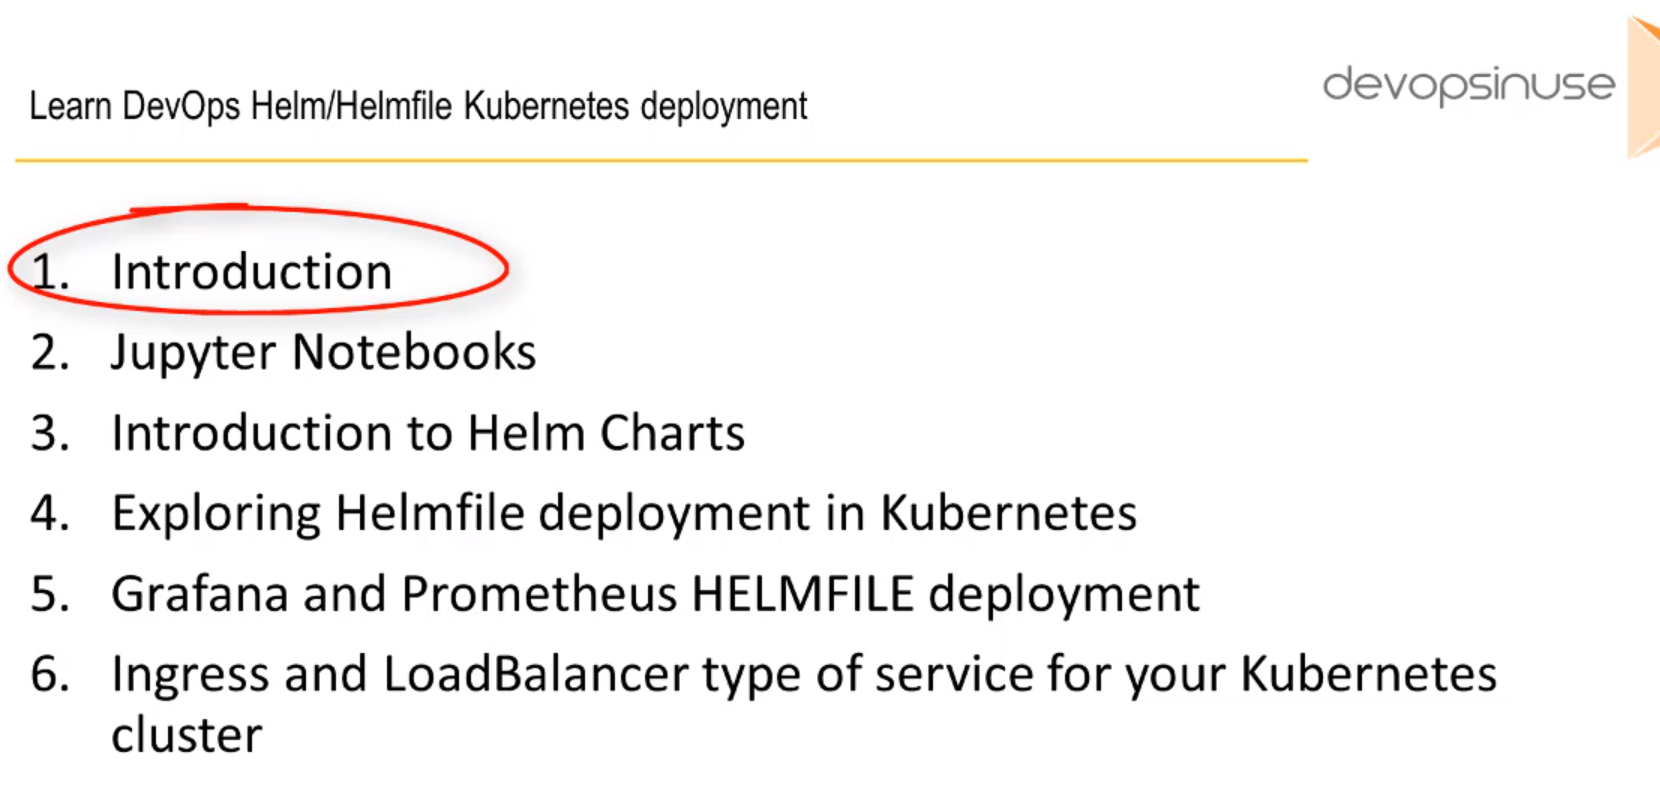
- Section: 1. Introduction
- 1. Welcome to course
- 2. Materials: Delete/destroy all the AWS resources every time you do not use them
- 3. How to start kubernetes cluster on AWS
- 4. How to create Hosted Zone on AWS
- 5. How to setup communication kops to AWS via aws
- 6. Materials: How to install KOPS binary
- 7. How to install kops
- 8. How to create S3 bucket in AWS
- 9. Materials: How to install TERRAFORM binary
- 10. How to install Terraform binary
- 11. Materials: How to install KUBECTL binary
- 12. How to install Kubectl binary
- 13. Materials: How to start Kubernetes cluster
- 14. How to lunch kubernetes cluster on AWS by using kops and terraform
- Section: 2. Jupyter Notebooks
- 15. Materials: How to run Jupyter Notebooks locally as Docker image
- 16. How to Run Jupyter Notebooks in Docker on local
- 17. How to deploy Jupyter Notebooks to Kubernetes AWS (Part 1)
- 18. Materials: How to deploy Juypyter Notebooks to Kubernetes via YAML file
- 19. How to deploy Jupyter Notebooks to Kubernetes AWS (Part 2)
- 20. How to deploy Jupyter Notebooks to Kubernetes AWS (Part 3)
- 21. Materials: How to SSH to the physical servers in AWS
- 22. How to deploy Jupyter Notebooks to Kubernetes AWS (Part 4)
- 23. How to deploy Jupyter Notebooks to Kubernetes AWS (Part 5)
- 24. Comparison between Jupyter Notebooks running as Docker Container with Kubernetes
- Section: 3. Introduction to Helm Charts
- 25. Materials: Install HELM binary and activate HELM user account in your cluster
- 26. Introduction to Helm charts
- 27. Materials: Run GOGS helm deployment for the first time
- 28. How to use Helm for the first time
- 29. How to understand helm Gogs deployment
- 30. Materials: How to use HELM to deploy GOGS from locally downloaded HELM CHARTS
- 31. How to deploy Gogs from local repository
- 32. Materials: How to understand persistentVolumeClaim and persistentVolumes
- 33. How to make your data persistent
- 34. Lets summarize on Gogs helm chart deployment
- Section: 4. Exploring Helmfile deployment in Kubernetes
- 35. Materials: How to install HELMFILE binary to your machine
- 36. Introduction to Helmfile
- 37. How to deploy Jenkins by using Helmfile (Part 1)
- 38. How to deploy Jenkins by using Helmfile (Part 2)
- 39. Materials: Create HELMFILE specification for Jenkins deployment
- 40. How to use helmfile to deploy Jenkins helm chart for the first time (Part 1)
- 41. Materials: Useful commands Jenkins deployment
- 42. How to use helmfile to deploy Jenkins helm chart for the first time (Part 2)
- Section: 5. Grafana and Prometheus HELMFILE deployment
- 43. Introduction to Prometheus and Grafana deployment by using helmfile (Grafana)
- 44. Prometheus and Grafana deployment by using helmfile (Prometheus part)
- 45. Prepare Helm charts for Grafana deployment by using helmfile
- 46. Prepare Helm charts for Prometheus deployment by using helmfile
- 47. Prepare Helm charts for Prometheus Node Exporter deployment by using helmfile
- 48. Copy Prometheus and Grafana Helm Charts specifications to server
- 49. Materials: Helmfile specification for Grafana and Prometheus deployment
- 50. Process Grafana and Prometheus helmfile deployment
- 51. Exploring Prometheus Node Exporter
- 52. Explore Prometheus Web User Interface
- 53. Explore Grafana Web User Interface
- Section: 6. Ingress and LoadBalancer type of service for your Kubernetes cluster
- 54. LoadBalancer Grafana Service
- 55. Materials: Helmfile specification to add DokuWiki deployment
- 56. Single LoadBalancer service type for all instances in your K8s (DokuWiki)
- 57. Materials: Helmfile specification to add nginx-ingress Helm Chart deployment
- 58. Nginx Ingress Controller Pod
- 59. Configure Ingress Kubernetes Objects for Grafana, Prometheus and DokuWiki
- 60. Important: Clean up Kubernetes cluster and all the AWS resources
- 61. Congratulations
What I've learned
- Deployment concepts in Kubernetes by using HELM and HELMFILE
- How to work and interact with Kubernetes orchestration platform.
- Deploy Kubernetes cluster in AWS by using kops and terraform.
- How to use and adjust Helm charts (standard deployment methodology).
Section: 1. Introduction
1. Welcome to course
 WelcomeToCourse2
WelcomeToCourse3
2. Materials: Delete/destroy all the AWS resources every time you do not use them
Note: I assume that if you are going through this course during several days - You always destroy all resources in AWS.
It means that you stop your Kubernetes cluster every time you are not working on it. The easiest way is to do it via terraform cd /.../.../.../terraform_code ; terraform destroy # hit yes
Destroy/delete manually if terraform can't do that:
VOLUMES
LoadBalancer/s (if exists)
RecordSet/s (custom RecordSet/s)
EC2 instances
network resources
...
Except:
S3 bucket (delete once you do not want to use this free 1 YEAR account anymore, or you are done with this course.)
Hosted Zone (delete once you do not want to use this free 1 YEAR account anymore, or you are done with this course.)
Please do not forget redeploy tiller pod by using of this commands every time you are starting your Kubernetes cluster.
# Start your Kubernetes cluster
cd /.../.../.../terraform_code
terraform apply

# Crete service account && initiate tiller pod in your Kubernetes cluster
kubectl create serviceaccount --namespace kube-system tiller
kubectl create clusterrolebinding tiller-cluster-rule --clusterrole=cluster-admin --serviceaccount=kube-system:tiller
# kubectl patch deploy --namespace kube-system tiller-deploy -p '{"spec":{"template":{"spec":{"serviceAccount":"tiller"}}}}'
helm init --service-account tiller --upgrade
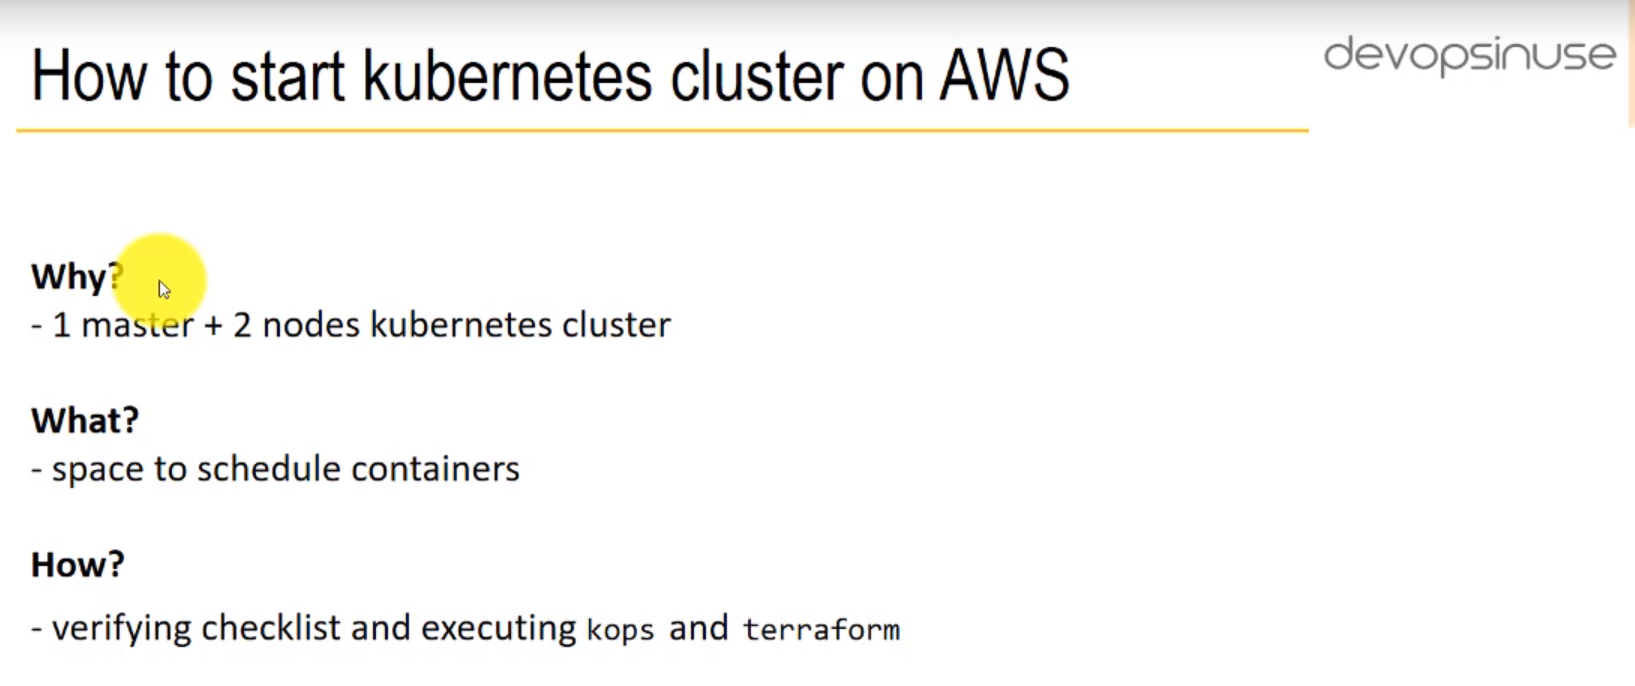
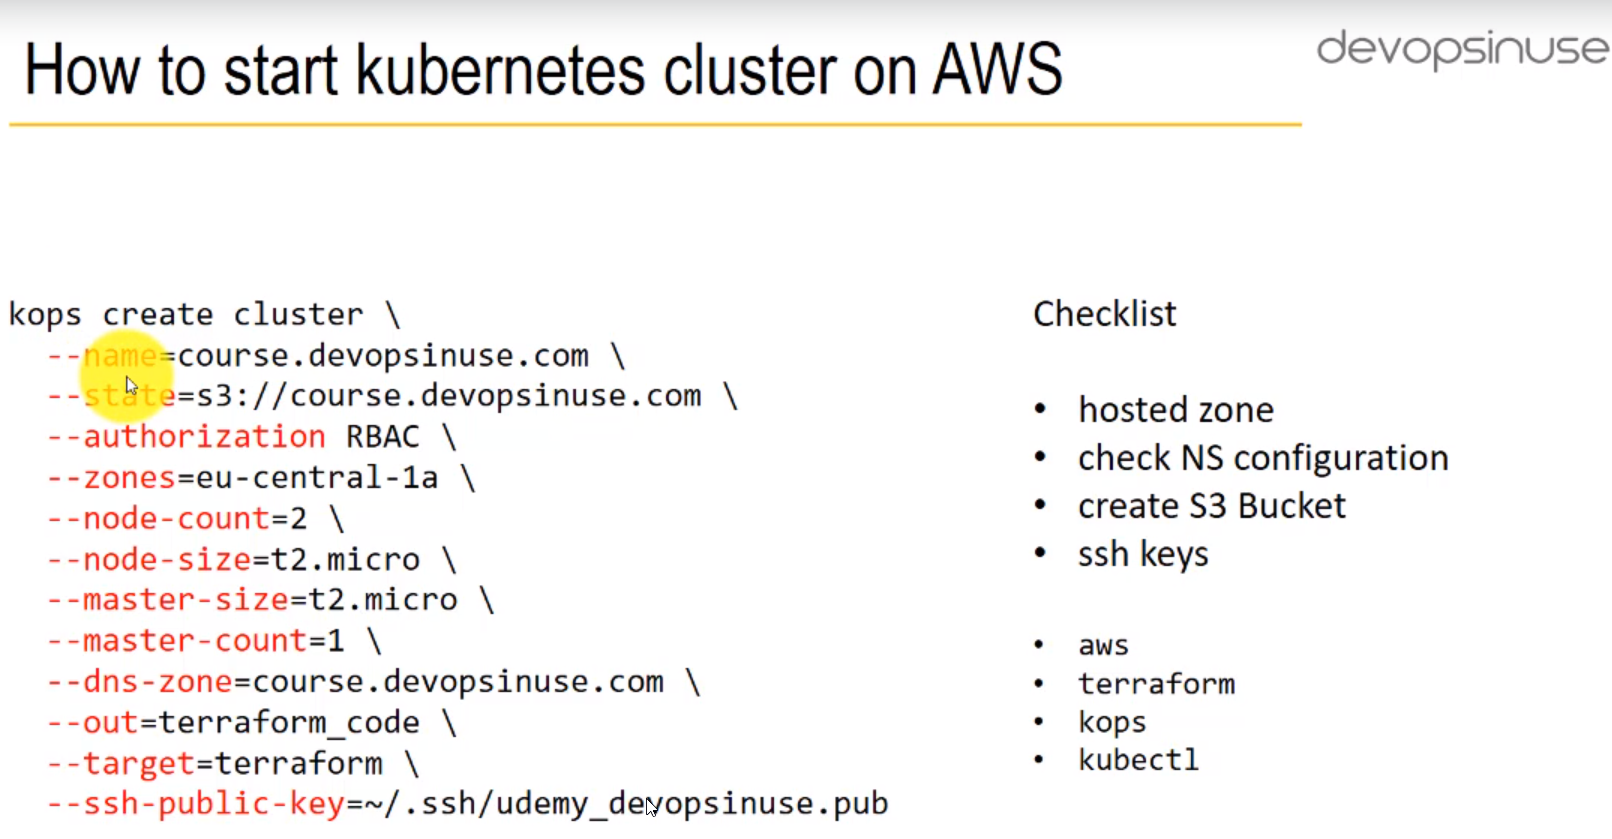
3. How to start kubernetes cluster on AWS
4. How to create Hosted Zone on AWS
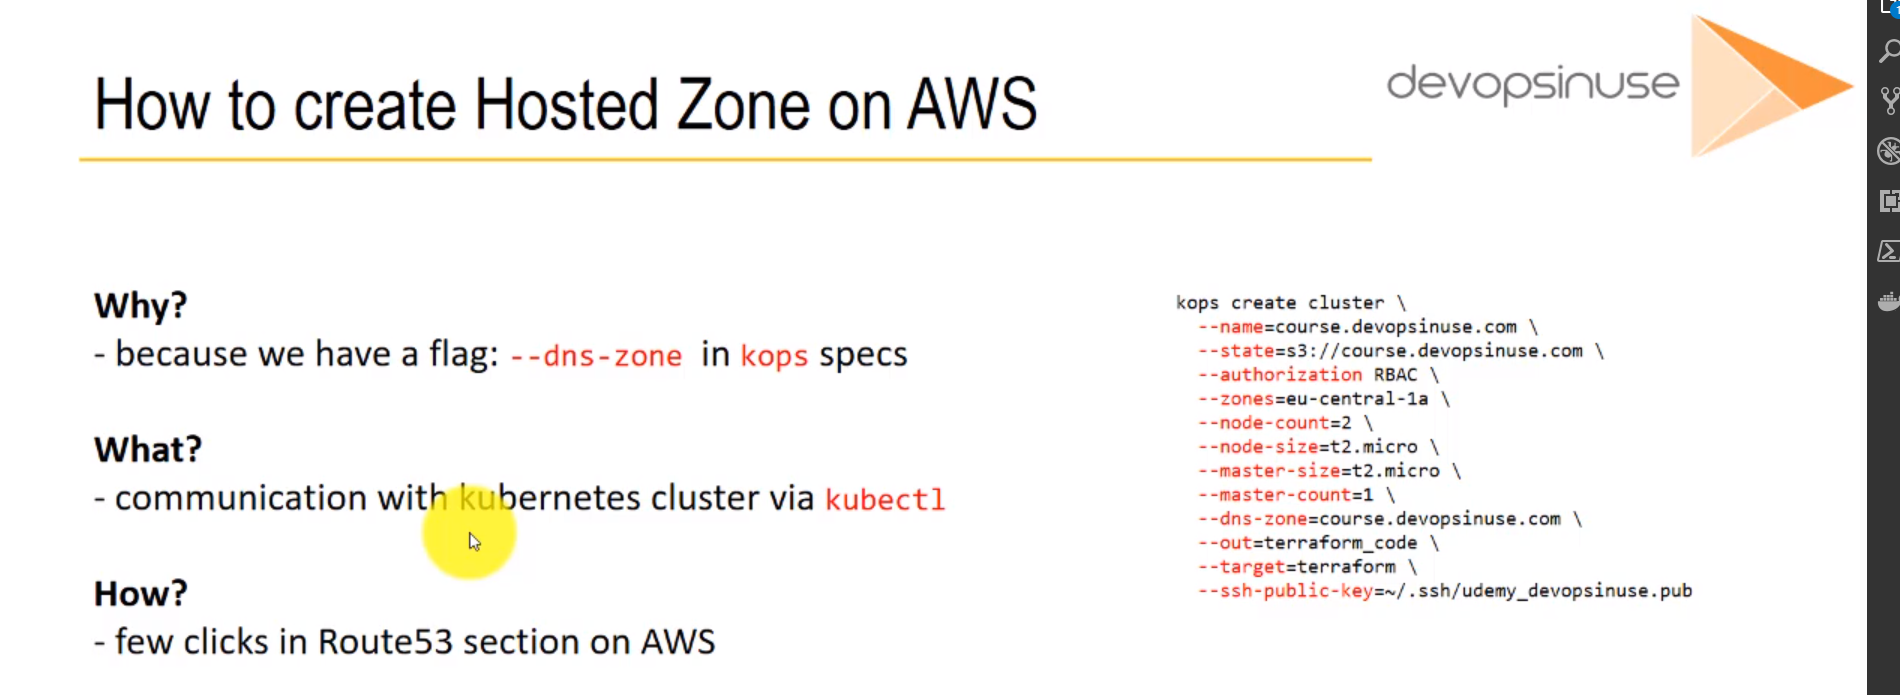
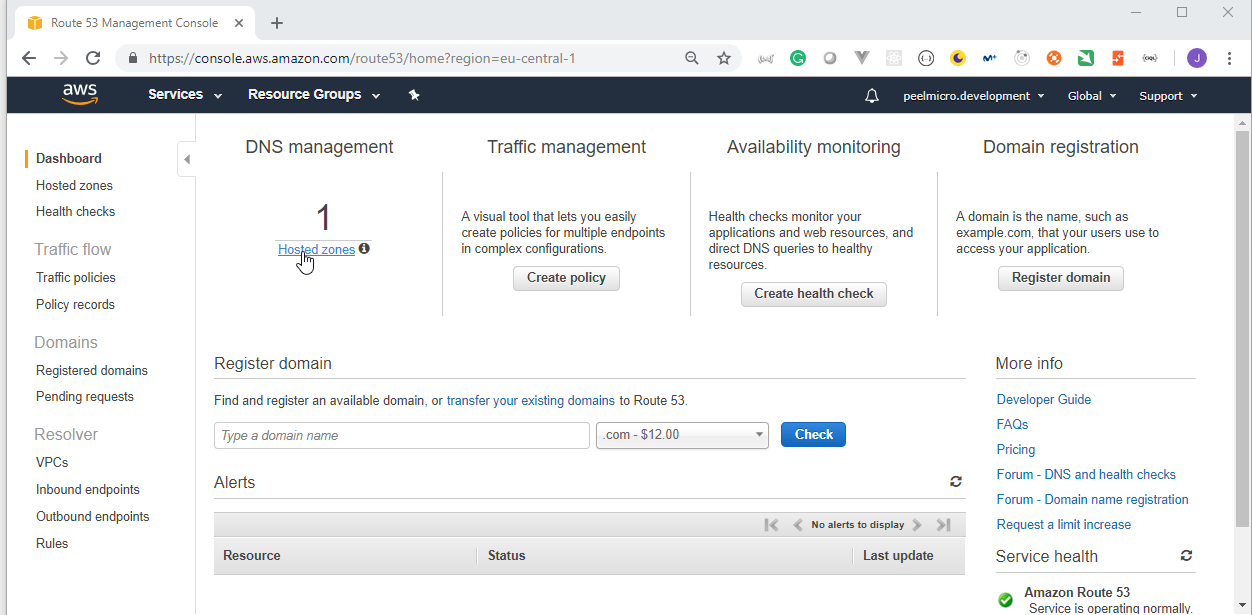
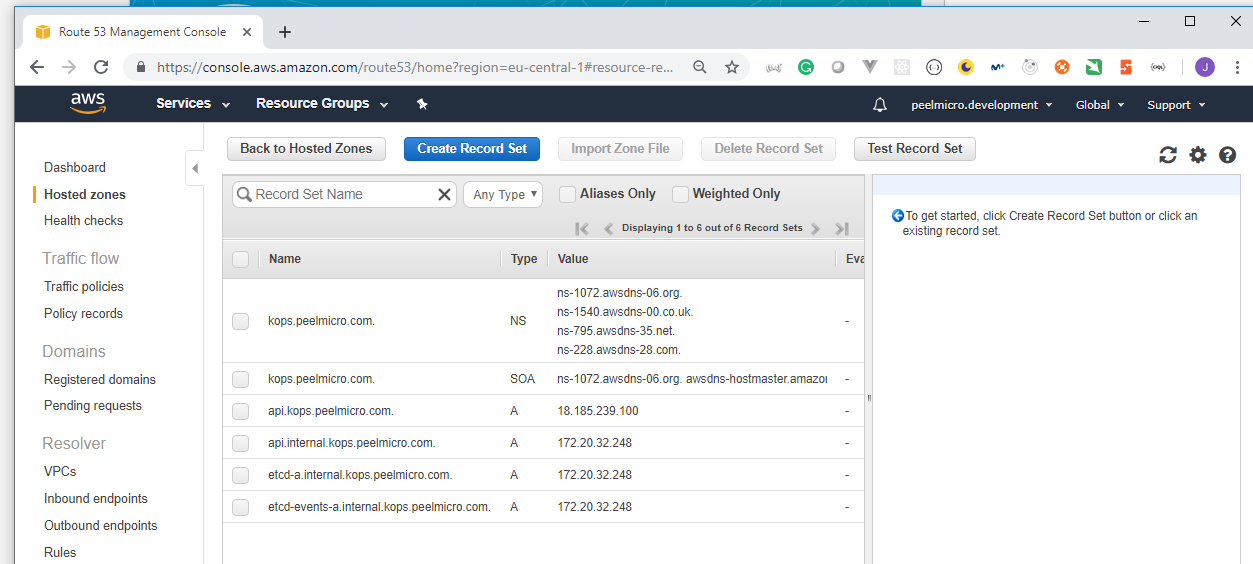
Hosted Zoneis explained in 16. How to use kops and create Kubernetes cluster (Continue) - Why hosted zone chapter of the Learn Devops Kubernetes deployment by kops and terraform Udemy course.Go to AWS Route 53 Console

HowToCreateHostedZoneOnAWS5
5. How to setup communication kops to AWS via aws
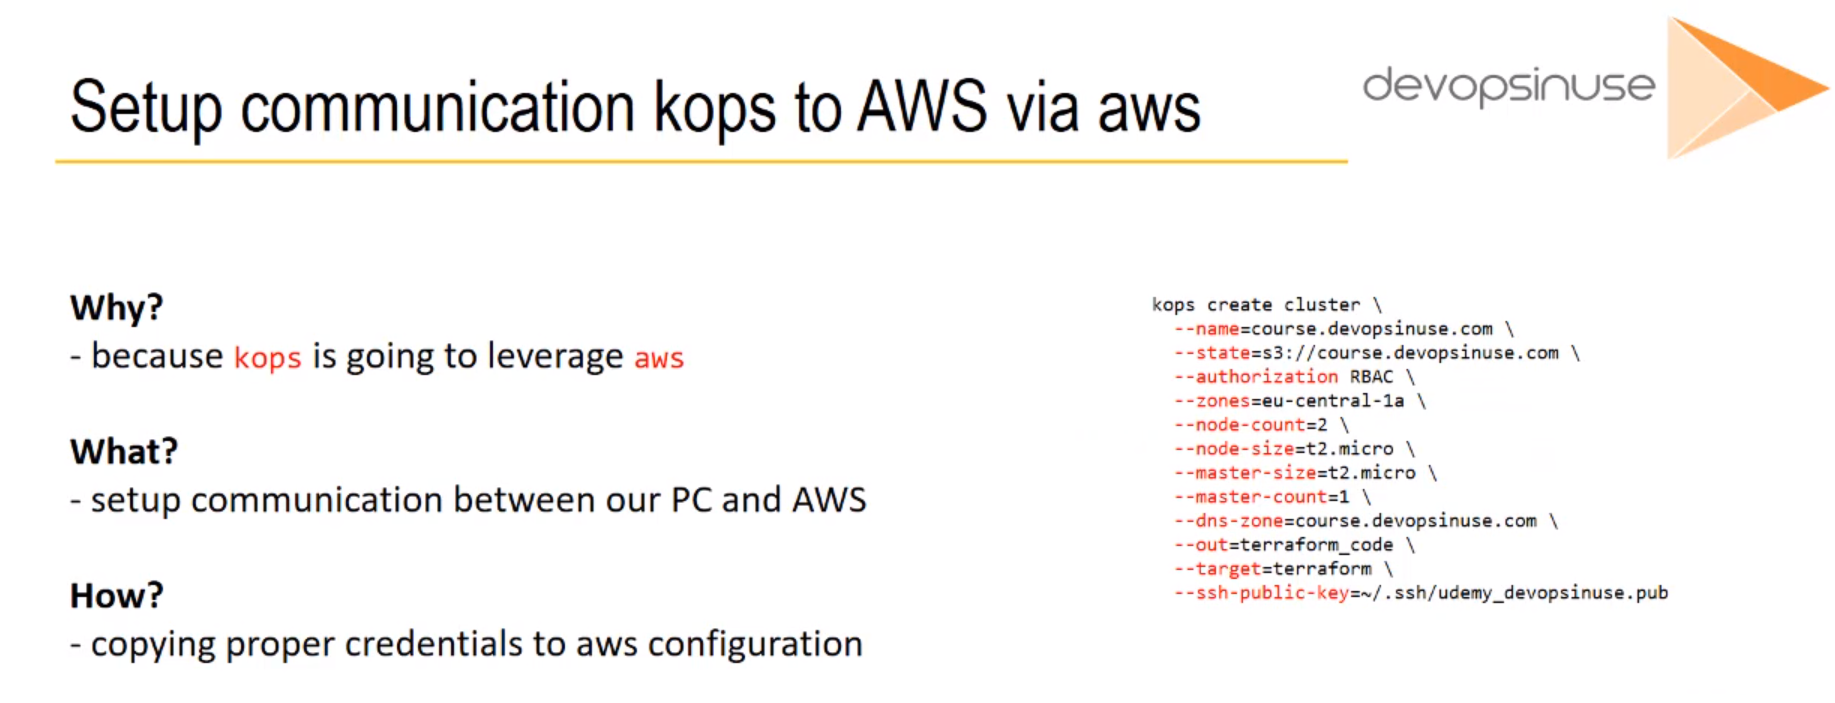
Installing aws utilityis explained in 4. Install aws utility chapter of the Learn Devops Kubernetes deployment by kops and terraform Udemy course.We can ensure it is working by puting the
awscommand:
root@ubuntu-s-1vcpu-2gb-lon1-01:~# aws
usage: aws [options] <command> <subcommand> [<subcommand> ...] [parameters]
To see help text, you can run:

  aws help
  aws <command> help
  aws <command> <subcommand> help
aws: error: the following arguments are required: command
- We can ensure the utility is configured properly by executing the following command:
root@ubuntu-s-1vcpu-2gb-lon1-01:~# aws ec2 describe-instances
{
    "Reservations": []
}
- If it were not properly configured something like this should be shown:
 HowToSetupCommunicationKopsToAwsViaAws3
HowToSetupCommunicationKopsToAwsViaAws4
6. Materials: How to install KOPS binary
Simple shell function for kops installation
Kubernetes documentation: https://kubernetes.io/docs/getting-started-guides/kops/
Copy and paste this code:
function install_kops {
    if [ -z $(which kops) ]
       then
           curl -LO https://github.com/kubernetes/kops/releases/download/$(curl -s https://api.github.com/repos/kubernetes/kops/releases/latest | grep tag_name | cut -d '"' -f 4)/kops-linux-amd64
           chmod +x kops-linux-amd64
           mv kops-linux-amd64 /usr/local/bin/kops
       else
           echo "kops is most likely installed"
       fi
}

install_kops
Hit enter and kops binary should be automatically installed to your Linux machine.
Install kops on MacOS:
curl -OL https://github.com/kubernetes/kops/releases/download/1.8.0/kops-darwin-amd64
chmod +x kops-darwin-amd64
mv kops-darwin-amd64 /usr/local/bin/kops
# you can also install using Homebrew
brew update && brew install kops
7. How to install kops
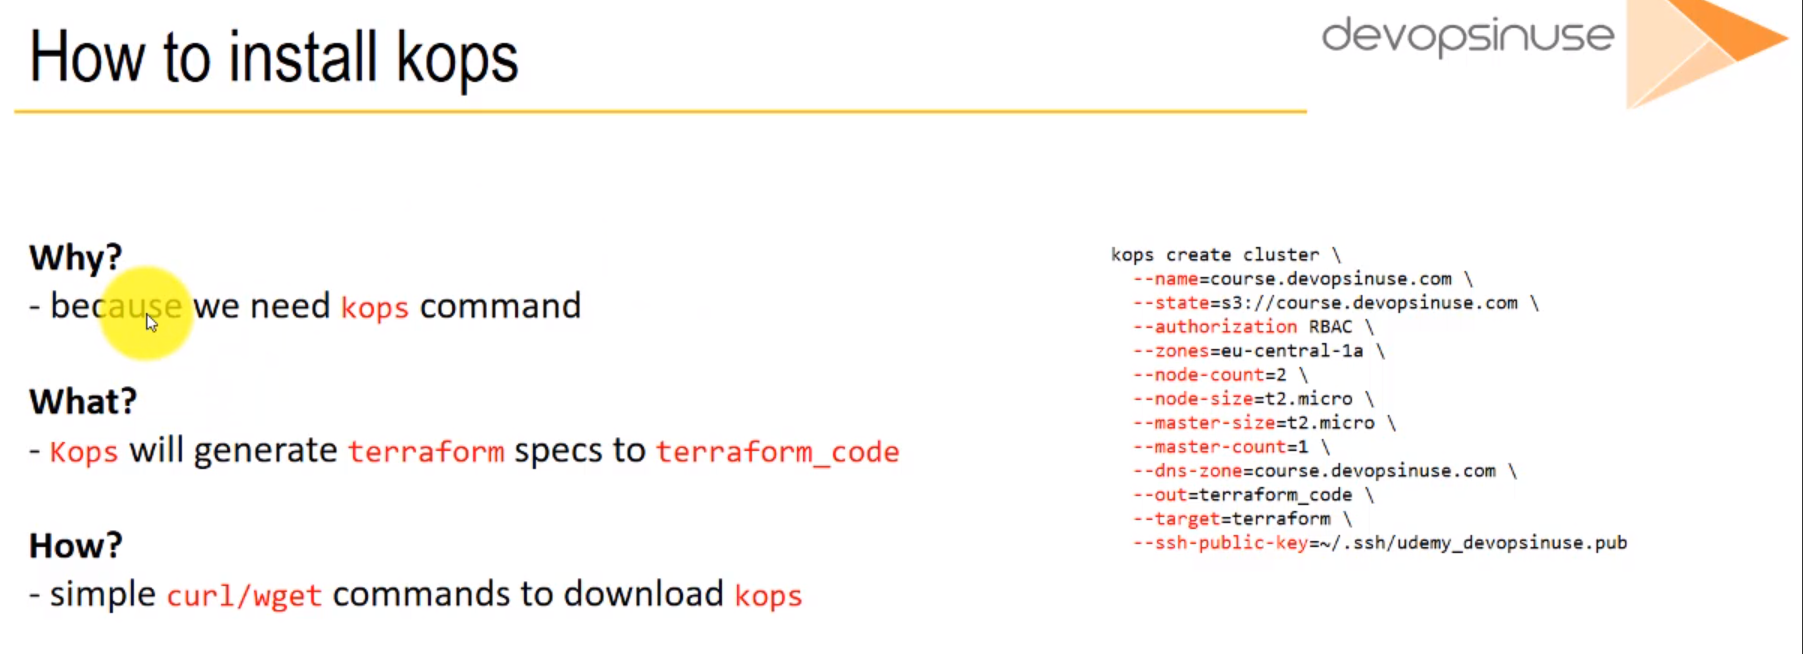
Installing kopsis explained in 9. Install kops chapter of the Learn Devops Kubernetes deployment by kops and terraform Udemy course.We can check if we have already installed kops by using the following command:
root@ubuntu-s-1vcpu-2gb-lon1-01:~# which kops
/usr/local/bin/kops
- We can run the
kopscommand to ensure it is working:
root@ubuntu-s-1vcpu-2gb-lon1-01:~# kops
kops is Kubernetes ops.

kops is the easiest way to get a production grade Kubernetes cluster up and running. We like to think of it as kubectl for clusters.

kops helps you create, destroy, upgrade and maintain production-grade, highly available, Kubernetes clusters from the command line.  AWS (Amazon Web Services) is currently officially supported, with GCE and VMware vSphere in alpha support.

Usage:
  kops [command]

Available Commands:
  completion     Output shell completion code for the given shell (bash or zsh).
  create         Create a resource by command line, filename or stdin.
  delete         Delete clusters,instancegroups, or secrets.
  describe       Describe a resource.
  edit           Edit clusters and other resources.
  export         Export configuration.
  get            Get one or many resources.
  help           Help about any command
  import         Import a cluster.
  replace        Replace cluster resources.
  rolling-update Rolling update a cluster.
  set            Set fields on clusters and other resources.
  toolbox        Misc infrequently used commands.
  update         Update a cluster.
  upgrade        Upgrade a kubernetes cluster.
  validate       Validate a kops cluster.
  version        Print the kops version information.

Flags:
      --alsologtostderr                  log to standard error as well as files
      --config string                    yaml config file (default is $HOME/.kops.yaml)
  -h, --help                             help for kops
      --log_backtrace_at traceLocation   when logging hits line file:N, emit a stack trace (default :0)
      --log_dir string                   If non-empty, write log files in this directory
      --logtostderr                      log to standard error instead of files (default false)
      --name string                      Name of cluster. Overrides KOPS_CLUSTER_NAME environment variable
      --state string                     Location of state storage (kops 'config' file). Overrides KOPS_STATE_STORE environment variable
      --stderrthreshold severity         logs at or above this threshold go to stderr (default 2)
  -v, --v Level                          log level for V logs
      --vmodule moduleSpec               comma-separated list of pattern=N settings for file-filtered logging

Use "kops [command] --help" for more information about a command.
root@ubuntu-s-1vcpu-2gb-lon1-01:~#
8. How to create S3 bucket in AWS
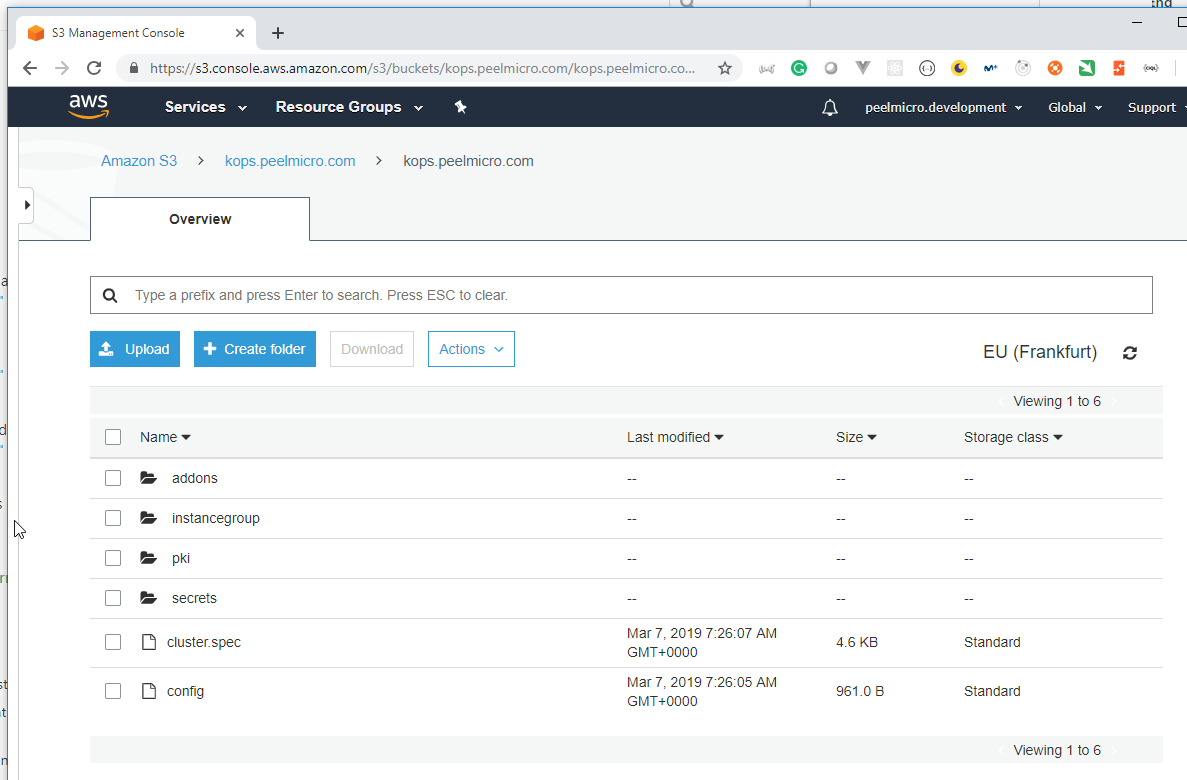
HowToCreateS3BucketInAws
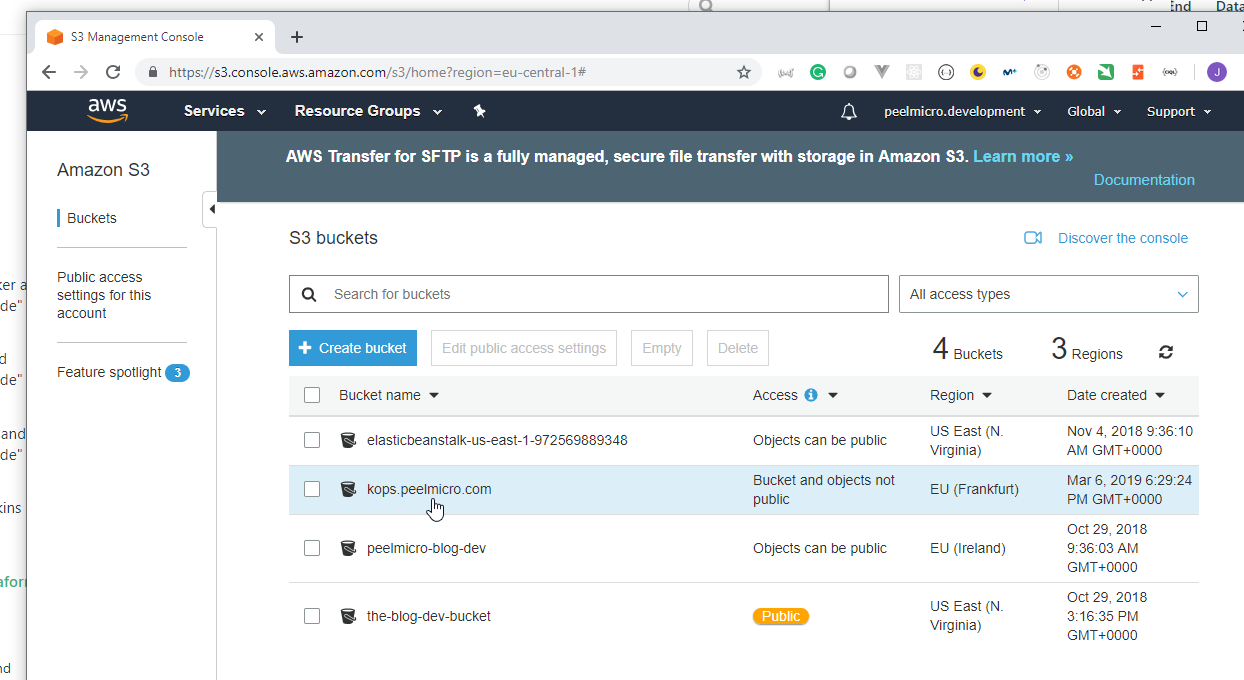
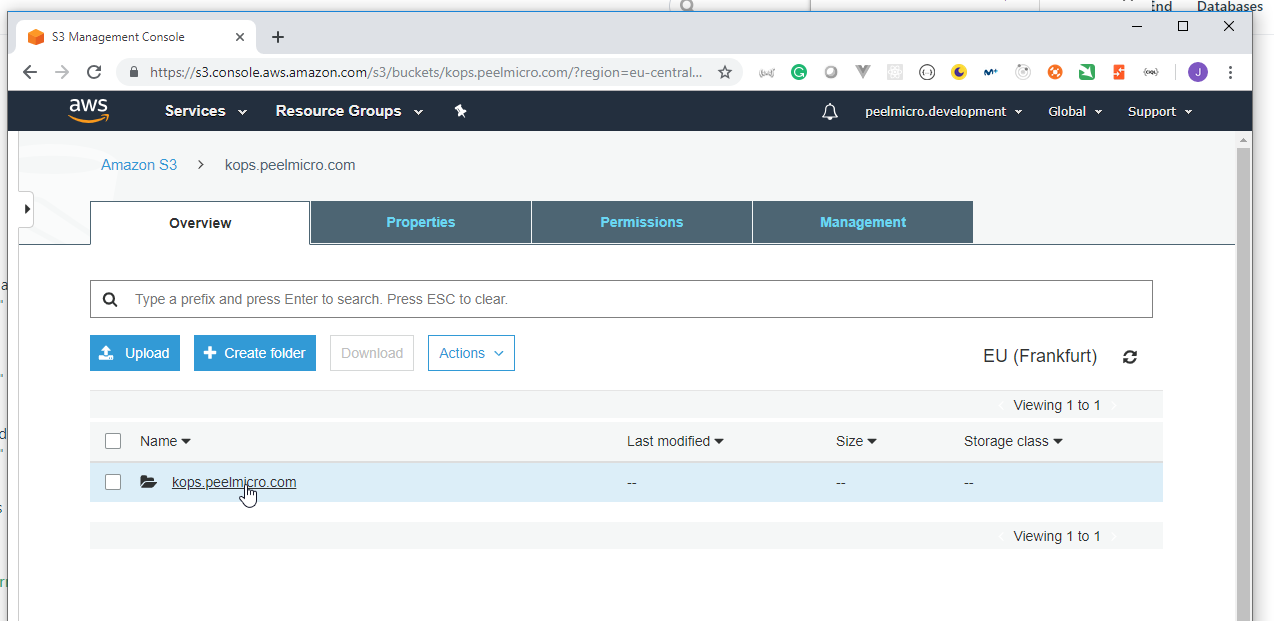
Creating the S3 bucketis explained in the 15. How to use kops and create Kubernetes cluster chapter of the Learn Devops Kubernetes deployment by kops and terraform Udemy course.
9. Materials: How to install TERRAFORM binary
Here is the bash function to install terrafrom:
TERRAFORM_ZIP_FILE=terraform_0.11.7_linux_amd64.zip
TERRAFORM=https://releases.hashicorp.com/terraform/0.11.7
TERRAFORM_BIN=terraform

function install_terraform {
    if [ -z $(which $TERRAFORM_BIN) ]
       then
           wget ${TERRAFORM}/${TERRAFORM_ZIP_FILE}
           unzip ${TERRAFORM_ZIP_FILE}
           sudo mv ${TERRAFORM_BIN} /usr/local/bin/${TERRAFORM_BIN}
           rm -rf ${TERRAFORM_ZIP_FILE}
    else
       echo "Terraform is most likely installed"
    fi

}

install_terraform
Alternatively:
Install terraform on MacOS:
1) Download ZIP file
wget https://releases.hashicorp.com/terraform/0.11.7/terraform_0.11.7_darwin_amd64.zip
2) unzip this ZIP package
3) copy it to your executable path
Install terraform on Windows:
1) Download ZIP file
wget https://releases.hashicorp.com/terraform/0.11.7/terraform_0.11.7_windows_amd64.zip
2) unzip this ZIP package
3) copy it to your executable path
10. How to install Terraform binary
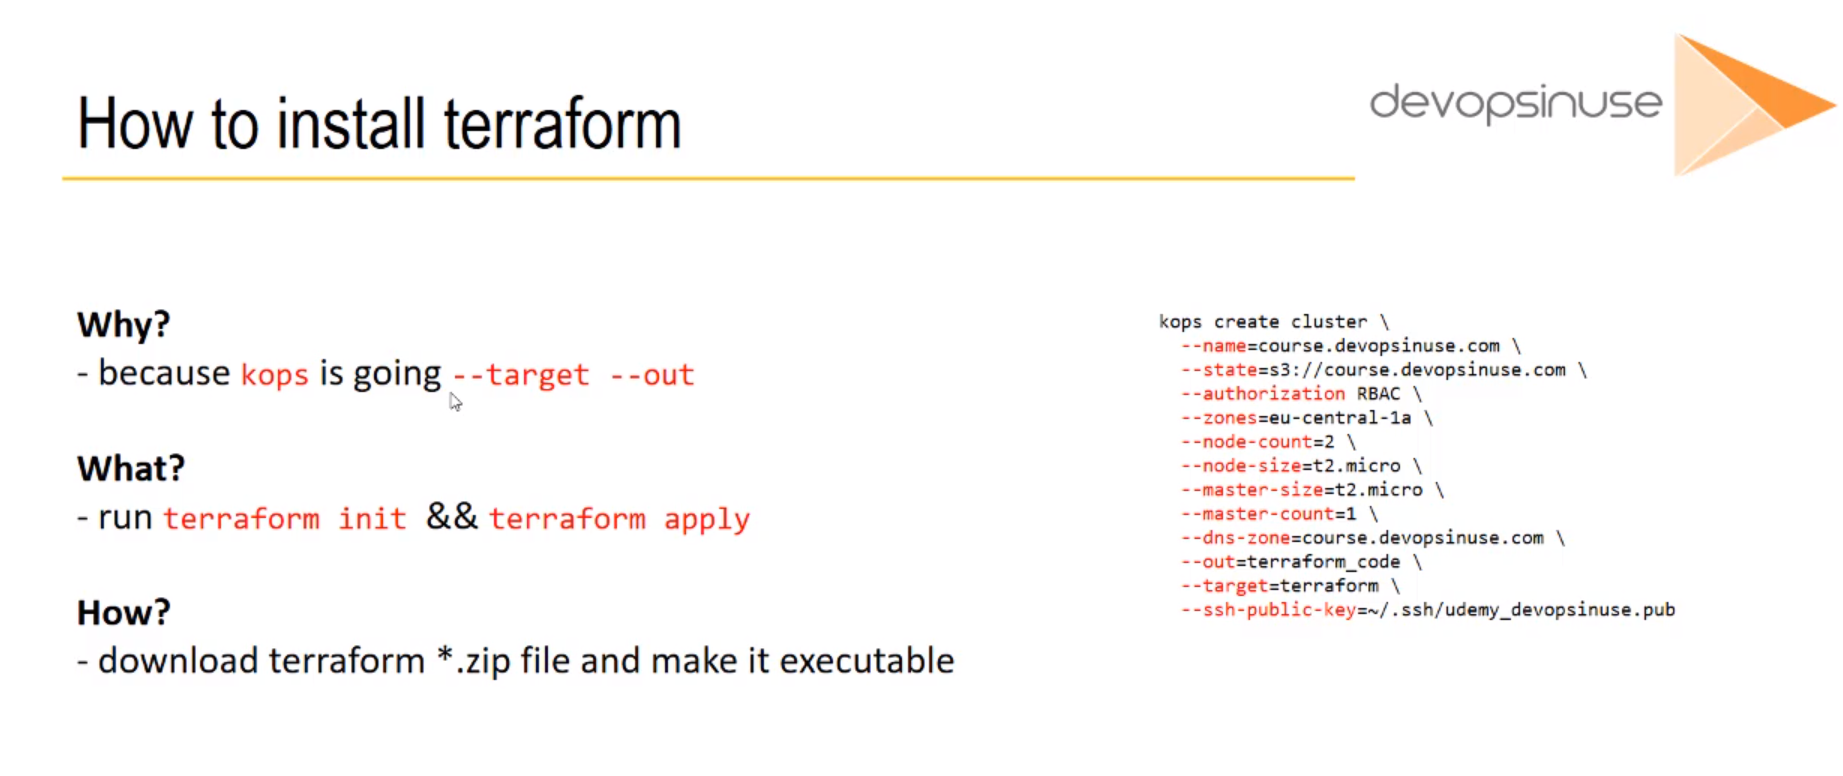
Installing terraformis explained in the 11. Install terraform chapter of the Learn Devops Kubernetes deployment by kops and terraform Udemy course.Check if
terraformis already installed.
root@ubuntu-s-1vcpu-2gb-lon1-01:~# which terraform
/usr/local/bin/terraform
- Ensure it can be executed.
root@ubuntu-s-1vcpu-2gb-lon1-01:~# terraform
Usage: terraform [-version] [-help] <command> [args]

The available commands for execution are listed below.
The most common, useful commands are shown first, followed by
less common or more advanced commands. If you're just getting
started with Terraform, stick with the common commands. For the
other commands, please read the help and docs before usage.

Common commands:
    apply              Builds or changes infrastructure
    console            Interactive console for Terraform interpolations
    destroy            Destroy Terraform-managed infrastructure
    env                Workspace management
    fmt                Rewrites config files to canonical format
    get                Download and install modules for the configuration
    graph              Create a visual graph of Terraform resources
    import             Import existing infrastructure into Terraform
    init               Initialize a Terraform working directory
    output             Read an output from a state file
    plan               Generate and show an execution plan
    providers          Prints a tree of the providers used in the configuration
    push               Upload this Terraform module to Atlas to run
    refresh            Update local state file against real resources
    show               Inspect Terraform state or plan
    taint              Manually mark a resource for recreation
    untaint            Manually unmark a resource as tainted
    validate           Validates the Terraform files
    version            Prints the Terraform version
    workspace          Workspace management

All other commands:
    debug              Debug output management (experimental)
    force-unlock       Manually unlock the terraform state
    state              Advanced state management
11. Materials: How to install KUBECTL binary
How to install kubectl binary to Linux like OS
Copy and paste this code to your command line:
KUBECTL_BIN=kubectl

function install_kubectl {
    if [ -z $(which $KUBECTL_BIN) ]
       then
           curl -LO https://storage.googleapis.com/kubernetes-release/release/$(curl -s https://storage.googleapis.com/kubernetes-release/release/stable.txt)/bin/linux/amd64/$KUBECTL_BIN
           chmod +x ${KUBECTL_BIN}
           sudo mv ${KUBECTL_BIN} /usr/local/bin/${KUBECTL_BIN}
    else
       echo "Kubectl is most likely installed"
    fi

}
Run this command:
install_kubectl
By now you should be able to use kubectl command.
12. How to install Kubectl binary
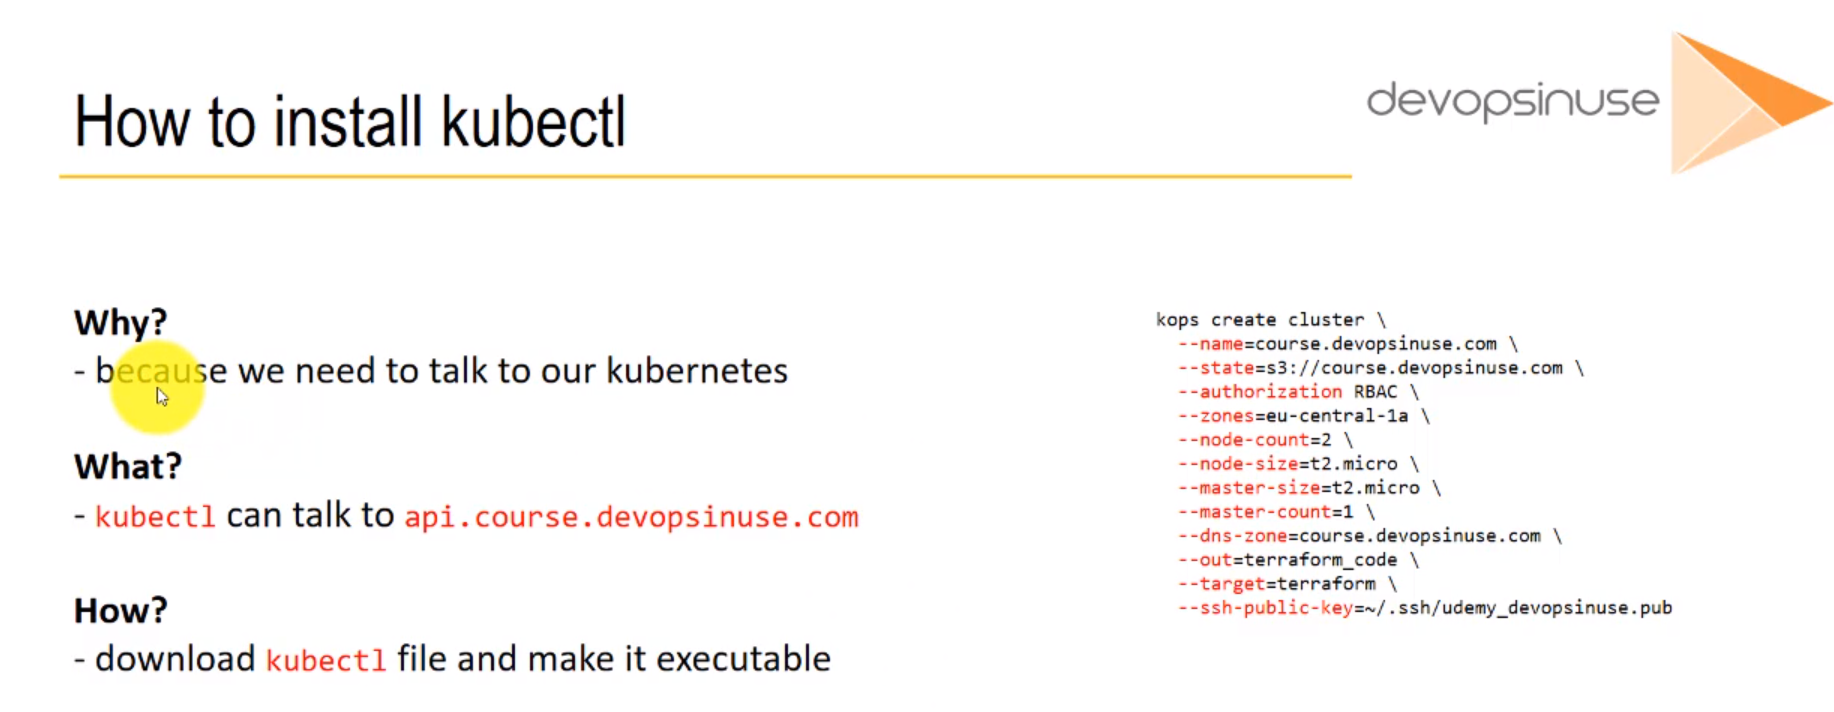
Installing Kubectlis explained in the 7. Install kubectl chapter of the Learn Devops Kubernetes deployment by kops and terraform Udemy course.Check it it is already installed:
root@ubuntu-s-1vcpu-2gb-lon1-01:~# which kubectl
/snap/bin/kubectl
- Ensure it works correctly
root@ubuntu-s-1vcpu-2gb-lon1-01:~# kubectl
kubectl controls the Kubernetes cluster manager.

Find more information at: https://kubernetes.io/docs/reference/kubectl/overview/

Basic Commands (Beginner):
  create         Create a resource from a file or from stdin.
  expose         Take a replication controller, service, deployment or pod and expose it as a new Kubernetes Service
  run            Run a particular image on the cluster
  set            Set specific features on objects

Basic Commands (Intermediate):
  explain        Documentation of resources
  get            Display one or many resources
  edit           Edit a resource on the server
  delete         Delete resources by filenames, stdin, resources and names, or by resources and label selector

Deploy Commands:
  rollout        Manage the rollout of a resource
  scale          Set a new size for a Deployment, ReplicaSet, Replication Controller, or Job
  autoscale      Auto-scale a Deployment, ReplicaSet, or ReplicationController

Cluster Management Commands:
  certificate    Modify certificate resources.
  cluster-info   Display cluster info
  top            Display Resource (CPU/Memory/Storage) usage.
  cordon         Mark node as unschedulable
  uncordon       Mark node as schedulable
  drain          Drain node in preparation for maintenance
  taint          Update the taints on one or more nodes

Troubleshooting and Debugging Commands:
  describe       Show details of a specific resource or group of resources
  logs           Print the logs for a container in a pod
  attach         Attach to a running container
  exec           Execute a command in a container
  port-forward   Forward one or more local ports to a pod
  proxy          Run a proxy to the Kubernetes API server
  cp             Copy files and directories to and from containers.
  auth           Inspect authorization

Advanced Commands:
  diff           Diff live version against would-be applied version
  apply          Apply a configuration to a resource by filename or stdin
  patch          Update field(s) of a resource using strategic merge patch
  replace        Replace a resource by filename or stdin
  wait           Experimental: Wait for a specific condition on one or many resources.
  convert        Convert config files between different API versions

Settings Commands:
  label          Update the labels on a resource
  annotate       Update the annotations on a resource
  completion     Output shell completion code for the specified shell (bash or zsh)

Other Commands:
  api-resources  Print the supported API resources on the server
  api-versions   Print the supported API versions on the server, in the form of "group/version"
  config         Modify kubeconfig files
  plugin         Provides utilities for interacting with plugins.
  version        Print the client and server version information

Usage:
  kubectl [flags] [options]

Use "kubectl <command> --help" for more information about a given command.
Use "kubectl options" for a list of global command-line options (applies to all commands).
13. Materials: How to start Kubernetes cluster
How to start Kubernetes cluster by using Kops and Terraform
SSH_KEYS=~/.ssh/udemy_devopsinuse

if [ ! -f "$SSH_KEYS" ]
then
    echo -e "\nCreating SSH keys ..."
    ssh-keygen -t rsa -C "udemy.course" -N '' -f ~/.ssh/udemy_devopsinuse
else
    echo -e "\nSSH keys are already in place!"
fi

echo -e "\nCreating kubernetes cluster ...\n"

kops create cluster \
  --name=course.<example>.com \
  --state=s3://course.<example>.com \
  --authorization RBAC \
  --zones=<define-zone> \
  --node-count=2 \
  --node-size=t2.micro \
  --master-size=t2.micro \
  --master-count=1 \
  --dns-zone=course.<example>.com \
  --out=terraform_code \
  --target=terraform \
  --ssh-public-key=~/.ssh/udemy_devopsinuse.pub
14. How to lunch kubernetes cluster on AWS by using kops and terraform
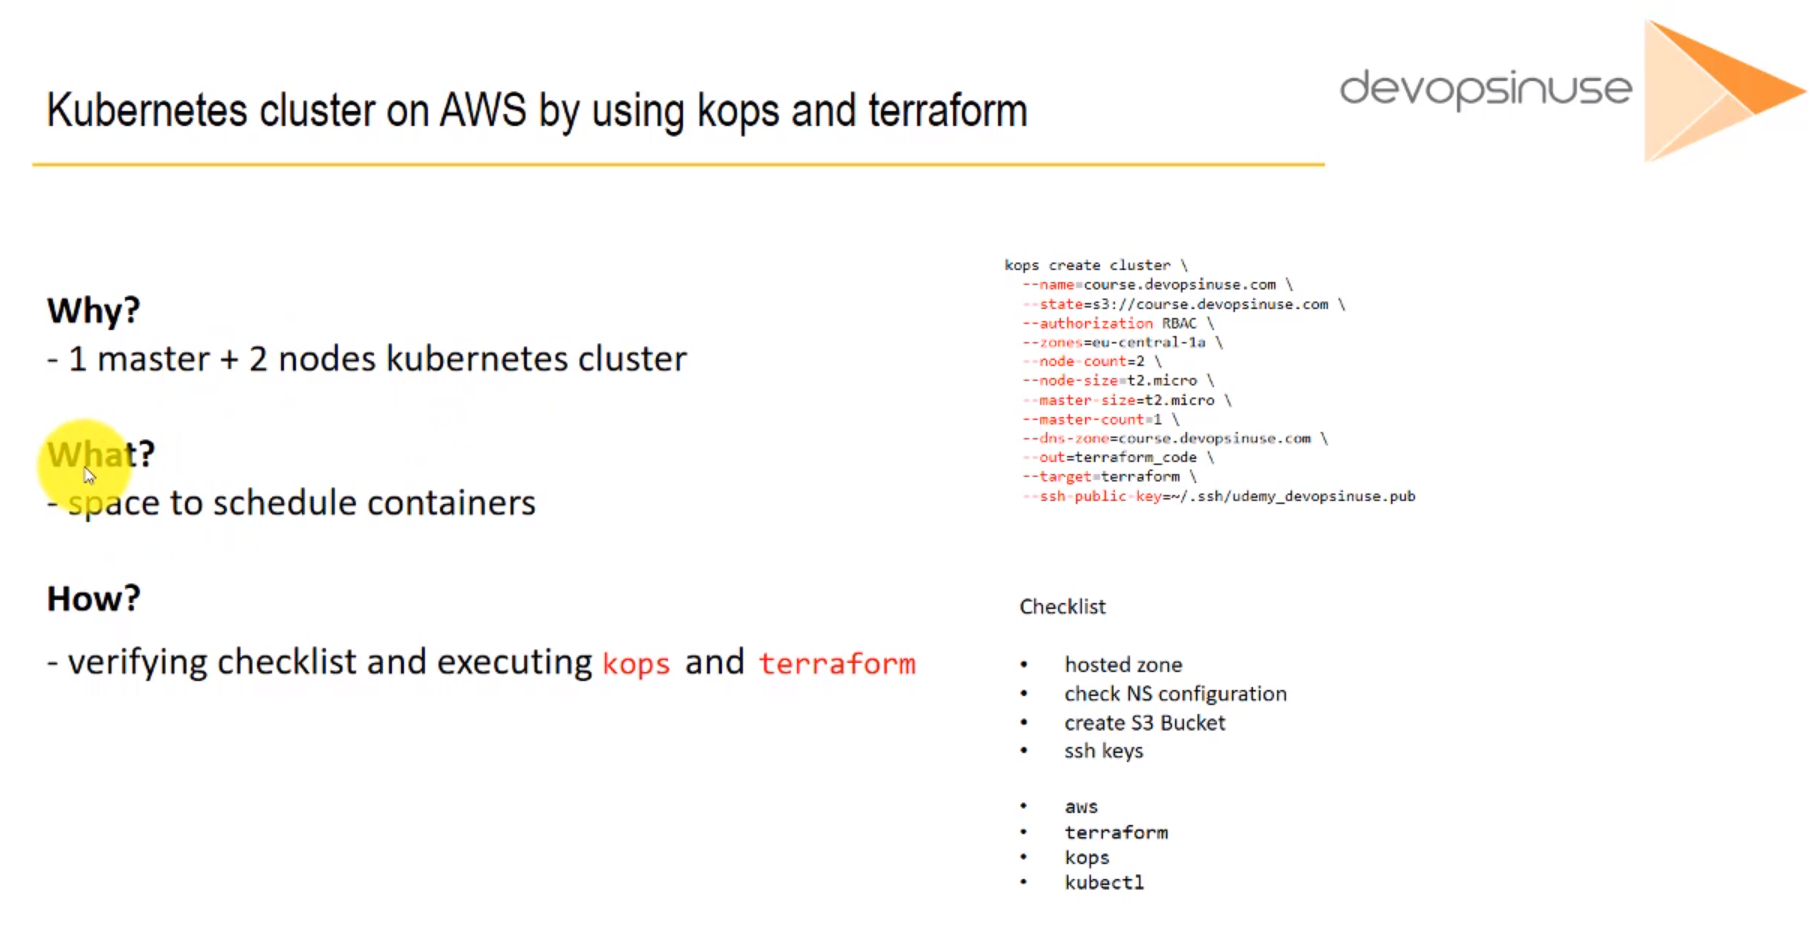
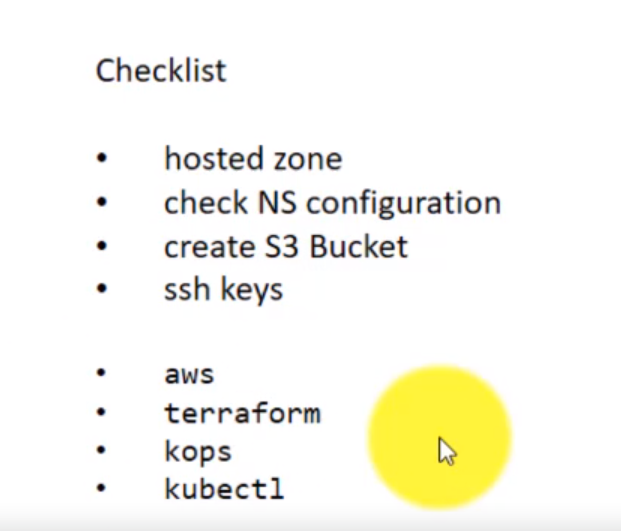
Lunching kubernetes cluster on AWSis explained in the 17. How to use kops and create Kubernetes cluster (Demo) chapter of the Learn Devops Kubernetes deployment by kops and terraform Udemy course.
- Ensure the keys are already created.
root@ubuntu-s-1vcpu-2gb-lon1-01:~# ls ~/.ssh
authorized_keys  known_hosts  udemy_devopsinuse  udemy_devopsinuse.pub
- Ensure the
kops_cluster.shdocument is already created.
root@ubuntu-s-1vcpu-2gb-lon1-01:~/kops_cluster# ls
devopsinuse_terraform  kops_cluster.sh
root@ubuntu-s-1vcpu-2gb-lon1-01:~/kops_cluster# cat kops_cluster.sh
kops create cluster \
  --name=kops.peelmicro.com \
  --state=s3://kops.peelmicro.com \
  --authorization RBAC \
  --zones=eu-central-1a \
  --node-count=2 \
  --node-size=t2.micro \
  --master-size=t2.micro \
  --master-count=1 \
  --dns-zone=kops.peelmicro.com \
  --out=devopsinuse_terraform \
  --target=terraform \
  --ssh-public-key=~/.ssh/udemy_devopsinuse.pub
- Ensure the
devopsinuse_terraformfolder is already created and it has thekuvernetes.tfinside.
root@ubuntu-s-1vcpu-2gb-lon1-01:~/kops_cluster# ls
devopsinuse_terraform  kops_cluster.sh
root@ubuntu-s-1vcpu-2gb-lon1-01:~/kops_cluster# ls devopsinuse_terraform/
data  kubernetes.tf  terraform.tfstate  terraform.tfstate.backup
- Execute
terraform plan
root@ubuntu-s-1vcpu-2gb-lon1-01:~/kops_cluster/devopsinuse_terraform# terraform plan
Refreshing Terraform state in-memory prior to plan...
The refreshed state will be used to calculate this plan, but will not be
persisted to local or remote state storage.
------------------------------------------------------------------------
An execution plan has been generated and is shown below.
Resource actions are indicated with the following symbols:
+ create
Terraform will perform the following actions:
+ aws_autoscaling_group.master-eu-central-1a-masters-kops-peelmicro-com
id: <computed>
arn: <computed>
availability_zones.#: <computed>
default_cooldown: <computed>
desired_capacity: <computed>
enabled_metrics.#: "8"
enabled_metrics.119681000: "GroupStandbyInstances"
enabled_metrics.1940933563: "GroupTotalInstances"
enabled_metrics.308948767: "GroupPendingInstances"
enabled_metrics.3267518000: "GroupTerminatingInstances"
enabled_metrics.3394537085: "GroupDesiredCapacity"
enabled_metrics.3551801763: "GroupInServiceInstances"
enabled_metrics.4118539418: "GroupMinSize"
enabled_metrics.4136111317: "GroupMaxSize"
force_delete: "false"
health_check_grace_period: "300"
health_check_type: <computed>
launch_configuration: "${aws_launch_configuration.master-eu-central-1a-masters-kops-peelmicro-com.id}"
load_balancers.#: <computed>
max_size: "1"
metrics_granularity: "1Minute"
min_size: "1"
name: "master-eu-central-1a.masters.kops.peelmicro.com"
protect_from_scale_in: "false"
service_linked_role_arn: <computed>
tag.#: "4"
tag.1601041186.key: "k8s.io/role/master"
tag.1601041186.propagate_at_launch: "true"
tag.1601041186.value: "1"
tag.296694174.key: "k8s.io/cluster-autoscaler/node-template/label/kops.k8s.io/instancegroup"
tag.296694174.propagate_at_launch: "true"
tag.296694174.value: "master-eu-central-1a"
tag.3218595536.key: "Name"
tag.3218595536.propagate_at_launch: "true"
tag.3218595536.value: "master-eu-central-1a.masters.kops.peelmicro.com"
tag.681420748.key: "KubernetesCluster"
tag.681420748.propagate_at_launch: "true"
tag.681420748.value: "kops.peelmicro.com"
target_group_arns.#: <computed>
vpc_zone_identifier.#: <computed>
wait_for_capacity_timeout: "10m"
+ aws_autoscaling_group.nodes-kops-peelmicro-com
id: <computed>
arn: <computed>
availability_zones.#: <computed>
default_cooldown: <computed>
desired_capacity: <computed>
enabled_metrics.#: "8"
enabled_metrics.119681000: "GroupStandbyInstances"
enabled_metrics.1940933563: "GroupTotalInstances"
enabled_metrics.308948767: "GroupPendingInstances"
enabled_metrics.3267518000: "GroupTerminatingInstances"
enabled_metrics.3394537085: "GroupDesiredCapacity"
enabled_metrics.3551801763: "GroupInServiceInstances"
enabled_metrics.4118539418: "GroupMinSize"
enabled_metrics.4136111317: "GroupMaxSize"
force_delete: "false"
health_check_grace_period: "300"
health_check_type: <computed>
launch_configuration: "${aws_launch_configuration.nodes-kops-peelmicro-com.id}"
load_balancers.#: <computed>
max_size: "2"
metrics_granularity: "1Minute"
min_size: "2"
name: "nodes.kops.peelmicro.com"
protect_from_scale_in: "false"
service_linked_role_arn: <computed>
tag.#: "4"
tag.1967977115.key: "k8s.io/role/node"
tag.1967977115.propagate_at_launch: "true"
tag.1967977115.value: "1"
tag.3438852489.key: "Name"
tag.3438852489.propagate_at_launch: "true"
tag.3438852489.value: "nodes.kops.peelmicro.com"
tag.681420748.key: "KubernetesCluster"
tag.681420748.propagate_at_launch: "true"
tag.681420748.value: "kops.peelmicro.com"
tag.859419842.key: "k8s.io/cluster-autoscaler/node-template/label/kops.k8s.io/instancegroup"
tag.859419842.propagate_at_launch: "true"
tag.859419842.value: "nodes"
target_group_arns.#: <computed>
vpc_zone_identifier.#: <computed>
wait_for_capacity_timeout: "10m"
+ aws_ebs_volume.a-etcd-events-kops-peelmicro-com
id: <computed>
arn: <computed>
availability_zone: "eu-central-1a"
encrypted: "false"
iops: <computed>
kms_key_id: <computed>
size: "20"
snapshot_id: <computed>
tags.%: "5"
tags.KubernetesCluster: "kops.peelmicro.com"
tags.Name: "a.etcd-events.kops.peelmicro.com"
tags.k8s.io/etcd/events: "a/a"
tags.k8s.io/role/master: "1"
tags.kubernetes.io/cluster/kops.peelmicro.com: "owned"
type: "gp2"
+ aws_ebs_volume.a-etcd-main-kops-peelmicro-com
id: <computed>
arn: <computed>
availability_zone: "eu-central-1a"
encrypted: "false"
iops: <computed>
kms_key_id: <computed>
size: "20"
snapshot_id: <computed>
tags.%: "5"
tags.KubernetesCluster: "kops.peelmicro.com"
tags.Name: "a.etcd-main.kops.peelmicro.com"
tags.k8s.io/etcd/main: "a/a"
tags.k8s.io/role/master: "1"
tags.kubernetes.io/cluster/kops.peelmicro.com: "owned"
type: "gp2"
+ aws_iam_instance_profile.masters-kops-peelmicro-com
id: <computed>
arn: <computed>
create_date: <computed>
name: "masters.kops.peelmicro.com"
path: "/"
role: "masters.kops.peelmicro.com"
roles.#: <computed>
unique_id: <computed>
+ aws_iam_instance_profile.nodes-kops-peelmicro-com
id: <computed>
arn: <computed>
create_date: <computed>
name: "nodes.kops.peelmicro.com"
path: "/"
role: "nodes.kops.peelmicro.com"
roles.#: <computed>
unique_id: <computed>
+ aws_iam_role.masters-kops-peelmicro-com
id: <computed>
arn: <computed>
assume_role_policy: "{\n \"Version\": \"2012-10-17\",\n \"Statement\": [\n {\n \"Effect\": \"Allow\",\n \"Principal\": { \"Service\": \"ec2.amazonaws.com\"},\n \"Action\": \"sts:AssumeRole\"\n }\n ]\n}"
create_date: <computed>
force_detach_policies: "false"
max_session_duration: "3600"
name: "masters.kops.peelmicro.com"
path: "/"
unique_id: <computed>
+ aws_iam_role.nodes-kops-peelmicro-com
id: <computed>
arn: <computed>
assume_role_policy: "{\n \"Version\": \"2012-10-17\",\n \"Statement\": [\n {\n \"Effect\": \"Allow\",\n \"Principal\": { \"Service\": \"ec2.amazonaws.com\"},\n \"Action\": \"sts:AssumeRole\"\n }\n ]\n}"
create_date: <computed>
force_detach_policies: "false"
max_session_duration: "3600"
name: "nodes.kops.peelmicro.com"
path: "/"
unique_id: <computed>
+ aws_iam_role_policy.masters-kops-peelmicro-com
id: <computed>
name: "masters.kops.peelmicro.com"
policy: "{\n \"Version\": \"2012-10-17\",\n \"Statement\": [\n {\n \"Effect\": \"Allow\",\n \"Action\": [\n \"ec2:DescribeInstances\",\n \"ec2:DescribeRegions\",\n \"ec2:DescribeRouteTables\",\n \"ec2:DescribeSecurityGroups\",\n \"ec2:DescribeSubnets\",\n \"ec2:DescribeVolumes\"\n ],\n \"Resource\": [\n \"*\"\n ]\n },\n {\n \"Effect\": \"Allow\",\n \"Action\": [\n \"ec2:CreateSecurityGroup\",\n \"ec2:CreateTags\",\n \"ec2:CreateVolume\",\n \"ec2:DescribeVolumesModifications\",\n \"ec2:ModifyInstanceAttribute\",\n \"ec2:ModifyVolume\"\n ],\n \"Resource\": [\n \"*\"\n ]\n },\n {\n \"Effect\": \"Allow\",\n \"Action\": [\n \"ec2:AttachVolume\",\n \"ec2:AuthorizeSecurityGroupIngress\",\n \"ec2:CreateRoute\",\n \"ec2:DeleteRoute\",\n \"ec2:DeleteSecurityGroup\",\n \"ec2:DeleteVolume\",\n \"ec2:DetachVolume\",\n \"ec2:RevokeSecurityGroupIngress\"\n ],\n \"Resource\": [\n \"*\"\n ],\n \"Condition\": {\n \"StringEquals\": {\n \"ec2:ResourceTag/KubernetesCluster\": \"kops.peelmicro.com\"\n }\n }\n },\n {\n \"Effect\": \"Allow\",\n \"Action\": [\n \"autoscaling:DescribeAutoScalingGroups\",\n \"autoscaling:DescribeLaunchConfigurations\",\n \"autoscaling:DescribeTags\"\n ],\n \"Resource\": [\n \"*\"\n ]\n },\n {\n \"Effect\": \"Allow\",\n \"Action\": [\n \"autoscaling:SetDesiredCapacity\",\n \"autoscaling:TerminateInstanceInAutoScalingGroup\",\n \"autoscaling:UpdateAutoScalingGroup\"\n ],\n \"Resource\": [\n \"*\"\n ],\n \"Condition\": {\n \"StringEquals\": {\n \"autoscaling:ResourceTag/KubernetesCluster\": \"kops.peelmicro.com\"\n }\n }\n },\n {\n \"Effect\": \"Allow\",\n \"Action\": [\n \"elasticloadbalancing:AddTags\",\n \"elasticloadbalancing:AttachLoadBalancerToSubnets\",\n \"elasticloadbalancing:ApplySecurityGroupsToLoadBalancer\",\n \"elasticloadbalancing:CreateLoadBalancer\",\n \"elasticloadbalancing:CreateLoadBalancerPolicy\",\n \"elasticloadbalancing:CreateLoadBalancerListeners\",\n \"elasticloadbalancing:ConfigureHealthCheck\",\n \"elasticloadbalancing:DeleteLoadBalancer\",\n \"elasticloadbalancing:DeleteLoadBalancerListeners\",\n \"elasticloadbalancing:DescribeLoadBalancers\",\n \"elasticloadbalancing:DescribeLoadBalancerAttributes\",\n \"elasticloadbalancing:DetachLoadBalancerFromSubnets\",\n \"elasticloadbalancing:DeregisterInstancesFromLoadBalancer\",\n \"elasticloadbalancing:ModifyLoadBalancerAttributes\",\n \"elasticloadbalancing:RegisterInstancesWithLoadBalancer\",\n \"elasticloadbalancing:SetLoadBalancerPoliciesForBackendServer\"\n ],\n \"Resource\": [\n \"*\"\n ]\n },\n {\n \"Effect\": \"Allow\",\n \"Action\": [\n \"ec2:DescribeVpcs\",\n \"elasticloadbalancing:AddTags\",\n \"elasticloadbalancing:CreateListener\",\n \"elasticloadbalancing:CreateTargetGroup\",\n \"elasticloadbalancing:DeleteListener\",\n \"elasticloadbalancing:DeleteTargetGroup\",\n \"elasticloadbalancing:DescribeListeners\",\n \"elasticloadbalancing:DescribeLoadBalancerPolicies\",\n \"elasticloadbalancing:DescribeTargetGroups\",\n \"elasticloadbalancing:DescribeTargetHealth\",\n \"elasticloadbalancing:ModifyListener\",\n \"elasticloadbalancing:ModifyTargetGroup\",\n \"elasticloadbalancing:RegisterTargets\",\n \"elasticloadbalancing:SetLoadBalancerPoliciesOfListener\"\n ],\n \"Resource\": [\n \"*\"\n ]\n },\n {\n \"Effect\": \"Allow\",\n \"Action\": [\n \"iam:ListServerCertificates\",\n \"iam:GetServerCertificate\"\n ],\n \"Resource\": [\n \"*\"\n ]\n },\n {\n \"Effect\": \"Allow\",\n \"Action\": [\n \"s3:GetBucketLocation\",\n \"s3:ListBucket\"\n ],\n \"Resource\": [\n \"arn:aws:s3:::kops.peelmicro.com\"\n ]\n },\n {\n \"Effect\": \"Allow\",\n \"Action\": [\n \"s3:Get*\"\n ],\n \"Resource\": \"arn:aws:s3:::kops.peelmicro.com/kops.peelmicro.com/*\"\n },\n {\n \"Effect\": \"Allow\",\n \"Action\": [\n \"route53:ChangeResourceRecordSets\",\n \"route53:ListResourceRecordSets\",\n \"route53:GetHostedZone\"\n ],\n \"Resource\": [\n \"arn:aws:route53:::hostedzone/ZQF46NG2DUXIJ\"\n ]\n },\n {\n \"Effect\": \"Allow\",\n \"Action\": [\n \"route53:GetChange\"\n ],\n \"Resource\": [\n \"arn:aws:route53:::change/*\"\n ]\n },\n {\n \"Effect\": \"Allow\",\n \"Action\": [\n \"route53:ListHostedZones\"\n ],\n \"Resource\": [\n \"*\"\n ]\n },\n {\n \"Effect\": \"Allow\",\n \"Action\": [\n \"ecr:GetAuthorizationToken\",\n \"ecr:BatchCheckLayerAvailability\",\n \"ecr:GetDownloadUrlForLayer\",\n \"ecr:GetRepositoryPolicy\",\n \"ecr:DescribeRepositories\",\n \"ecr:ListImages\",\n \"ecr:BatchGetImage\"\n ],\n \"Resource\": [\n \"*\"\n ]\n }\n ]\n}"
role: "masters.kops.peelmicro.com"
+ aws_iam_role_policy.nodes-kops-peelmicro-com
id: <computed>
name: "nodes.kops.peelmicro.com"
policy: "{\n \"Version\": \"2012-10-17\",\n \"Statement\": [\n {\n \"Effect\": \"Allow\",\n \"Action\": [\n \"ec2:DescribeInstances\",\n \"ec2:DescribeRegions\"\n ],\n \"Resource\": [\n \"*\"\n ]\n },\n {\n \"Effect\": \"Allow\",\n \"Action\": [\n \"s3:GetBucketLocation\",\n \"s3:ListBucket\"\n ],\n \"Resource\": [\n \"arn:aws:s3:::kops.peelmicro.com\"\n ]\n },\n {\n \"Effect\": \"Allow\",\n \"Action\": [\n \"s3:Get*\"\n ],\n \"Resource\": [\n \"arn:aws:s3:::kops.peelmicro.com/kops.peelmicro.com/addons/*\",\n \"arn:aws:s3:::kops.peelmicro.com/kops.peelmicro.com/cluster.spec\",\n \"arn:aws:s3:::kops.peelmicro.com/kops.peelmicro.com/config\",\n \"arn:aws:s3:::kops.peelmicro.com/kops.peelmicro.com/instancegroup/*\",\n \"arn:aws:s3:::kops.peelmicro.com/kops.peelmicro.com/pki/issued/*\",\n \"arn:aws:s3:::kops.peelmicro.com/kops.peelmicro.com/pki/private/kube-proxy/*\",\n \"arn:aws:s3:::kops.peelmicro.com/kops.peelmicro.com/pki/private/kubelet/*\",\n \"arn:aws:s3:::kops.peelmicro.com/kops.peelmicro.com/pki/ssh/*\",\n \"arn:aws:s3:::kops.peelmicro.com/kops.peelmicro.com/secrets/dockerconfig\"\n ]\n },\n {\n \"Effect\": \"Allow\",\n \"Action\": [\n \"ecr:GetAuthorizationToken\",\n \"ecr:BatchCheckLayerAvailability\",\n \"ecr:GetDownloadUrlForLayer\",\n \"ecr:GetRepositoryPolicy\",\n \"ecr:DescribeRepositories\",\n \"ecr:ListImages\",\n \"ecr:BatchGetImage\"\n ],\n \"Resource\": [\n \"*\"\n ]\n }\n ]\n}"
role: "nodes.kops.peelmicro.com"
+ aws_internet_gateway.kops-peelmicro-com
id: <computed>
owner_id: <computed>
tags.%: "3"
tags.KubernetesCluster: "kops.peelmicro.com"
tags.Name: "kops.peelmicro.com"
tags.kubernetes.io/cluster/kops.peelmicro.com: "owned"
vpc_id: "${aws_vpc.kops-peelmicro-com.id}"
+ aws_key_pair.kubernetes-kops-peelmicro-com-14f4e587b84d4819f287bedfda85ac26
id: <computed>
fingerprint: <computed>
key_name: "kubernetes.kops.peelmicro.com-14:f4:e5:87:b8:4d:48:19:f2:87:be:df:da:85:ac:26"
public_key: "ssh-rsa AAAAB3NzaC1yc2EAAAADAQABAAABAQDjBXziCHemhPndqIdzwKXyTw32UdZs+OVUWvCpwy1pRubg8oZpbFXQ92uGvWVFhbIh8wYv7bgmxi6Gaw8xbdBiDoOwx18PdEgmbcFw7O0tXKUMoke/tn3izeUbliNyD21OwSMwkNoaUJqkBJ2fHKjOrDxUGP/5M6iLfgzXTD/6oDG2USLoHIZBQtRBivb/k8IbW6dAveHhziuG87KtcW0lti0n4denWJV8R6fMEXLEaOTbtD17LOfQGWK8la1IwmNVhPuKMSBUOjfNk2sVv7dRO6EL+zK8WvAagnRl15yX3i097Lg6ql5Hvukk1aeJ5QCZa78hnYYDFL6d1DHbOgi1 root@ubuntu-s-1vcpu-2gb-lon1-01"
+ aws_launch_configuration.master-eu-central-1a-masters-kops-peelmicro-com
id: <computed>
associate_public_ip_address: "true"
ebs_block_device.#: <computed>
ebs_optimized: <computed>
enable_monitoring: "false"
iam_instance_profile: "${aws_iam_instance_profile.masters-kops-peelmicro-com.id}"
image_id: "ami-0692cb5ffed92e0c7"
instance_type: "t2.micro"
key_name: "${aws_key_pair.kubernetes-kops-peelmicro-com-14f4e587b84d4819f287bedfda85ac26.id}"
name: <computed>
name_prefix: "master-eu-central-1a.masters.kops.peelmicro.com-"
root_block_device.#: "1"
root_block_device.0.delete_on_termination: "true"
root_block_device.0.iops: <computed>
root_block_device.0.volume_size: "64"
root_block_device.0.volume_type: "gp2"
security_groups.#: <computed>
user_data: "c4de9593d17ce259846182486013d03d8782e455"
+ aws_launch_configuration.nodes-kops-peelmicro-com
id: <computed>
associate_public_ip_address: "true"
ebs_block_device.#: <computed>
ebs_optimized: <computed>
enable_monitoring: "false"
iam_instance_profile: "${aws_iam_instance_profile.nodes-kops-peelmicro-com.id}"
image_id: "ami-0692cb5ffed92e0c7"
instance_type: "t2.micro"
key_name: "${aws_key_pair.kubernetes-kops-peelmicro-com-14f4e587b84d4819f287bedfda85ac26.id}"
name: <computed>
name_prefix: "nodes.kops.peelmicro.com-"
root_block_device.#: "1"
root_block_device.0.delete_on_termination: "true"
root_block_device.0.iops: <computed>
root_block_device.0.volume_size: "128"
root_block_device.0.volume_type: "gp2"
security_groups.#: <computed>
user_data: "0211e7563e5b67305d61bb6211bceef691e20c32"
+ aws_route.0-0-0-0--0
id: <computed>
destination_cidr_block: "0.0.0.0/0"
destination_prefix_list_id: <computed>
egress_only_gateway_id: <computed>
gateway_id: "${aws_internet_gateway.kops-peelmicro-com.id}"
instance_id: <computed>
instance_owner_id: <computed>
nat_gateway_id: <computed>
network_interface_id: <computed>
origin: <computed>
route_table_id: "${aws_route_table.kops-peelmicro-com.id}"
state: <computed>
+ aws_route_table.kops-peelmicro-com
id: <computed>
owner_id: <computed>
propagating_vgws.#: <computed>
route.#: <computed>
tags.%: "4"
tags.KubernetesCluster: "kops.peelmicro.com"
tags.Name: "kops.peelmicro.com"
tags.kubernetes.io/cluster/kops.peelmicro.com: "owned"
tags.kubernetes.io/kops/role: "public"
vpc_id: "${aws_vpc.kops-peelmicro-com.id}"
+ aws_route_table_association.eu-central-1a-kops-peelmicro-com
id: <computed>
route_table_id: "${aws_route_table.kops-peelmicro-com.id}"
subnet_id: "${aws_subnet.eu-central-1a-kops-peelmicro-com.id}"
+ aws_security_group.masters-kops-peelmicro-com
id: <computed>
arn: <computed>
description: "Security group for masters"
egress.#: <computed>
ingress.#: <computed>
name: "masters.kops.peelmicro.com"
owner_id: <computed>
revoke_rules_on_delete: "false"
tags.%: "3"
tags.KubernetesCluster: "kops.peelmicro.com"
tags.Name: "masters.kops.peelmicro.com"
tags.kubernetes.io/cluster/kops.peelmicro.com: "owned"
vpc_id: "${aws_vpc.kops-peelmicro-com.id}"
+ aws_security_group.nodes-kops-peelmicro-com
id: <computed>
arn: <computed>
description: "Security group for nodes"
egress.#: <computed>
ingress.#: <computed>
name: "nodes.kops.peelmicro.com"
owner_id: <computed>
revoke_rules_on_delete: "false"
tags.%: "3"
tags.KubernetesCluster: "kops.peelmicro.com"
tags.Name: "nodes.kops.peelmicro.com"
tags.kubernetes.io/cluster/kops.peelmicro.com: "owned"
vpc_id: "${aws_vpc.kops-peelmicro-com.id}"
+ aws_security_group_rule.all-master-to-master
id: <computed>
from_port: "0"
protocol: "-1"
security_group_id: "${aws_security_group.masters-kops-peelmicro-com.id}"
self: "false"
source_security_group_id: "${aws_security_group.masters-kops-peelmicro-com.id}"
to_port: "0"
type: "ingress"
+ aws_security_group_rule.all-master-to-node
id: <computed>
from_port: "0"
protocol: "-1"
security_group_id: "${aws_security_group.nodes-kops-peelmicro-com.id}"
self: "false"
source_security_group_id: "${aws_security_group.masters-kops-peelmicro-com.id}"
to_port: "0"
type: "ingress"
+ aws_security_group_rule.all-node-to-node
id: <computed>
from_port: "0"
protocol: "-1"
security_group_id: "${aws_security_group.nodes-kops-peelmicro-com.id}"
self: "false"
source_security_group_id: "${aws_security_group.nodes-kops-peelmicro-com.id}"
to_port: "0"
type: "ingress"
+ aws_security_group_rule.https-external-to-master-0-0-0-0--0
id: <computed>
cidr_blocks.#: "1"
cidr_blocks.0: "0.0.0.0/0"
from_port: "443"
protocol: "tcp"
security_group_id: "${aws_security_group.masters-kops-peelmicro-com.id}"
self: "false"
source_security_group_id: <computed>
to_port: "443"
type: "ingress"
+ aws_security_group_rule.master-egress
id: <computed>
cidr_blocks.#: "1"
cidr_blocks.0: "0.0.0.0/0"
from_port: "0"
protocol: "-1"
security_group_id: "${aws_security_group.masters-kops-peelmicro-com.id}"
self: "false"
source_security_group_id: <computed>
to_port: "0"
type: "egress"
+ aws_security_group_rule.node-egress
id: <computed>
cidr_blocks.#: "1"
cidr_blocks.0: "0.0.0.0/0"
from_port: "0"
protocol: "-1"
security_group_id: "${aws_security_group.nodes-kops-peelmicro-com.id}"
self: "false"
source_security_group_id: <computed>
to_port: "0"
type: "egress"
+ aws_security_group_rule.node-to-master-tcp-1-2379
id: <computed>
from_port: "1"
protocol: "tcp"
security_group_id: "${aws_security_group.masters-kops-peelmicro-com.id}"
self: "false"
source_security_group_id: "${aws_security_group.nodes-kops-peelmicro-com.id}"
to_port: "2379"
type: "ingress"
+ aws_security_group_rule.node-to-master-tcp-2382-4000
id: <computed>
from_port: "2382"
protocol: "tcp"
security_group_id: "${aws_security_group.masters-kops-peelmicro-com.id}"
self: "false"
source_security_group_id: "${aws_security_group.nodes-kops-peelmicro-com.id}"
to_port: "4000"
type: "ingress"
+ aws_security_group_rule.node-to-master-tcp-4003-65535
id: <computed>
from_port: "4003"
protocol: "tcp"
security_group_id: "${aws_security_group.masters-kops-peelmicro-com.id}"
self: "false"
source_security_group_id: "${aws_security_group.nodes-kops-peelmicro-com.id}"
to_port: "65535"
type: "ingress"
+ aws_security_group_rule.node-to-master-udp-1-65535
id: <computed>
from_port: "1"
protocol: "udp"
security_group_id: "${aws_security_group.masters-kops-peelmicro-com.id}"
self: "false"
source_security_group_id: "${aws_security_group.nodes-kops-peelmicro-com.id}"
to_port: "65535"
type: "ingress"
+ aws_security_group_rule.ssh-external-to-master-0-0-0-0--0
id: <computed>
cidr_blocks.#: "1"
cidr_blocks.0: "0.0.0.0/0"
from_port: "22"
protocol: "tcp"
security_group_id: "${aws_security_group.masters-kops-peelmicro-com.id}"
self: "false"
source_security_group_id: <computed>
to_port: "22"
type: "ingress"
+ aws_security_group_rule.ssh-external-to-node-0-0-0-0--0
id: <computed>
cidr_blocks.#: "1"
cidr_blocks.0: "0.0.0.0/0"
from_port: "22"
protocol: "tcp"
security_group_id: "${aws_security_group.nodes-kops-peelmicro-com.id}"
self: "false"
source_security_group_id: <computed>
to_port: "22"
type: "ingress"
+ aws_subnet.eu-central-1a-kops-peelmicro-com
id: <computed>
arn: <computed>
assign_ipv6_address_on_creation: "false"
availability_zone: "eu-central-1a"
availability_zone_id: <computed>
cidr_block: "172.20.32.0/19"
ipv6_cidr_block: <computed>
ipv6_cidr_block_association_id: <computed>
map_public_ip_on_launch: "false"
owner_id: <computed>
tags.%: "5"
tags.KubernetesCluster: "kops.peelmicro.com"
tags.Name: "eu-central-1a.kops.peelmicro.com"
tags.SubnetType: "Public"
tags.kubernetes.io/cluster/kops.peelmicro.com: "owned"
tags.kubernetes.io/role/elb: "1"
vpc_id: "${aws_vpc.kops-peelmicro-com.id}"
+ aws_vpc.kops-peelmicro-com
id: <computed>
arn: <computed>
assign_generated_ipv6_cidr_block: "false"
cidr_block: "172.20.0.0/16"
default_network_acl_id: <computed>
default_route_table_id: <computed>
default_security_group_id: <computed>
dhcp_options_id: <computed>
enable_classiclink: <computed>
enable_classiclink_dns_support: <computed>
enable_dns_hostnames: "true"
enable_dns_support: "true"
instance_tenancy: "default"
ipv6_association_id: <computed>
ipv6_cidr_block: <computed>
main_route_table_id: <computed>
owner_id: <computed>
tags.%: "3"
tags.KubernetesCluster: "kops.peelmicro.com"
tags.Name: "kops.peelmicro.com"
tags.kubernetes.io/cluster/kops.peelmicro.com: "owned"
+ aws_vpc_dhcp_options.kops-peelmicro-com
id: <computed>
domain_name: "eu-central-1.compute.internal"
domain_name_servers.#: "1"
domain_name_servers.0: "AmazonProvidedDNS"
owner_id: <computed>
tags.%: "3"
tags.KubernetesCluster: "kops.peelmicro.com"
tags.Name: "kops.peelmicro.com"
tags.kubernetes.io/cluster/kops.peelmicro.com: "owned"
+ aws_vpc_dhcp_options_association.kops-peelmicro-com
id: <computed>
dhcp_options_id: "${aws_vpc_dhcp_options.kops-peelmicro-com.id}"
vpc_id: "${aws_vpc.kops-peelmicro-com.id}"
Plan: 35 to add, 0 to change, 0 to destroy.
------------------------------------------------------------------------
Note: You didn't specify an "-out" parameter to save this plan, so Terraform
can't guarantee that exactly these actions will be performed if
"terraform apply" is subsequently run.
- Execute
terraform init
root@ubuntu-s-1vcpu-2gb-lon1-01:~/kops_cluster/devopsinuse_terraform# terraform init

Initializing provider plugins...

The following providers do not have any version constraints in configuration,
so the latest version was installed.

To prevent automatic upgrades to new major versions that may contain breaking
changes, it is recommended to add version = "..." constraints to the
corresponding provider blocks in configuration, with the constraint strings
suggested below.

* provider.aws: version = "~> 2.0"

Terraform has been successfully initialized!

You may now begin working with Terraform. Try running "terraform plan" to see
any changes that are required for your infrastructure. All Terraform commands
should now work.

If you ever set or change modules or backend configuration for Terraform,
rerun this command to reinitialize your working directory. If you forget, other
commands will detect it and remind you to do so if necessary.
- Execute
terraform applyto deploy the cluster.
root@ubuntu-s-1vcpu-2gb-lon1-01:~/kops_cluster/devopsinuse_terraform# terraform apply
An execution plan has been generated and is shown below.
Resource actions are indicated with the following symbols:
+ create
Terraform will perform the following actions:
+ aws_autoscaling_group.master-eu-central-1a-masters-kops-peelmicro-com
id: <computed>
arn: <computed>
availability_zones.#: <computed>
default_cooldown: <computed>
desired_capacity: <computed>
enabled_metrics.#: "8"
enabled_metrics.119681000: "GroupStandbyInstances"
enabled_metrics.1940933563: "GroupTotalInstances"
enabled_metrics.308948767: "GroupPendingInstances"
enabled_metrics.3267518000: "GroupTerminatingInstances"
enabled_metrics.3394537085: "GroupDesiredCapacity"
enabled_metrics.3551801763: "GroupInServiceInstances"
enabled_metrics.4118539418: "GroupMinSize"
enabled_metrics.4136111317: "GroupMaxSize"
force_delete: "false"
health_check_grace_period: "300"
health_check_type: <computed>
launch_configuration: "${aws_launch_configuration.master-eu-central-1a-masters-kops-peelmicro-com.id}"
load_balancers.#: <computed>
max_size: "1"
metrics_granularity: "1Minute"
min_size: "1"
name: "master-eu-central-1a.masters.kops.peelmicro.com"
protect_from_scale_in: "false"
service_linked_role_arn: <computed>
tag.#: "4"
tag.1601041186.key: "k8s.io/role/master"
tag.1601041186.propagate_at_launch: "true"
tag.1601041186.value: "1"
tag.296694174.key: "k8s.io/cluster-autoscaler/node-template/label/kops.k8s.io/instancegroup"
tag.296694174.propagate_at_launch: "true"
tag.296694174.value: "master-eu-central-1a"
tag.3218595536.key: "Name"
tag.3218595536.propagate_at_launch: "true"
tag.3218595536.value: "master-eu-central-1a.masters.kops.peelmicro.com"
tag.681420748.key: "KubernetesCluster"
tag.681420748.propagate_at_launch: "true"
tag.681420748.value: "kops.peelmicro.com"
target_group_arns.#: <computed>
vpc_zone_identifier.#: <computed>
wait_for_capacity_timeout: "10m"
+ aws_autoscaling_group.nodes-kops-peelmicro-com
id: <computed>
arn: <computed>
availability_zones.#: <computed>
default_cooldown: <computed>
desired_capacity: <computed>
enabled_metrics.#: "8"
enabled_metrics.119681000: "GroupStandbyInstances"
enabled_metrics.1940933563: "GroupTotalInstances"
enabled_metrics.308948767: "GroupPendingInstances"
enabled_metrics.3267518000: "GroupTerminatingInstances"
enabled_metrics.3394537085: "GroupDesiredCapacity"
enabled_metrics.3551801763: "GroupInServiceInstances"
enabled_metrics.4118539418: "GroupMinSize"
enabled_metrics.4136111317: "GroupMaxSize"
force_delete: "false"
health_check_grace_period: "300"
health_check_type: <computed>
launch_configuration: "${aws_launch_configuration.nodes-kops-peelmicro-com.id}"
load_balancers.#: <computed>
max_size: "2"
metrics_granularity: "1Minute"
min_size: "2"
name: "nodes.kops.peelmicro.com"
protect_from_scale_in: "false"
service_linked_role_arn: <computed>
tag.#: "4"
tag.1967977115.key: "k8s.io/role/node"
tag.1967977115.propagate_at_launch: "true"
tag.1967977115.value: "1"
tag.3438852489.key: "Name"
tag.3438852489.propagate_at_launch: "true"
tag.3438852489.value: "nodes.kops.peelmicro.com"
tag.681420748.key: "KubernetesCluster"
tag.681420748.propagate_at_launch: "true"
tag.681420748.value: "kops.peelmicro.com"
tag.859419842.key: "k8s.io/cluster-autoscaler/node-template/label/kops.k8s.io/instancegroup"
tag.859419842.propagate_at_launch: "true"
tag.859419842.value: "nodes"
target_group_arns.#: <computed>
vpc_zone_identifier.#: <computed>
wait_for_capacity_timeout: "10m"
+ aws_ebs_volume.a-etcd-events-kops-peelmicro-com
id: <computed>
arn: <computed>
availability_zone: "eu-central-1a"
encrypted: "false"
iops: <computed>
kms_key_id: <computed>
size: "20"
snapshot_id: <computed>
tags.%: "5"
tags.KubernetesCluster: "kops.peelmicro.com"
tags.Name: "a.etcd-events.kops.peelmicro.com"
tags.k8s.io/etcd/events: "a/a"
tags.k8s.io/role/master: "1"
tags.kubernetes.io/cluster/kops.peelmicro.com: "owned"
type: "gp2"
+ aws_ebs_volume.a-etcd-main-kops-peelmicro-com
id: <computed>
arn: <computed>
availability_zone: "eu-central-1a"
encrypted: "false"
iops: <computed>
kms_key_id: <computed>
size: "20"
snapshot_id: <computed>
tags.%: "5"
tags.KubernetesCluster: "kops.peelmicro.com"
tags.Name: "a.etcd-main.kops.peelmicro.com"
tags.k8s.io/etcd/main: "a/a"
tags.k8s.io/role/master: "1"
tags.kubernetes.io/cluster/kops.peelmicro.com: "owned"
type: "gp2"
+ aws_iam_instance_profile.masters-kops-peelmicro-com
id: <computed>
arn: <computed>
create_date: <computed>
name: "masters.kops.peelmicro.com"
path: "/"
role: "masters.kops.peelmicro.com"
roles.#: <computed>
unique_id: <computed>
+ aws_iam_instance_profile.nodes-kops-peelmicro-com
id: <computed>
arn: <computed>
create_date: <computed>
name: "nodes.kops.peelmicro.com"
path: "/"
role: "nodes.kops.peelmicro.com"
roles.#: <computed>
unique_id: <computed>
+ aws_iam_role.masters-kops-peelmicro-com
id: <computed>
arn: <computed>
assume_role_policy: "{\n \"Version\": \"2012-10-17\",\n \"Statement\": [\n {\n \"Effect\": \"Allow\",\n \"Principal\": { \"Service\": \"ec2.amazonaws.com\"},\n \"Action\": \"sts:AssumeRole\"\n }\n ]\n}"
create_date: <computed>
force_detach_policies: "false"
max_session_duration: "3600"
name: "masters.kops.peelmicro.com"
path: "/"
unique_id: <computed>
+ aws_iam_role.nodes-kops-peelmicro-com
id: <computed>
arn: <computed>
assume_role_policy: "{\n \"Version\": \"2012-10-17\",\n \"Statement\": [\n {\n \"Effect\": \"Allow\",\n \"Principal\": { \"Service\": \"ec2.amazonaws.com\"},\n \"Action\": \"sts:AssumeRole\"\n }\n ]\n}"
create_date: <computed>
force_detach_policies: "false"
max_session_duration: "3600"
name: "nodes.kops.peelmicro.com"
path: "/"
unique_id: <computed>
+ aws_iam_role_policy.masters-kops-peelmicro-com
id: <computed>
name: "masters.kops.peelmicro.com"
policy: "{\n \"Version\": \"2012-10-17\",\n \"Statement\": [\n {\n \"Effect\": \"Allow\",\n \"Action\": [\n \"ec2:DescribeInstances\",\n \"ec2:DescribeRegions\",\n \"ec2:DescribeRouteTables\",\n \"ec2:DescribeSecurityGroups\",\n \"ec2:DescribeSubnets\",\n \"ec2:DescribeVolumes\"\n ],\n \"Resource\": [\n \"*\"\n ]\n },\n {\n \"Effect\": \"Allow\",\n \"Action\": [\n \"ec2:CreateSecurityGroup\",\n \"ec2:CreateTags\",\n \"ec2:CreateVolume\",\n \"ec2:DescribeVolumesModifications\",\n \"ec2:ModifyInstanceAttribute\",\n \"ec2:ModifyVolume\"\n ],\n \"Resource\": [\n \"*\"\n ]\n },\n {\n \"Effect\": \"Allow\",\n \"Action\": [\n \"ec2:AttachVolume\",\n \"ec2:AuthorizeSecurityGroupIngress\",\n \"ec2:CreateRoute\",\n \"ec2:DeleteRoute\",\n \"ec2:DeleteSecurityGroup\",\n \"ec2:DeleteVolume\",\n \"ec2:DetachVolume\",\n \"ec2:RevokeSecurityGroupIngress\"\n ],\n \"Resource\": [\n \"*\"\n ],\n \"Condition\": {\n \"StringEquals\": {\n \"ec2:ResourceTag/KubernetesCluster\": \"kops.peelmicro.com\"\n }\n }\n },\n {\n \"Effect\": \"Allow\",\n \"Action\": [\n \"autoscaling:DescribeAutoScalingGroups\",\n \"autoscaling:DescribeLaunchConfigurations\",\n \"autoscaling:DescribeTags\"\n ],\n \"Resource\": [\n \"*\"\n ]\n },\n {\n \"Effect\": \"Allow\",\n \"Action\": [\n \"autoscaling:SetDesiredCapacity\",\n \"autoscaling:TerminateInstanceInAutoScalingGroup\",\n \"autoscaling:UpdateAutoScalingGroup\"\n ],\n \"Resource\": [\n \"*\"\n ],\n \"Condition\": {\n \"StringEquals\": {\n \"autoscaling:ResourceTag/KubernetesCluster\": \"kops.peelmicro.com\"\n }\n }\n },\n {\n \"Effect\": \"Allow\",\n \"Action\": [\n \"elasticloadbalancing:AddTags\",\n \"elasticloadbalancing:AttachLoadBalancerToSubnets\",\n \"elasticloadbalancing:ApplySecurityGroupsToLoadBalancer\",\n \"elasticloadbalancing:CreateLoadBalancer\",\n \"elasticloadbalancing:CreateLoadBalancerPolicy\",\n \"elasticloadbalancing:CreateLoadBalancerListeners\",\n \"elasticloadbalancing:ConfigureHealthCheck\",\n \"elasticloadbalancing:DeleteLoadBalancer\",\n \"elasticloadbalancing:DeleteLoadBalancerListeners\",\n \"elasticloadbalancing:DescribeLoadBalancers\",\n \"elasticloadbalancing:DescribeLoadBalancerAttributes\",\n \"elasticloadbalancing:DetachLoadBalancerFromSubnets\",\n \"elasticloadbalancing:DeregisterInstancesFromLoadBalancer\",\n \"elasticloadbalancing:ModifyLoadBalancerAttributes\",\n \"elasticloadbalancing:RegisterInstancesWithLoadBalancer\",\n \"elasticloadbalancing:SetLoadBalancerPoliciesForBackendServer\"\n ],\n \"Resource\": [\n \"*\"\n ]\n },\n {\n \"Effect\": \"Allow\",\n \"Action\": [\n \"ec2:DescribeVpcs\",\n \"elasticloadbalancing:AddTags\",\n \"elasticloadbalancing:CreateListener\",\n \"elasticloadbalancing:CreateTargetGroup\",\n \"elasticloadbalancing:DeleteListener\",\n \"elasticloadbalancing:DeleteTargetGroup\",\n \"elasticloadbalancing:DescribeListeners\",\n \"elasticloadbalancing:DescribeLoadBalancerPolicies\",\n \"elasticloadbalancing:DescribeTargetGroups\",\n \"elasticloadbalancing:DescribeTargetHealth\",\n \"elasticloadbalancing:ModifyListener\",\n \"elasticloadbalancing:ModifyTargetGroup\",\n \"elasticloadbalancing:RegisterTargets\",\n \"elasticloadbalancing:SetLoadBalancerPoliciesOfListener\"\n ],\n \"Resource\": [\n \"*\"\n ]\n },\n {\n \"Effect\": \"Allow\",\n \"Action\": [\n \"iam:ListServerCertificates\",\n \"iam:GetServerCertificate\"\n ],\n \"Resource\": [\n \"*\"\n ]\n },\n {\n \"Effect\": \"Allow\",\n \"Action\": [\n \"s3:GetBucketLocation\",\n \"s3:ListBucket\"\n ],\n \"Resource\": [\n \"arn:aws:s3:::kops.peelmicro.com\"\n ]\n },\n {\n \"Effect\": \"Allow\",\n \"Action\": [\n \"s3:Get*\"\n ],\n \"Resource\": \"arn:aws:s3:::kops.peelmicro.com/kops.peelmicro.com/*\"\n },\n {\n \"Effect\": \"Allow\",\n \"Action\": [\n \"route53:ChangeResourceRecordSets\",\n \"route53:ListResourceRecordSets\",\n \"route53:GetHostedZone\"\n ],\n \"Resource\": [\n \"arn:aws:route53:::hostedzone/ZQF46NG2DUXIJ\"\n ]\n },\n {\n \"Effect\": \"Allow\",\n \"Action\": [\n \"route53:GetChange\"\n ],\n \"Resource\": [\n \"arn:aws:route53:::change/*\"\n ]\n },\n {\n \"Effect\": \"Allow\",\n \"Action\": [\n \"route53:ListHostedZones\"\n ],\n \"Resource\": [\n \"*\"\n ]\n },\n {\n \"Effect\": \"Allow\",\n \"Action\": [\n \"ecr:GetAuthorizationToken\",\n \"ecr:BatchCheckLayerAvailability\",\n \"ecr:GetDownloadUrlForLayer\",\n \"ecr:GetRepositoryPolicy\",\n \"ecr:DescribeRepositories\",\n \"ecr:ListImages\",\n \"ecr:BatchGetImage\"\n ],\n \"Resource\": [\n \"*\"\n ]\n }\n ]\n}"
role: "masters.kops.peelmicro.com"
+ aws_iam_role_policy.nodes-kops-peelmicro-com
id: <computed>
name: "nodes.kops.peelmicro.com"
policy: "{\n \"Version\": \"2012-10-17\",\n \"Statement\": [\n {\n \"Effect\": \"Allow\",\n \"Action\": [\n \"ec2:DescribeInstances\",\n \"ec2:DescribeRegions\"\n ],\n \"Resource\": [\n \"*\"\n ]\n },\n {\n \"Effect\": \"Allow\",\n \"Action\": [\n \"s3:GetBucketLocation\",\n \"s3:ListBucket\"\n ],\n \"Resource\": [\n \"arn:aws:s3:::kops.peelmicro.com\"\n ]\n },\n {\n \"Effect\": \"Allow\",\n \"Action\": [\n \"s3:Get*\"\n ],\n \"Resource\": [\n \"arn:aws:s3:::kops.peelmicro.com/kops.peelmicro.com/addons/*\",\n \"arn:aws:s3:::kops.peelmicro.com/kops.peelmicro.com/cluster.spec\",\n \"arn:aws:s3:::kops.peelmicro.com/kops.peelmicro.com/config\",\n \"arn:aws:s3:::kops.peelmicro.com/kops.peelmicro.com/instancegroup/*\",\n \"arn:aws:s3:::kops.peelmicro.com/kops.peelmicro.com/pki/issued/*\",\n \"arn:aws:s3:::kops.peelmicro.com/kops.peelmicro.com/pki/private/kube-proxy/*\",\n \"arn:aws:s3:::kops.peelmicro.com/kops.peelmicro.com/pki/private/kubelet/*\",\n \"arn:aws:s3:::kops.peelmicro.com/kops.peelmicro.com/pki/ssh/*\",\n \"arn:aws:s3:::kops.peelmicro.com/kops.peelmicro.com/secrets/dockerconfig\"\n ]\n },\n {\n \"Effect\": \"Allow\",\n \"Action\": [\n \"ecr:GetAuthorizationToken\",\n \"ecr:BatchCheckLayerAvailability\",\n \"ecr:GetDownloadUrlForLayer\",\n \"ecr:GetRepositoryPolicy\",\n \"ecr:DescribeRepositories\",\n \"ecr:ListImages\",\n \"ecr:BatchGetImage\"\n ],\n \"Resource\": [\n \"*\"\n ]\n }\n ]\n}"
role: "nodes.kops.peelmicro.com"
+ aws_internet_gateway.kops-peelmicro-com
id: <computed>
owner_id: <computed>
tags.%: "3"
tags.KubernetesCluster: "kops.peelmicro.com"
tags.Name: "kops.peelmicro.com"
tags.kubernetes.io/cluster/kops.peelmicro.com: "owned"
vpc_id: "${aws_vpc.kops-peelmicro-com.id}"
+ aws_key_pair.kubernetes-kops-peelmicro-com-14f4e587b84d4819f287bedfda85ac26
id: <computed>
fingerprint: <computed>
key_name: "kubernetes.kops.peelmicro.com-14:f4:e5:87:b8:4d:48:19:f2:87:be:df:da:85:ac:26"
public_key: "ssh-rsa AAAAB3NzaC1yc2EAAAADAQABAAABAQDjBXziCHemhPndqIdzwKXyTw32UdZs+OVUWvCpwy1pRubg8oZpbFXQ92uGvWVFhbIh8wYv7bgmxi6Gaw8xbdBiDoOwx18PdEgmbcFw7O0tXKUMoke/tn3izeUbliNyD21OwSMwkNoaUJqkBJ2fHKjOrDxUGP/5M6iLfgzXTD/6oDG2USLoHIZBQtRBivb/k8IbW6dAveHhziuG87KtcW0lti0n4denWJV8R6fMEXLEaOTbtD17LOfQGWK8la1IwmNVhPuKMSBUOjfNk2sVv7dRO6EL+zK8WvAagnRl15yX3i097Lg6ql5Hvukk1aeJ5QCZa78hnYYDFL6d1DHbOgi1 root@ubuntu-s-1vcpu-2gb-lon1-01"
+ aws_launch_configuration.master-eu-central-1a-masters-kops-peelmicro-com
id: <computed>
associate_public_ip_address: "true"
ebs_block_device.#: <computed>
ebs_optimized: <computed>
enable_monitoring: "false"
iam_instance_profile: "${aws_iam_instance_profile.masters-kops-peelmicro-com.id}"
image_id: "ami-0692cb5ffed92e0c7"
instance_type: "t2.micro"
key_name: "${aws_key_pair.kubernetes-kops-peelmicro-com-14f4e587b84d4819f287bedfda85ac26.id}"
name: <computed>
name_prefix: "master-eu-central-1a.masters.kops.peelmicro.com-"
root_block_device.#: "1"
root_block_device.0.delete_on_termination: "true"
root_block_device.0.iops: <computed>
root_block_device.0.volume_size: "64"
root_block_device.0.volume_type: "gp2"
security_groups.#: <computed>
user_data: "c4de9593d17ce259846182486013d03d8782e455"
+ aws_launch_configuration.nodes-kops-peelmicro-com
id: <computed>
associate_public_ip_address: "true"
ebs_block_device.#: <computed>
ebs_optimized: <computed>
enable_monitoring: "false"
iam_instance_profile: "${aws_iam_instance_profile.nodes-kops-peelmicro-com.id}"
image_id: "ami-0692cb5ffed92e0c7"
instance_type: "t2.micro"
key_name: "${aws_key_pair.kubernetes-kops-peelmicro-com-14f4e587b84d4819f287bedfda85ac26.id}"
name: <computed>
name_prefix: "nodes.kops.peelmicro.com-"
root_block_device.#: "1"
root_block_device.0.delete_on_termination: "true"
root_block_device.0.iops: <computed>
root_block_device.0.volume_size: "128"
root_block_device.0.volume_type: "gp2"
security_groups.#: <computed>
user_data: "0211e7563e5b67305d61bb6211bceef691e20c32"
+ aws_route.0-0-0-0--0
id: <computed>
destination_cidr_block: "0.0.0.0/0"
destination_prefix_list_id: <computed>
egress_only_gateway_id: <computed>
gateway_id: "${aws_internet_gateway.kops-peelmicro-com.id}"
instance_id: <computed>
instance_owner_id: <computed>
nat_gateway_id: <computed>
network_interface_id: <computed>
origin: <computed>
route_table_id: "${aws_route_table.kops-peelmicro-com.id}"
state: <computed>
+ aws_route_table.kops-peelmicro-com
id: <computed>
owner_id: <computed>
propagating_vgws.#: <computed>
route.#: <computed>
tags.%: "4"
tags.KubernetesCluster: "kops.peelmicro.com"
tags.Name: "kops.peelmicro.com"
tags.kubernetes.io/cluster/kops.peelmicro.com: "owned"
tags.kubernetes.io/kops/role: "public"
vpc_id: "${aws_vpc.kops-peelmicro-com.id}"
+ aws_route_table_association.eu-central-1a-kops-peelmicro-com
id: <computed>
route_table_id: "${aws_route_table.kops-peelmicro-com.id}"
subnet_id: "${aws_subnet.eu-central-1a-kops-peelmicro-com.id}"
+ aws_security_group.masters-kops-peelmicro-com
id: <computed>
arn: <computed>
description: "Security group for masters"
egress.#: <computed>
ingress.#: <computed>
name: "masters.kops.peelmicro.com"
owner_id: <computed>
revoke_rules_on_delete: "false"
tags.%: "3"
tags.KubernetesCluster: "kops.peelmicro.com"
tags.Name: "masters.kops.peelmicro.com"
tags.kubernetes.io/cluster/kops.peelmicro.com: "owned"
vpc_id: "${aws_vpc.kops-peelmicro-com.id}"
+ aws_security_group.nodes-kops-peelmicro-com
id: <computed>
arn: <computed>
description: "Security group for nodes"
egress.#: <computed>
ingress.#: <computed>
name: "nodes.kops.peelmicro.com"
owner_id: <computed>
revoke_rules_on_delete: "false"
tags.%: "3"
tags.KubernetesCluster: "kops.peelmicro.com"
tags.Name: "nodes.kops.peelmicro.com"
tags.kubernetes.io/cluster/kops.peelmicro.com: "owned"
vpc_id: "${aws_vpc.kops-peelmicro-com.id}"
+ aws_security_group_rule.all-master-to-master
id: <computed>
from_port: "0"
protocol: "-1"
security_group_id: "${aws_security_group.masters-kops-peelmicro-com.id}"
self: "false"
source_security_group_id: "${aws_security_group.masters-kops-peelmicro-com.id}"
to_port: "0"
type: "ingress"
+ aws_security_group_rule.all-master-to-node
id: <computed>
from_port: "0"
protocol: "-1"
security_group_id: "${aws_security_group.nodes-kops-peelmicro-com.id}"
self: "false"
source_security_group_id: "${aws_security_group.masters-kops-peelmicro-com.id}"
to_port: "0"
type: "ingress"
+ aws_security_group_rule.all-node-to-node
id: <computed>
from_port: "0"
protocol: "-1"
security_group_id: "${aws_security_group.nodes-kops-peelmicro-com.id}"
self: "false"
source_security_group_id: "${aws_security_group.nodes-kops-peelmicro-com.id}"
to_port: "0"
type: "ingress"
+ aws_security_group_rule.https-external-to-master-0-0-0-0--0
id: <computed>
cidr_blocks.#: "1"
cidr_blocks.0: "0.0.0.0/0"
from_port: "443"
protocol: "tcp"
security_group_id: "${aws_security_group.masters-kops-peelmicro-com.id}"
self: "false"
source_security_group_id: <computed>
to_port: "443"
type: "ingress"
+ aws_security_group_rule.master-egress
id: <computed>
cidr_blocks.#: "1"
cidr_blocks.0: "0.0.0.0/0"
from_port: "0"
protocol: "-1"
security_group_id: "${aws_security_group.masters-kops-peelmicro-com.id}"
self: "false"
source_security_group_id: <computed>
to_port: "0"
type: "egress"
+ aws_security_group_rule.node-egress
id: <computed>
cidr_blocks.#: "1"
cidr_blocks.0: "0.0.0.0/0"
from_port: "0"
protocol: "-1"
security_group_id: "${aws_security_group.nodes-kops-peelmicro-com.id}"
self: "false"
source_security_group_id: <computed>
to_port: "0"
type: "egress"
+ aws_security_group_rule.node-to-master-tcp-1-2379
id: <computed>
from_port: "1"
protocol: "tcp"
security_group_id: "${aws_security_group.masters-kops-peelmicro-com.id}"
self: "false"
source_security_group_id: "${aws_security_group.nodes-kops-peelmicro-com.id}"
to_port: "2379"
type: "ingress"
+ aws_security_group_rule.node-to-master-tcp-2382-4000
id: <computed>
from_port: "2382"
protocol: "tcp"
security_group_id: "${aws_security_group.masters-kops-peelmicro-com.id}"
self: "false"
source_security_group_id: "${aws_security_group.nodes-kops-peelmicro-com.id}"
to_port: "4000"
type: "ingress"
+ aws_security_group_rule.node-to-master-tcp-4003-65535
id: <computed>
from_port: "4003"
protocol: "tcp"
security_group_id: "${aws_security_group.masters-kops-peelmicro-com.id}"
self: "false"
source_security_group_id: "${aws_security_group.nodes-kops-peelmicro-com.id}"
to_port: "65535"
type: "ingress"
+ aws_security_group_rule.node-to-master-udp-1-65535
id: <computed>
from_port: "1"
protocol: "udp"
security_group_id: "${aws_security_group.masters-kops-peelmicro-com.id}"
self: "false"
source_security_group_id: "${aws_security_group.nodes-kops-peelmicro-com.id}"
to_port: "65535"
type: "ingress"
+ aws_security_group_rule.ssh-external-to-master-0-0-0-0--0
id: <computed>
cidr_blocks.#: "1"
cidr_blocks.0: "0.0.0.0/0"
from_port: "22"
protocol: "tcp"
security_group_id: "${aws_security_group.masters-kops-peelmicro-com.id}"
self: "false"
source_security_group_id: <computed>
to_port: "22"
type: "ingress"
+ aws_security_group_rule.ssh-external-to-node-0-0-0-0--0
id: <computed>
cidr_blocks.#: "1"
cidr_blocks.0: "0.0.0.0/0"
from_port: "22"
protocol: "tcp"
security_group_id: "${aws_security_group.nodes-kops-peelmicro-com.id}"
self: "false"
source_security_group_id: <computed>
to_port: "22"
type: "ingress"
+ aws_subnet.eu-central-1a-kops-peelmicro-com
id: <computed>
arn: <computed>
assign_ipv6_address_on_creation: "false"
availability_zone: "eu-central-1a"
availability_zone_id: <computed>
cidr_block: "172.20.32.0/19"
ipv6_cidr_block: <computed>
ipv6_cidr_block_association_id: <computed>
map_public_ip_on_launch: "false"
owner_id: <computed>
tags.%: "5"
tags.KubernetesCluster: "kops.peelmicro.com"
tags.Name: "eu-central-1a.kops.peelmicro.com"
tags.SubnetType: "Public"
tags.kubernetes.io/cluster/kops.peelmicro.com: "owned"
tags.kubernetes.io/role/elb: "1"
vpc_id: "${aws_vpc.kops-peelmicro-com.id}"
+ aws_vpc.kops-peelmicro-com
id: <computed>
arn: <computed>
assign_generated_ipv6_cidr_block: "false"
cidr_block: "172.20.0.0/16"
default_network_acl_id: <computed>
default_route_table_id: <computed>
default_security_group_id: <computed>
dhcp_options_id: <computed>
enable_classiclink: <computed>
enable_classiclink_dns_support: <computed>
enable_dns_hostnames: "true"
enable_dns_support: "true"
instance_tenancy: "default"
ipv6_association_id: <computed>
ipv6_cidr_block: <computed>
main_route_table_id: <computed>
owner_id: <computed>
tags.%: "3"
tags.KubernetesCluster: "kops.peelmicro.com"
tags.Name: "kops.peelmicro.com"
tags.kubernetes.io/cluster/kops.peelmicro.com: "owned"
+ aws_vpc_dhcp_options.kops-peelmicro-com
id: <computed>
domain_name: "eu-central-1.compute.internal"
domain_name_servers.#: "1"
domain_name_servers.0: "AmazonProvidedDNS"
owner_id: <computed>
tags.%: "3"
tags.KubernetesCluster: "kops.peelmicro.com"
tags.Name: "kops.peelmicro.com"
tags.kubernetes.io/cluster/kops.peelmicro.com: "owned"
+ aws_vpc_dhcp_options_association.kops-peelmicro-com
id: <computed>
dhcp_options_id: "${aws_vpc_dhcp_options.kops-peelmicro-com.id}"
vpc_id: "${aws_vpc.kops-peelmicro-com.id}"
Plan: 35 to add, 0 to change, 0 to destroy.
Do you want to perform these actions?
Terraform will perform the actions described above.
Only 'yes' will be accepted to approve.
- Confirm entering
yes
aws_iam_role.masters-kops-peelmicro-com: Creating...
arn: "" => "<computed>"
assume_role_policy: "" => "{\n \"Version\": \"2012-10-17\",\n \"Statement\": [\n {\n \"Effect\": \"Allow\",\n \"Principal\": { \"Service\": \"ec2.amazonaws.com\"},\n \"Action\": \"sts:AssumeRole\"\n }\n ]\n}"
create_date: "" => "<computed>"
force_detach_policies: "" => "false"
max_session_duration: "" => "3600"
name: "" => "masters.kops.peelmicro.com"
path: "" => "/"
unique_id: "" => "<computed>"
aws_vpc.kops-peelmicro-com: Creating...
arn: "" => "<computed>"
assign_generated_ipv6_cidr_block: "" => "false"
cidr_block: "" => "172.20.0.0/16"
default_network_acl_id: "" => "<computed>"
default_route_table_id: "" => "<computed>"
default_security_group_id: "" => "<computed>"
dhcp_options_id: "" => "<computed>"
enable_classiclink: "" => "<computed>"
enable_classiclink_dns_support: "" => "<computed>"
enable_dns_hostnames: "" => "true"
enable_dns_support: "" => "true"
instance_tenancy: "" => "default"
ipv6_association_id: "" => "<computed>"
ipv6_cidr_block: "" => "<computed>"
main_route_table_id: "" => "<computed>"
owner_id: "" => "<computed>"
tags.%: "" => "3"
tags.KubernetesCluster: "" => "kops.peelmicro.com"
tags.Name: "" => "kops.peelmicro.com"
tags.kubernetes.io/cluster/kops.peelmicro.com: "" => "owned"
aws_iam_role.nodes-kops-peelmicro-com: Creating...
arn: "" => "<computed>"
assume_role_policy: "" => "{\n \"Version\": \"2012-10-17\",\n \"Statement\": [\n {\n \"Effect\": \"Allow\",\n \"Principal\": { \"Service\": \"ec2.amazonaws.com\"},\n \"Action\": \"sts:AssumeRole\"\n }\n ]\n}"
create_date: "" => "<computed>"
force_detach_policies: "" => "false"
max_session_duration: "" => "3600"
name: "" => "nodes.kops.peelmicro.com"
path: "" => "/"
unique_id: "" => "<computed>"
aws_ebs_volume.a-etcd-events-kops-peelmicro-com: Creating...
arn: "" => "<computed>"
availability_zone: "" => "eu-central-1a"
encrypted: "" => "false"
iops: "" => "<computed>"
kms_key_id: "" => "<computed>"
size: "" => "20"
snapshot_id: "" => "<computed>"
tags.%: "" => "5"
tags.KubernetesCluster: "" => "kops.peelmicro.com"
tags.Name: "" => "a.etcd-events.kops.peelmicro.com"
tags.k8s.io/etcd/events: "" => "a/a"
tags.k8s.io/role/master: "" => "1"
tags.kubernetes.io/cluster/kops.peelmicro.com: "" => "owned"
type: "" => "gp2"
aws_ebs_volume.a-etcd-main-kops-peelmicro-com: Creating...
arn: "" => "<computed>"
availability_zone: "" => "eu-central-1a"
encrypted: "" => "false"
iops: "" => "<computed>"
kms_key_id: "" => "<computed>"
size: "" => "20"
snapshot_id: "" => "<computed>"
tags.%: "" => "5"
tags.KubernetesCluster: "" => "kops.peelmicro.com"
tags.Name: "" => "a.etcd-main.kops.peelmicro.com"
tags.k8s.io/etcd/main: "" => "a/a"
tags.k8s.io/role/master: "" => "1"
tags.kubernetes.io/cluster/kops.peelmicro.com: "" => "owned"
type: "" => "gp2"
aws_key_pair.kubernetes-kops-peelmicro-com-14f4e587b84d4819f287bedfda85ac26: Creating...
fingerprint: "" => "<computed>"
key_name: "" => "kubernetes.kops.peelmicro.com-14:f4:e5:87:b8:4d:48:19:f2:87:be:df:da:85:ac:26"
public_key: "" => "ssh-rsa AAAAB3NzaC1yc2EAAAADAQABAAABAQDjBXziCHemhPndqIdzwKXyTw32UdZs+OVUWvCpwy1pRubg8oZpbFXQ92uGvWVFhbIh8wYv7bgmxi6Gaw8xbdBiDoOwx18PdEgmbcFw7O0tXKUMoke/tn3izeUbliNyD21OwSMwkNoaUJqkBJ2fHKjOrDxUGP/5M6iLfgzXTD/6oDG2USLoHIZBQtRBivb/k8IbW6dAveHhziuG87KtcW0lti0n4denWJV8R6fMEXLEaOTbtD17LOfQGWK8la1IwmNVhPuKMSBUOjfNk2sVv7dRO6EL+zK8WvAagnRl15yX3i097Lg6ql5Hvukk1aeJ5QCZa78hnYYDFL6d1DHbOgi1 root@ubuntu-s-1vcpu-2gb-lon1-01"
aws_vpc_dhcp_options.kops-peelmicro-com: Creating...
domain_name: "" => "eu-central-1.compute.internal"
domain_name_servers.#: "" => "1"
domain_name_servers.0: "" => "AmazonProvidedDNS"
owner_id: "" => "<computed>"
tags.%: "" => "3"
tags.KubernetesCluster: "" => "kops.peelmicro.com"
tags.Name: "" => "kops.peelmicro.com"
tags.kubernetes.io/cluster/kops.peelmicro.com: "" => "owned"
aws_key_pair.kubernetes-kops-peelmicro-com-14f4e587b84d4819f287bedfda85ac26: Creation complete after 1s (ID: kubernetes.kops.peelmicro.com-14:f4:e5:87:b8:4d:48:19:f2:87:be:df:da:85:ac:26)
aws_vpc_dhcp_options.kops-peelmicro-com: Creation complete after 1s (ID: dopt-0c9dd22620832ee93)
aws_iam_role.masters-kops-peelmicro-com: Creation complete after 1s (ID: masters.kops.peelmicro.com)
aws_iam_role_policy.masters-kops-peelmicro-com: Creating...
name: "" => "masters.kops.peelmicro.com"
policy: "" => "{\n \"Version\": \"2012-10-17\",\n \"Statement\": [\n {\n \"Effect\": \"Allow\",\n \"Action\": [\n \"ec2:DescribeInstances\",\n \"ec2:DescribeRegions\",\n \"ec2:DescribeRouteTables\",\n \"ec2:DescribeSecurityGroups\",\n \"ec2:DescribeSubnets\",\n \"ec2:DescribeVolumes\"\n ],\n \"Resource\": [\n \"*\"\n ]\n },\n {\n \"Effect\": \"Allow\",\n \"Action\": [\n \"ec2:CreateSecurityGroup\",\n \"ec2:CreateTags\",\n \"ec2:CreateVolume\",\n \"ec2:DescribeVolumesModifications\",\n \"ec2:ModifyInstanceAttribute\",\n \"ec2:ModifyVolume\"\n ],\n \"Resource\": [\n \"*\"\n ]\n },\n {\n \"Effect\": \"Allow\",\n \"Action\": [\n \"ec2:AttachVolume\",\n \"ec2:AuthorizeSecurityGroupIngress\",\n \"ec2:CreateRoute\",\n \"ec2:DeleteRoute\",\n \"ec2:DeleteSecurityGroup\",\n \"ec2:DeleteVolume\",\n \"ec2:DetachVolume\",\n \"ec2:RevokeSecurityGroupIngress\"\n ],\n \"Resource\": [\n \"*\"\n ],\n \"Condition\": {\n \"StringEquals\": {\n \"ec2:ResourceTag/KubernetesCluster\": \"kops.peelmicro.com\"\n }\n }\n },\n {\n \"Effect\": \"Allow\",\n \"Action\": [\n \"autoscaling:DescribeAutoScalingGroups\",\n \"autoscaling:DescribeLaunchConfigurations\",\n \"autoscaling:DescribeTags\"\n ],\n \"Resource\": [\n \"*\"\n ]\n },\n {\n \"Effect\": \"Allow\",\n \"Action\": [\n \"autoscaling:SetDesiredCapacity\",\n \"autoscaling:TerminateInstanceInAutoScalingGroup\",\n \"autoscaling:UpdateAutoScalingGroup\"\n ],\n \"Resource\": [\n \"*\"\n ],\n \"Condition\": {\n \"StringEquals\": {\n \"autoscaling:ResourceTag/KubernetesCluster\": \"kops.peelmicro.com\"\n }\n }\n },\n {\n \"Effect\": \"Allow\",\n \"Action\": [\n \"elasticloadbalancing:AddTags\",\n \"elasticloadbalancing:AttachLoadBalancerToSubnets\",\n \"elasticloadbalancing:ApplySecurityGroupsToLoadBalancer\",\n \"elasticloadbalancing:CreateLoadBalancer\",\n \"elasticloadbalancing:CreateLoadBalancerPolicy\",\n \"elasticloadbalancing:CreateLoadBalancerListeners\",\n \"elasticloadbalancing:ConfigureHealthCheck\",\n \"elasticloadbalancing:DeleteLoadBalancer\",\n \"elasticloadbalancing:DeleteLoadBalancerListeners\",\n \"elasticloadbalancing:DescribeLoadBalancers\",\n \"elasticloadbalancing:DescribeLoadBalancerAttributes\",\n \"elasticloadbalancing:DetachLoadBalancerFromSubnets\",\n \"elasticloadbalancing:DeregisterInstancesFromLoadBalancer\",\n \"elasticloadbalancing:ModifyLoadBalancerAttributes\",\n \"elasticloadbalancing:RegisterInstancesWithLoadBalancer\",\n \"elasticloadbalancing:SetLoadBalancerPoliciesForBackendServer\"\n ],\n \"Resource\": [\n \"*\"\n ]\n },\n {\n \"Effect\": \"Allow\",\n \"Action\": [\n \"ec2:DescribeVpcs\",\n \"elasticloadbalancing:AddTags\",\n \"elasticloadbalancing:CreateListener\",\n \"elasticloadbalancing:CreateTargetGroup\",\n \"elasticloadbalancing:DeleteListener\",\n \"elasticloadbalancing:DeleteTargetGroup\",\n \"elasticloadbalancing:DescribeListeners\",\n \"elasticloadbalancing:DescribeLoadBalancerPolicies\",\n \"elasticloadbalancing:DescribeTargetGroups\",\n \"elasticloadbalancing:DescribeTargetHealth\",\n \"elasticloadbalancing:ModifyListener\",\n \"elasticloadbalancing:ModifyTargetGroup\",\n \"elasticloadbalancing:RegisterTargets\",\n \"elasticloadbalancing:SetLoadBalancerPoliciesOfListener\"\n ],\n \"Resource\": [\n \"*\"\n ]\n },\n {\n \"Effect\": \"Allow\",\n \"Action\": [\n \"iam:ListServerCertificates\",\n \"iam:GetServerCertificate\"\n ],\n \"Resource\": [\n \"*\"\n ]\n },\n {\n \"Effect\": \"Allow\",\n \"Action\": [\n \"s3:GetBucketLocation\",\n \"s3:ListBucket\"\n ],\n \"Resource\": [\n \"arn:aws:s3:::kops.peelmicro.com\"\n ]\n },\n {\n \"Effect\": \"Allow\",\n \"Action\": [\n \"s3:Get*\"\n ],\n \"Resource\": \"arn:aws:s3:::kops.peelmicro.com/kops.peelmicro.com/*\"\n },\n {\n \"Effect\": \"Allow\",\n \"Action\": [\n \"route53:ChangeResourceRecordSets\",\n \"route53:ListResourceRecordSets\",\n \"route53:GetHostedZone\"\n ],\n \"Resource\": [\n \"arn:aws:route53:::hostedzone/ZQF46NG2DUXIJ\"\n ]\n },\n {\n \"Effect\": \"Allow\",\n \"Action\": [\n \"route53:GetChange\"\n ],\n \"Resource\": [\n \"arn:aws:route53:::change/*\"\n ]\n },\n {\n \"Effect\": \"Allow\",\n \"Action\": [\n \"route53:ListHostedZones\"\n ],\n \"Resource\": [\n \"*\"\n ]\n },\n {\n \"Effect\": \"Allow\",\n \"Action\": [\n \"ecr:GetAuthorizationToken\",\n \"ecr:BatchCheckLayerAvailability\",\n \"ecr:GetDownloadUrlForLayer\",\n \"ecr:GetRepositoryPolicy\",\n \"ecr:DescribeRepositories\",\n \"ecr:ListImages\",\n \"ecr:BatchGetImage\"\n ],\n \"Resource\": [\n \"*\"\n ]\n }\n ]\n}"
role: "" => "masters.kops.peelmicro.com"
aws_iam_instance_profile.masters-kops-peelmicro-com: Creating...
arn: "" => "<computed>"
create_date: "" => "<computed>"
name: "" => "masters.kops.peelmicro.com"
path: "" => "/"
role: "" => "masters.kops.peelmicro.com"
roles.#: "" => "<computed>"
unique_id: "" => "<computed>"
aws_iam_role.nodes-kops-peelmicro-com: Creation complete after 1s (ID: nodes.kops.peelmicro.com)
aws_iam_role_policy.nodes-kops-peelmicro-com: Creating...
name: "" => "nodes.kops.peelmicro.com"
policy: "" => "{\n \"Version\": \"2012-10-17\",\n \"Statement\": [\n {\n \"Effect\": \"Allow\",\n \"Action\": [\n \"ec2:DescribeInstances\",\n \"ec2:DescribeRegions\"\n ],\n \"Resource\": [\n \"*\"\n ]\n },\n {\n \"Effect\": \"Allow\",\n \"Action\": [\n \"s3:GetBucketLocation\",\n \"s3:ListBucket\"\n ],\n \"Resource\": [\n \"arn:aws:s3:::kops.peelmicro.com\"\n ]\n },\n {\n \"Effect\": \"Allow\",\n \"Action\": [\n \"s3:Get*\"\n ],\n \"Resource\": [\n \"arn:aws:s3:::kops.peelmicro.com/kops.peelmicro.com/addons/*\",\n \"arn:aws:s3:::kops.peelmicro.com/kops.peelmicro.com/cluster.spec\",\n \"arn:aws:s3:::kops.peelmicro.com/kops.peelmicro.com/config\",\n \"arn:aws:s3:::kops.peelmicro.com/kops.peelmicro.com/instancegroup/*\",\n \"arn:aws:s3:::kops.peelmicro.com/kops.peelmicro.com/pki/issued/*\",\n \"arn:aws:s3:::kops.peelmicro.com/kops.peelmicro.com/pki/private/kube-proxy/*\",\n \"arn:aws:s3:::kops.peelmicro.com/kops.peelmicro.com/pki/private/kubelet/*\",\n \"arn:aws:s3:::kops.peelmicro.com/kops.peelmicro.com/pki/ssh/*\",\n \"arn:aws:s3:::kops.peelmicro.com/kops.peelmicro.com/secrets/dockerconfig\"\n ]\n },\n {\n \"Effect\": \"Allow\",\n \"Action\": [\n \"ecr:GetAuthorizationToken\",\n \"ecr:BatchCheckLayerAvailability\",\n \"ecr:GetDownloadUrlForLayer\",\n \"ecr:GetRepositoryPolicy\",\n \"ecr:DescribeRepositories\",\n \"ecr:ListImages\",\n \"ecr:BatchGetImage\"\n ],\n \"Resource\": [\n \"*\"\n ]\n }\n ]\n}"
role: "" => "nodes.kops.peelmicro.com"
aws_iam_instance_profile.nodes-kops-peelmicro-com: Creating...
arn: "" => "<computed>"
create_date: "" => "<computed>"
name: "" => "nodes.kops.peelmicro.com"
path: "" => "/"
role: "" => "nodes.kops.peelmicro.com"
roles.#: "" => "<computed>"
unique_id: "" => "<computed>"
aws_iam_role_policy.masters-kops-peelmicro-com: Creation complete after 1s (ID: masters.kops.peelmicro.com:masters.kops.peelmicro.com)
aws_iam_role_policy.nodes-kops-peelmicro-com: Creation complete after 1s (ID: nodes.kops.peelmicro.com:nodes.kops.peelmicro.com)
aws_vpc.kops-peelmicro-com: Creation complete after 2s (ID: vpc-028e164a261a97de4)
aws_iam_instance_profile.masters-kops-peelmicro-com: Creation complete after 1s (ID: masters.kops.peelmicro.com)
aws_security_group.nodes-kops-peelmicro-com: Creating...
arn: "" => "<computed>"
description: "" => "Security group for nodes"
egress.#: "" => "<computed>"
ingress.#: "" => "<computed>"
name: "" => "nodes.kops.peelmicro.com"
owner_id: "" => "<computed>"
revoke_rules_on_delete: "" => "false"
tags.%: "" => "3"
tags.KubernetesCluster: "" => "kops.peelmicro.com"
tags.Name: "" => "nodes.kops.peelmicro.com"
tags.kubernetes.io/cluster/kops.peelmicro.com: "" => "owned"
vpc_id: "" => "vpc-028e164a261a97de4"
aws_security_group.masters-kops-peelmicro-com: Creating...
arn: "" => "<computed>"
description: "" => "Security group for masters"
egress.#: "" => "<computed>"
ingress.#: "" => "<computed>"
name: "" => "masters.kops.peelmicro.com"
owner_id: "" => "<computed>"
revoke_rules_on_delete: "" => "false"
tags.%: "" => "3"
tags.KubernetesCluster: "" => "kops.peelmicro.com"
tags.Name: "" => "masters.kops.peelmicro.com"
tags.kubernetes.io/cluster/kops.peelmicro.com: "" => "owned"
vpc_id: "" => "vpc-028e164a261a97de4"
aws_internet_gateway.kops-peelmicro-com: Creating...
owner_id: "" => "<computed>"
tags.%: "0" => "3"
tags.KubernetesCluster: "" => "kops.peelmicro.com"
tags.Name: "" => "kops.peelmicro.com"
tags.kubernetes.io/cluster/kops.peelmicro.com: "" => "owned"
vpc_id: "" => "vpc-028e164a261a97de4"
aws_subnet.eu-central-1a-kops-peelmicro-com: Creating...
arn: "" => "<computed>"
assign_ipv6_address_on_creation: "" => "false"
availability_zone: "" => "eu-central-1a"
availability_zone_id: "" => "<computed>"
cidr_block: "" => "172.20.32.0/19"
ipv6_cidr_block: "" => "<computed>"
ipv6_cidr_block_association_id: "" => "<computed>"
map_public_ip_on_launch: "" => "false"
owner_id: "" => "<computed>"
tags.%: "" => "5"
tags.KubernetesCluster: "" => "kops.peelmicro.com"
tags.Name: "" => "eu-central-1a.kops.peelmicro.com"
tags.SubnetType: "" => "Public"
tags.kubernetes.io/cluster/kops.peelmicro.com: "" => "owned"
tags.kubernetes.io/role/elb: "" => "1"
vpc_id: "" => "vpc-028e164a261a97de4"
aws_vpc_dhcp_options_association.kops-peelmicro-com: Creating...
dhcp_options_id: "" => "dopt-0c9dd22620832ee93"
vpc_id: "" => "vpc-028e164a261a97de4"
aws_route_table.kops-peelmicro-com: Creating...
owner_id: "" => "<computed>"
propagating_vgws.#: "" => "<computed>"
route.#: "" => "<computed>"
tags.%: "" => "4"
tags.KubernetesCluster: "" => "kops.peelmicro.com"
tags.Name: "" => "kops.peelmicro.com"
tags.kubernetes.io/cluster/kops.peelmicro.com: "" => "owned"
tags.kubernetes.io/kops/role: "" => "public"
vpc_id: "" => "vpc-028e164a261a97de4"
aws_iam_instance_profile.nodes-kops-peelmicro-com: Creation complete after 2s (ID: nodes.kops.peelmicro.com)
aws_vpc_dhcp_options_association.kops-peelmicro-com: Creation complete after 1s (ID: dopt-0c9dd22620832ee93-vpc-028e164a261a97de4)
aws_route_table.kops-peelmicro-com: Creation complete after 1s (ID: rtb-0f63cc01eb0211053)
aws_subnet.eu-central-1a-kops-peelmicro-com: Creation complete after 1s (ID: subnet-0ed756e2828d8836f)
aws_route_table_association.eu-central-1a-kops-peelmicro-com: Creating...
route_table_id: "" => "rtb-0f63cc01eb0211053"
subnet_id: "" => "subnet-0ed756e2828d8836f"
aws_route_table_association.eu-central-1a-kops-peelmicro-com: Creation complete after 0s (ID: rtbassoc-0627a7b379eae9700)
aws_internet_gateway.kops-peelmicro-com: Creation complete after 2s (ID: igw-0c03bc064e9408647)
aws_route.0-0-0-0--0: Creating...
destination_cidr_block: "" => "0.0.0.0/0"
destination_prefix_list_id: "" => "<computed>"
egress_only_gateway_id: "" => "<computed>"
gateway_id: "" => "igw-0c03bc064e9408647"
instance_id: "" => "<computed>"
instance_owner_id: "" => "<computed>"
nat_gateway_id: "" => "<computed>"
network_interface_id: "" => "<computed>"
origin: "" => "<computed>"
route_table_id: "" => "rtb-0f63cc01eb0211053"
state: "" => "<computed>"
aws_security_group.masters-kops-peelmicro-com: Creation complete after 2s (ID: sg-0f0a41bf4931e4e6e)
aws_security_group.nodes-kops-peelmicro-com: Creation complete after 2s (ID: sg-0743e87a965010755)
aws_security_group_rule.ssh-external-to-master-0-0-0-0--0: Creating...
cidr_blocks.#: "" => "1"
cidr_blocks.0: "" => "0.0.0.0/0"
from_port: "" => "22"
protocol: "" => "tcp"
security_group_id: "" => "sg-0f0a41bf4931e4e6e"
self: "" => "false"
source_security_group_id: "" => "<computed>"
to_port: "" => "22"
type: "" => "ingress"
aws_security_group_rule.node-to-master-tcp-1-2379: Creating...
from_port: "" => "1"
protocol: "" => "tcp"
security_group_id: "" => "sg-0f0a41bf4931e4e6e"
self: "" => "false"
source_security_group_id: "" => "sg-0743e87a965010755"
to_port: "" => "2379"
type: "" => "ingress"
aws_launch_configuration.master-eu-central-1a-masters-kops-peelmicro-com: Creating...
associate_public_ip_address: "" => "true"
ebs_block_device.#: "" => "<computed>"
ebs_optimized: "" => "<computed>"
enable_monitoring: "" => "false"
iam_instance_profile: "" => "masters.kops.peelmicro.com"
image_id: "" => "ami-0692cb5ffed92e0c7"
instance_type: "" => "t2.micro"
key_name: "" => "kubernetes.kops.peelmicro.com-14:f4:e5:87:b8:4d:48:19:f2:87:be:df:da:85:ac:26"
name: "" => "<computed>"
name_prefix: "" => "master-eu-central-1a.masters.kops.peelmicro.com-"
root_block_device.#: "" => "1"
root_block_device.0.delete_on_termination: "" => "true"
root_block_device.0.iops: "" => "<computed>"
root_block_device.0.volume_size: "" => "64"
root_block_device.0.volume_type: "" => "gp2"
security_groups.#: "" => "1"
security_groups.2567628104: "" => "sg-0f0a41bf4931e4e6e"
user_data: "" => "c4de9593d17ce259846182486013d03d8782e455"
aws_security_group_rule.master-egress: Creating...
cidr_blocks.#: "" => "1"
cidr_blocks.0: "" => "0.0.0.0/0"
from_port: "" => "0"
protocol: "" => "-1"
security_group_id: "" => "sg-0f0a41bf4931e4e6e"
self: "" => "false"
source_security_group_id: "" => "<computed>"
to_port: "" => "0"
type: "" => "egress"
aws_security_group_rule.all-master-to-master: Creating...
from_port: "" => "0"
protocol: "" => "-1"
security_group_id: "" => "sg-0f0a41bf4931e4e6e"
self: "" => "false"
source_security_group_id: "" => "sg-0f0a41bf4931e4e6e"
to_port: "" => "0"
type: "" => "ingress"
aws_security_group_rule.https-external-to-master-0-0-0-0--0: Creating...
cidr_blocks.#: "" => "1"
cidr_blocks.0: "" => "0.0.0.0/0"
from_port: "" => "443"
protocol: "" => "tcp"
security_group_id: "" => "sg-0f0a41bf4931e4e6e"
self: "" => "false"
source_security_group_id: "" => "<computed>"
to_port: "" => "443"
type: "" => "ingress"
aws_security_group_rule.node-to-master-udp-1-65535: Creating...
from_port: "" => "1"
protocol: "" => "udp"
security_group_id: "" => "sg-0f0a41bf4931e4e6e"
self: "" => "false"
source_security_group_id: "" => "sg-0743e87a965010755"
to_port: "" => "65535"
type: "" => "ingress"
aws_route.0-0-0-0--0: Creation complete after 0s (ID: r-rtb-0f63cc01eb02110531080289494)
aws_security_group_rule.node-to-master-tcp-2382-4000: Creating...
from_port: "" => "2382"
protocol: "" => "tcp"
security_group_id: "" => "sg-0f0a41bf4931e4e6e"
self: "" => "false"
source_security_group_id: "" => "sg-0743e87a965010755"
to_port: "" => "4000"
type: "" => "ingress"
aws_security_group_rule.ssh-external-to-master-0-0-0-0--0: Creation complete after 0s (ID: sgrule-3478511132)
aws_security_group_rule.all-master-to-node: Creating...
from_port: "" => "0"
protocol: "" => "-1"
security_group_id: "" => "sg-0743e87a965010755"
self: "" => "false"
source_security_group_id: "" => "sg-0f0a41bf4931e4e6e"
to_port: "" => "0"
type: "" => "ingress"
aws_security_group_rule.node-to-master-tcp-1-2379: Creation complete after 1s (ID: sgrule-3762306149)
aws_security_group_rule.node-egress: Creating...
cidr_blocks.#: "" => "1"
cidr_blocks.0: "" => "0.0.0.0/0"
from_port: "" => "0"
protocol: "" => "-1"
security_group_id: "" => "sg-0743e87a965010755"
self: "" => "false"
source_security_group_id: "" => "<computed>"
to_port: "" => "0"
type: "" => "egress"
aws_security_group_rule.all-master-to-node: Creation complete after 1s (ID: sgrule-996961237)
aws_security_group_rule.node-to-master-tcp-4003-65535: Creating...
from_port: "" => "4003"
protocol: "" => "tcp"
security_group_id: "" => "sg-0f0a41bf4931e4e6e"
self: "" => "false"
source_security_group_id: "" => "sg-0743e87a965010755"
to_port: "" => "65535"
type: "" => "ingress"
aws_security_group_rule.node-egress: Creation complete after 0s (ID: sgrule-1101280839)
aws_launch_configuration.nodes-kops-peelmicro-com: Creating...
associate_public_ip_address: "" => "true"
ebs_block_device.#: "" => "<computed>"
ebs_optimized: "" => "<computed>"
enable_monitoring: "" => "false"
iam_instance_profile: "" => "nodes.kops.peelmicro.com"
image_id: "" => "ami-0692cb5ffed92e0c7"
instance_type: "" => "t2.micro"
key_name: "" => "kubernetes.kops.peelmicro.com-14:f4:e5:87:b8:4d:48:19:f2:87:be:df:da:85:ac:26"
name: "" => "<computed>"
name_prefix: "" => "nodes.kops.peelmicro.com-"
root_block_device.#: "" => "1"
root_block_device.0.delete_on_termination: "" => "true"
root_block_device.0.iops: "" => "<computed>"
root_block_device.0.volume_size: "" => "128"
root_block_device.0.volume_type: "" => "gp2"
security_groups.#: "" => "1"
security_groups.4241390917: "" => "sg-0743e87a965010755"
user_data: "" => "0211e7563e5b67305d61bb6211bceef691e20c32"
aws_security_group_rule.master-egress: Creation complete after 1s (ID: sgrule-3269006722)
aws_security_group_rule.all-node-to-node: Creating...
from_port: "" => "0"
protocol: "" => "-1"
security_group_id: "" => "sg-0743e87a965010755"
self: "" => "false"
source_security_group_id: "" => "sg-0743e87a965010755"
to_port: "" => "0"
type: "" => "ingress"
aws_security_group_rule.all-master-to-master: Creation complete after 2s (ID: sgrule-1821362308)
aws_security_group_rule.ssh-external-to-node-0-0-0-0--0: Creating...
cidr_blocks.#: "" => "1"
cidr_blocks.0: "" => "0.0.0.0/0"
from_port: "" => "22"
protocol: "" => "tcp"
security_group_id: "" => "sg-0743e87a965010755"
self: "" => "false"
source_security_group_id: "" => "<computed>"
to_port: "" => "22"
type: "" => "ingress"
aws_security_group_rule.all-node-to-node: Creation complete after 1s (ID: sgrule-1880517418)
aws_security_group_rule.https-external-to-master-0-0-0-0--0: Creation complete after 2s (ID: sgrule-2908212759)
aws_security_group_rule.ssh-external-to-node-0-0-0-0--0: Creation complete after 0s (ID: sgrule-1119641619)
aws_security_group_rule.node-to-master-udp-1-65535: Creation complete after 2s (ID: sgrule-2220229052)
aws_security_group_rule.node-to-master-tcp-2382-4000: Creation complete after 3s (ID: sgrule-3742610849)
aws_security_group_rule.node-to-master-tcp-4003-65535: Creation complete after 2s (ID: sgrule-2231910828)
aws_ebs_volume.a-etcd-events-kops-peelmicro-com: Still creating... (10s elapsed)
aws_ebs_volume.a-etcd-main-kops-peelmicro-com: Still creating... (10s elapsed)
aws_ebs_volume.a-etcd-events-kops-peelmicro-com: Creation complete after 11s (ID: vol-07539d3f1d01b0044)
aws_ebs_volume.a-etcd-main-kops-peelmicro-com: Creation complete after 11s (ID: vol-0301c997672ded596)
aws_launch_configuration.master-eu-central-1a-masters-kops-peelmicro-com: Creation complete after 8s (ID: master-eu-central-1a.masters.kops.peelmicro.com-20190309060741015700000001)
aws_autoscaling_group.master-eu-central-1a-masters-kops-peelmicro-com: Creating...
arn: "" => "<computed>"
default_cooldown: "" => "<computed>"
desired_capacity: "" => "<computed>"
enabled_metrics.#: "" => "8"
enabled_metrics.119681000: "" => "GroupStandbyInstances"
enabled_metrics.1940933563: "" => "GroupTotalInstances"
enabled_metrics.308948767: "" => "GroupPendingInstances"
enabled_metrics.3267518000: "" => "GroupTerminatingInstances"
enabled_metrics.3394537085: "" => "GroupDesiredCapacity"
enabled_metrics.3551801763: "" => "GroupInServiceInstances"
enabled_metrics.4118539418: "" => "GroupMinSize"
enabled_metrics.4136111317: "" => "GroupMaxSize"
force_delete: "" => "false"
health_check_grace_period: "" => "300"
health_check_type: "" => "<computed>"
launch_configuration: "" => "master-eu-central-1a.masters.kops.peelmicro.com-20190309060741015700000001"
load_balancers.#: "" => "<computed>"
max_size: "" => "1"
metrics_granularity: "" => "1Minute"
min_size: "" => "1"
name: "" => "master-eu-central-1a.masters.kops.peelmicro.com"
protect_from_scale_in: "" => "false"
service_linked_role_arn: "" => "<computed>"
tag.#: "" => "4"
tag.1601041186.key: "" => "k8s.io/role/master"
tag.1601041186.propagate_at_launch: "" => "true"
tag.1601041186.value: "" => "1"
tag.296694174.key: "" => "k8s.io/cluster-autoscaler/node-template/label/kops.k8s.io/instancegroup"
tag.296694174.propagate_at_launch: "" => "true"
tag.296694174.value: "" => "master-eu-central-1a"
tag.3218595536.key: "" => "Name"
tag.3218595536.propagate_at_launch: "" => "true"
tag.3218595536.value: "" => "master-eu-central-1a.masters.kops.peelmicro.com"
tag.681420748.key: "" => "KubernetesCluster"
tag.681420748.propagate_at_launch: "" => "true"
tag.681420748.value: "" => "kops.peelmicro.com"
target_group_arns.#: "" => "<computed>"
vpc_zone_identifier.#: "" => "1"
vpc_zone_identifier.64752231: "" => "subnet-0ed756e2828d8836f"
wait_for_capacity_timeout: "" => "10m"
aws_launch_configuration.nodes-kops-peelmicro-com: Creation complete after 9s (ID: nodes.kops.peelmicro.com-20190309060742391800000002)
aws_autoscaling_group.nodes-kops-peelmicro-com: Creating...
arn: "" => "<computed>"
default_cooldown: "" => "<computed>"
desired_capacity: "" => "<computed>"
enabled_metrics.#: "" => "8"
enabled_metrics.119681000: "" => "GroupStandbyInstances"
enabled_metrics.1940933563: "" => "GroupTotalInstances"
enabled_metrics.308948767: "" => "GroupPendingInstances"
enabled_metrics.3267518000: "" => "GroupTerminatingInstances"
enabled_metrics.3394537085: "" => "GroupDesiredCapacity"
enabled_metrics.3551801763: "" => "GroupInServiceInstances"
enabled_metrics.4118539418: "" => "GroupMinSize"
enabled_metrics.4136111317: "" => "GroupMaxSize"
force_delete: "" => "false"
health_check_grace_period: "" => "300"
health_check_type: "" => "<computed>"
launch_configuration: "" => "nodes.kops.peelmicro.com-20190309060742391800000002"
load_balancers.#: "" => "<computed>"
max_size: "" => "2"
metrics_granularity: "" => "1Minute"
min_size: "" => "2"
name: "" => "nodes.kops.peelmicro.com"
protect_from_scale_in: "" => "false"
service_linked_role_arn: "" => "<computed>"
tag.#: "" => "4"
tag.1967977115.key: "" => "k8s.io/role/node"
tag.1967977115.propagate_at_launch: "" => "true"
tag.1967977115.value: "" => "1"
tag.3438852489.key: "" => "Name"
tag.3438852489.propagate_at_launch: "" => "true"
tag.3438852489.value: "" => "nodes.kops.peelmicro.com"
tag.681420748.key: "" => "KubernetesCluster"
tag.681420748.propagate_at_launch: "" => "true"
tag.681420748.value: "" => "kops.peelmicro.com"
tag.859419842.key: "" => "k8s.io/cluster-autoscaler/node-template/label/kops.k8s.io/instancegroup"
tag.859419842.propagate_at_launch: "" => "true"
tag.859419842.value: "" => "nodes"
target_group_arns.#: "" => "<computed>"
vpc_zone_identifier.#: "" => "1"
vpc_zone_identifier.64752231: "" => "subnet-0ed756e2828d8836f"
wait_for_capacity_timeout: "" => "10m"
aws_autoscaling_group.master-eu-central-1a-masters-kops-peelmicro-com: Still creating... (10s elapsed)
aws_autoscaling_group.nodes-kops-peelmicro-com: Still creating... (10s elapsed)
aws_autoscaling_group.master-eu-central-1a-masters-kops-peelmicro-com: Still creating... (20s elapsed)
aws_autoscaling_group.nodes-kops-peelmicro-com: Still creating... (20s elapsed)
aws_autoscaling_group.master-eu-central-1a-masters-kops-peelmicro-com: Still creating... (30s elapsed)
aws_autoscaling_group.nodes-kops-peelmicro-com: Still creating... (30s elapsed)
aws_autoscaling_group.master-eu-central-1a-masters-kops-peelmicro-com: Still creating... (40s elapsed)
aws_autoscaling_group.nodes-kops-peelmicro-com: Still creating... (40s elapsed)
aws_autoscaling_group.nodes-kops-peelmicro-com: Creation complete after 47s (ID: nodes.kops.peelmicro.com)
aws_autoscaling_group.master-eu-central-1a-masters-kops-peelmicro-com: Still creating... (50s elapsed)
aws_autoscaling_group.master-eu-central-1a-masters-kops-peelmicro-com: Still creating... (1m0s elapsed)
aws_autoscaling_group.master-eu-central-1a-masters-kops-peelmicro-com: Still creating... (1m10s elapsed)
aws_autoscaling_group.master-eu-central-1a-masters-kops-peelmicro-com: Still creating... (1m20s elapsed)
aws_autoscaling_group.master-eu-central-1a-masters-kops-peelmicro-com: Still creating... (1m30s elapsed)
aws_autoscaling_group.master-eu-central-1a-masters-kops-peelmicro-com: Still creating... (1m40s elapsed)
aws_autoscaling_group.master-eu-central-1a-masters-kops-peelmicro-com: Still creating... (1m50s elapsed)
aws_autoscaling_group.master-eu-central-1a-masters-kops-peelmicro-com: Still creating... (2m0s elapsed)
aws_autoscaling_group.master-eu-central-1a-masters-kops-peelmicro-com: Creation complete after 2m8s (ID: master-eu-central-1a.masters.kops.peelmicro.com)
Apply complete! Resources: 35 added, 0 changed, 0 destroyed.
Outputs:
cluster_name = kops.peelmicro.com
master_autoscaling_group_ids = [
master-eu-central-1a.masters.kops.peelmicro.com
]
master_security_group_ids = [
sg-0f0a41bf4931e4e6e
]
masters_role_arn = arn:aws:iam::972569889348:role/masters.kops.peelmicro.com
masters_role_name = masters.kops.peelmicro.com
node_autoscaling_group_ids = [
nodes.kops.peelmicro.com
]
node_security_group_ids = [
sg-0743e87a965010755
]
node_subnet_ids = [
subnet-0ed756e2828d8836f
]
nodes_role_arn = arn:aws:iam::972569889348:role/nodes.kops.peelmicro.com
nodes_role_name = nodes.kops.peelmicro.com
region = eu-central-1
route_table_public_id = rtb-0f63cc01eb0211053
subnet_eu-central-1a_id = subnet-0ed756e2828d8836f
vpc_cidr_block = 172.20.0.0/16
vpc_id = vpc-028e164a261a97de4
- Ensure the nodes are running by executing the following command:
root@ubuntu-s-1vcpu-2gb-lon1-01:~/kops_cluster/devopsinuse_terraform# kubectl get nodes
NAME                                             STATUS   ROLES    AGE   VERSION
ip-172-20-45-184.eu-central-1.compute.internal   Ready    master   6m    v1.10.12
ip-172-20-50-246.eu-central-1.compute.internal   Ready    node     5m    v1.10.12
ip-172-20-56-4.eu-central-1.compute.internal     Ready    node     4m    v1.10.12
- And the following command as well:
root@ubuntu-s-1vcpu-2gb-lon1-01:~/kops_cluster/devopsinuse_terraform# kubectl get pods -n kube-system
NAME                                                                     READY   STATUS    RESTARTS   AGE
dns-controller-5875f77c46-psn65                                          1/1     Running   0          8m
etcd-server-events-ip-172-20-45-184.eu-central-1.compute.internal        1/1     Running   0          8m
etcd-server-ip-172-20-45-184.eu-central-1.compute.internal               1/1     Running   0          7m
kube-apiserver-ip-172-20-45-184.eu-central-1.compute.internal            1/1     Running   0          8m
kube-controller-manager-ip-172-20-45-184.eu-central-1.compute.internal   1/1     Running   0          8m
kube-dns-5fbcb4d67b-77r68                                                3/3     Running   0          8m
kube-dns-5fbcb4d67b-tqbx2                                                3/3     Running   0          6m
kube-dns-autoscaler-6874c546dd-79tls                                     1/1     Running   0          8m
kube-proxy-ip-172-20-45-184.eu-central-1.compute.internal                1/1     Running   0          8m
kube-proxy-ip-172-20-50-246.eu-central-1.compute.internal                1/1     Running   0          7m
kube-proxy-ip-172-20-56-4.eu-central-1.compute.internal                  1/1     Running   0          5m
kube-scheduler-ip-172-20-45-184.eu-central-1.compute.internal            1/1     Running   0          8m
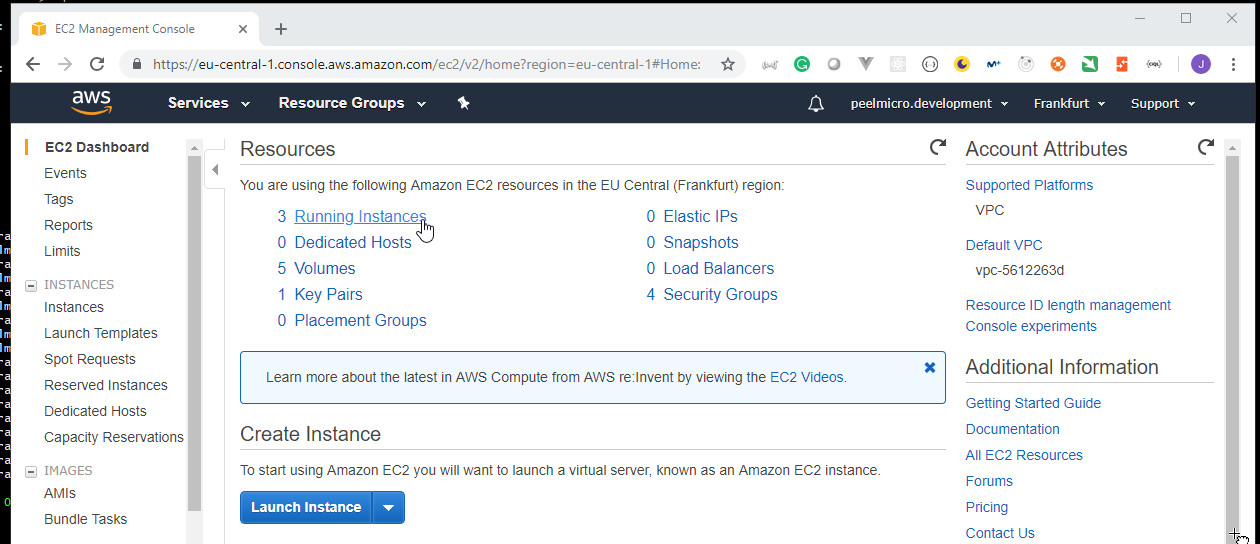

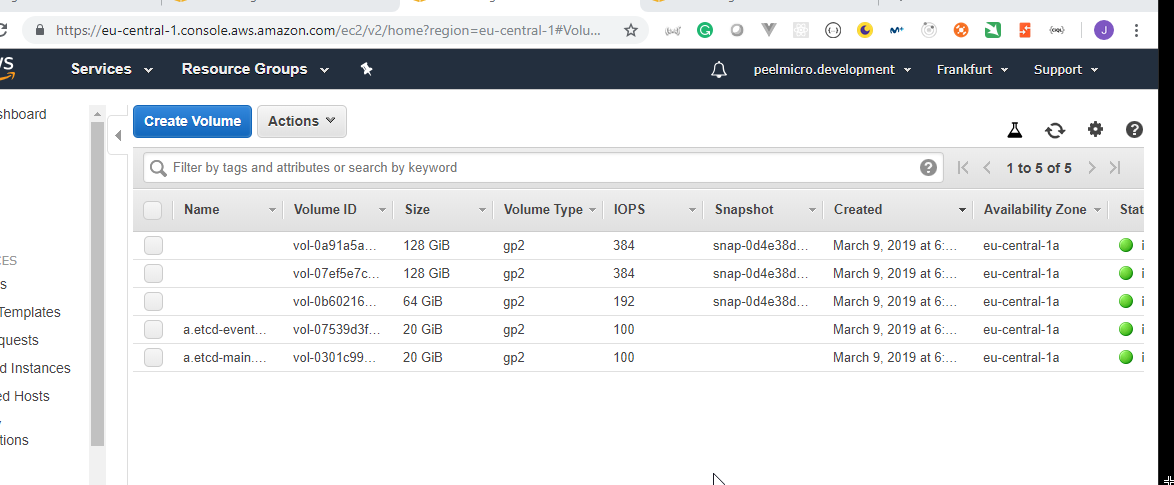
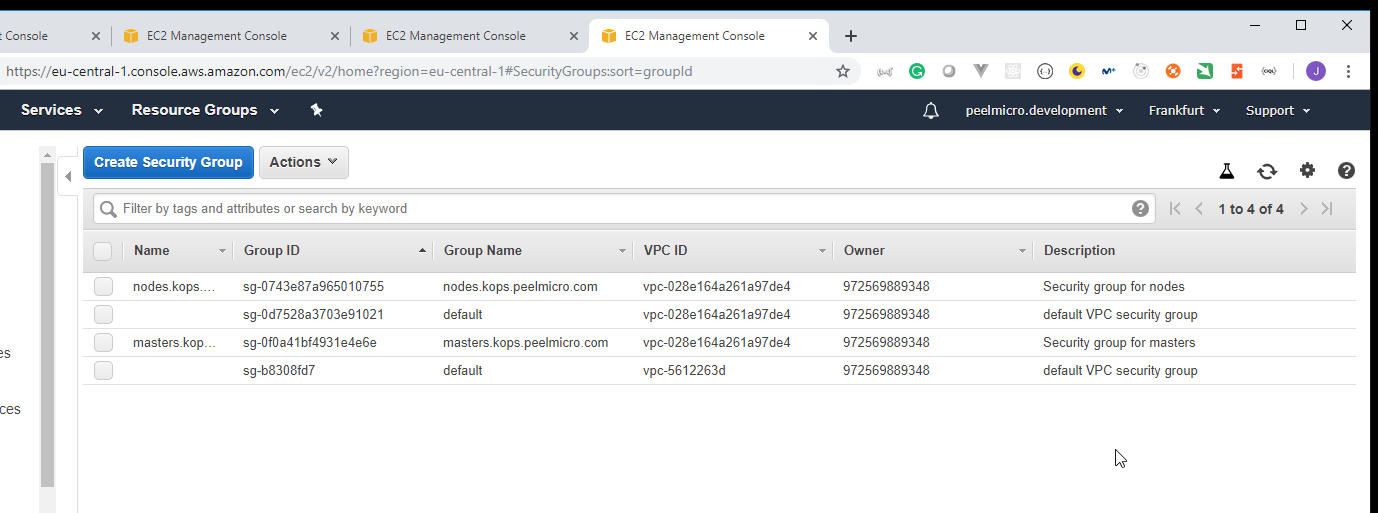
Section: 2. Jupyter Notebooks
15. Materials: How to run Jupyter Notebooks locally as Docker image
Run this code to start up your personal Jupyter Notebook locally from Docker image
docker ps
docker run --name djupyter -d  -p 8888:8888 jupyter/scipy-notebook:2c80cf3537ca6f1d5c03efced84f7e9502649c1618e8304f304a69ce3f6100d2ef11111

docker logs 6f1d5c03efced84f7e9502649c1618e8304f304a69ce3f6100d2ef11111 -f
...
...
    Copy/paste this URL into your browser when you connect for the first time,
    to login with a token:
        http://localhost:8888/?token=<some_long_token>
...
...
docker stop djupyter
16. How to Run Jupyter Notebooks in Docker on local
Jupyter Notebook (formerly IPython Notebooks) is a web-based interactive computational environment for creating Jupyter notebooks documents. The "notebook" term can colloquially make reference to many different entities, mainly the Jupyter web application, Jupyter Python web server, or Jupyter document format depending on context. A Jupyter Notebook document is a JSON document, following a versioned schema, and containing an ordered list of input/output cells which can contain code, text (using Markdown), mathematics, plots and rich media, usually ending with the ".ipynb" extension.
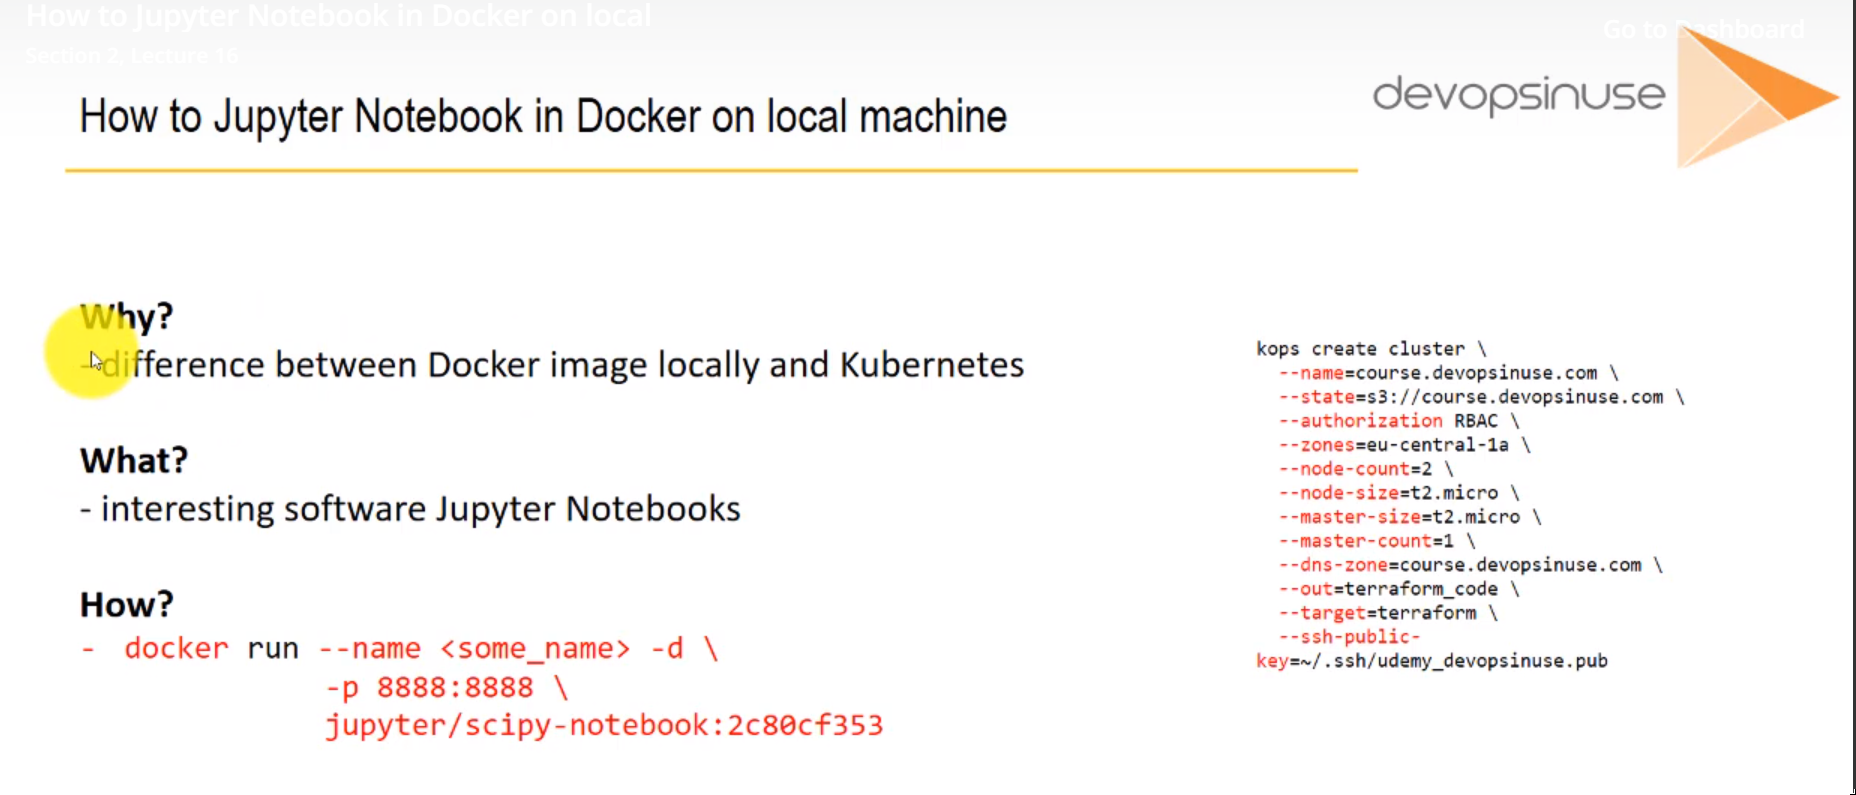
- Execute the following command to run
Jupyter Notebookslocally
root@ubuntu-s-1vcpu-2gb-lon1-01:~# docker run --name djupyter -d  -p 8888:8888 jupyter/scipy-notebook
Unable to find image 'jupyter/scipy-notebook:latest' locally
latest: Pulling from jupyter/scipy-notebook
a48c500ed24e: Pull complete
1e1de00ff7e1: Pull complete
0330ca45a200: Pull complete
471db38bcfbf: Pull complete
0b4aba487617: Pull complete
1bac85b3a63e: Pull complete
245be47b44f6: Pull complete
ef168d10cf08: Pull complete
d98c23daad7b: Pull complete
99b203837d0d: Pull complete
25df193e31e9: Pull complete
ddcf0a223562: Pull complete
1e2fe965dac0: Pull complete
b63a5ffe9c96: Pull complete
6ca87129d8d0: Pull complete
2a73511ff252: Pull complete
351d62aa301f: Pull complete
72b6ddf4e0d0: Pull complete
b11a5de29fab: Pull complete
4adaa8f182a9: Pull complete
25c263e00440: Pull complete
501679de7443: Pull complete
3f62de1e27f3: Pull complete
Digest: sha256:3fb772e703d07b9fa1d1f09a854a8f0fff448e78c4c83d2f01ab4fcc65d4cc4a
Status: Downloaded newer image for jupyter/scipy-notebook:latest
f2a4d16708ec0c3071e05386caac733e9889233caf09b3258ee1c24147d87462
- Ensure it is running
root@ubuntu-s-1vcpu-2gb-lon1-01:~# docker ps
CONTAINER ID        IMAGE                    COMMAND                  CREATED             STATUS              PORTS                    NAMES
f2a4d16708ec        jupyter/scipy-notebook   "tini -g -- start-..."   24 seconds ago      Up 22 seconds       0.0.0.0:8888->8888/tcp   djupyter
- Run the following commands to see the logs of the
Jupyter Notebookscontainer running
root@ubuntu-s-1vcpu-2gb-lon1-01:~# docker logs f2a4d16708ec0c3071e05386caac733e9889233caf09b3258ee1c24147d87462
Executing the command: jupyter notebook
[I 06:35:10.678 NotebookApp] Writing notebook server cookie secret to /home/jovyan/.local/share/jupyter/runtime/notebook_cookie_secret
[I 06:35:11.351 NotebookApp] JupyterLab extension loaded from /opt/conda/lib/python3.7/site-packages/jupyterlab
[I 06:35:11.351 NotebookApp] JupyterLab application directory is /opt/conda/share/jupyter/lab
[I 06:35:11.354 NotebookApp] Serving notebooks from local directory: /home/jovyan
[I 06:35:11.354 NotebookApp] The Jupyter Notebook is running at:
[I 06:35:11.354 NotebookApp] http://(f2a4d16708ec or 127.0.0.1):8888/?token=3076d3fa3766b4e4a66c41ad7cfd05c51cd335cd085ba0ba
[I 06:35:11.354 NotebookApp] Use Control-C to stop this server and shut down all kernels (twice to skip confirmation).
[C 06:35:11.359 NotebookApp]

    To access the notebook, open this file in a browser:
        file:///home/jovyan/.local/share/jupyter/runtime/nbserver-5-open.html
    Or copy and paste one of these URLs:
        http://(f2a4d16708ec or 127.0.0.1):8888/?token=3076d3fa3766b4e4a66c41ad7cfd05c51cd335cd085ba0ba
- Browse to http://68.183.44.204:8888/?token=3076d3fa3766b4e4a66c41ad7cfd05c51cd335cd085ba0ba

- Create a new
Jupyter Notebookclicking onNew -> Python 3

- Write and run:
for i in range(1,7):
    print('this is amazing for the {} time'.format(i))

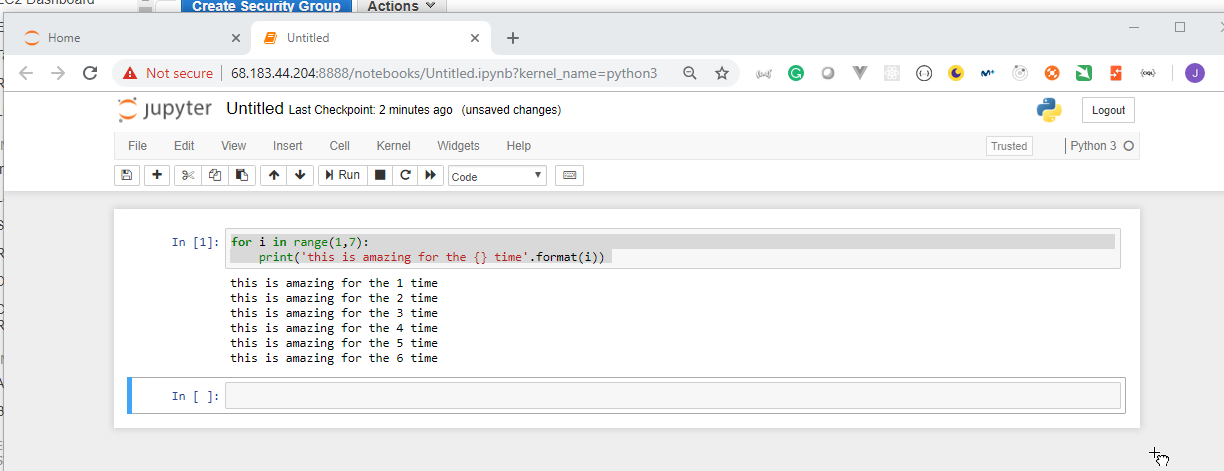
17. How to deploy Jupyter Notebooks to Kubernetes AWS (Part 1)
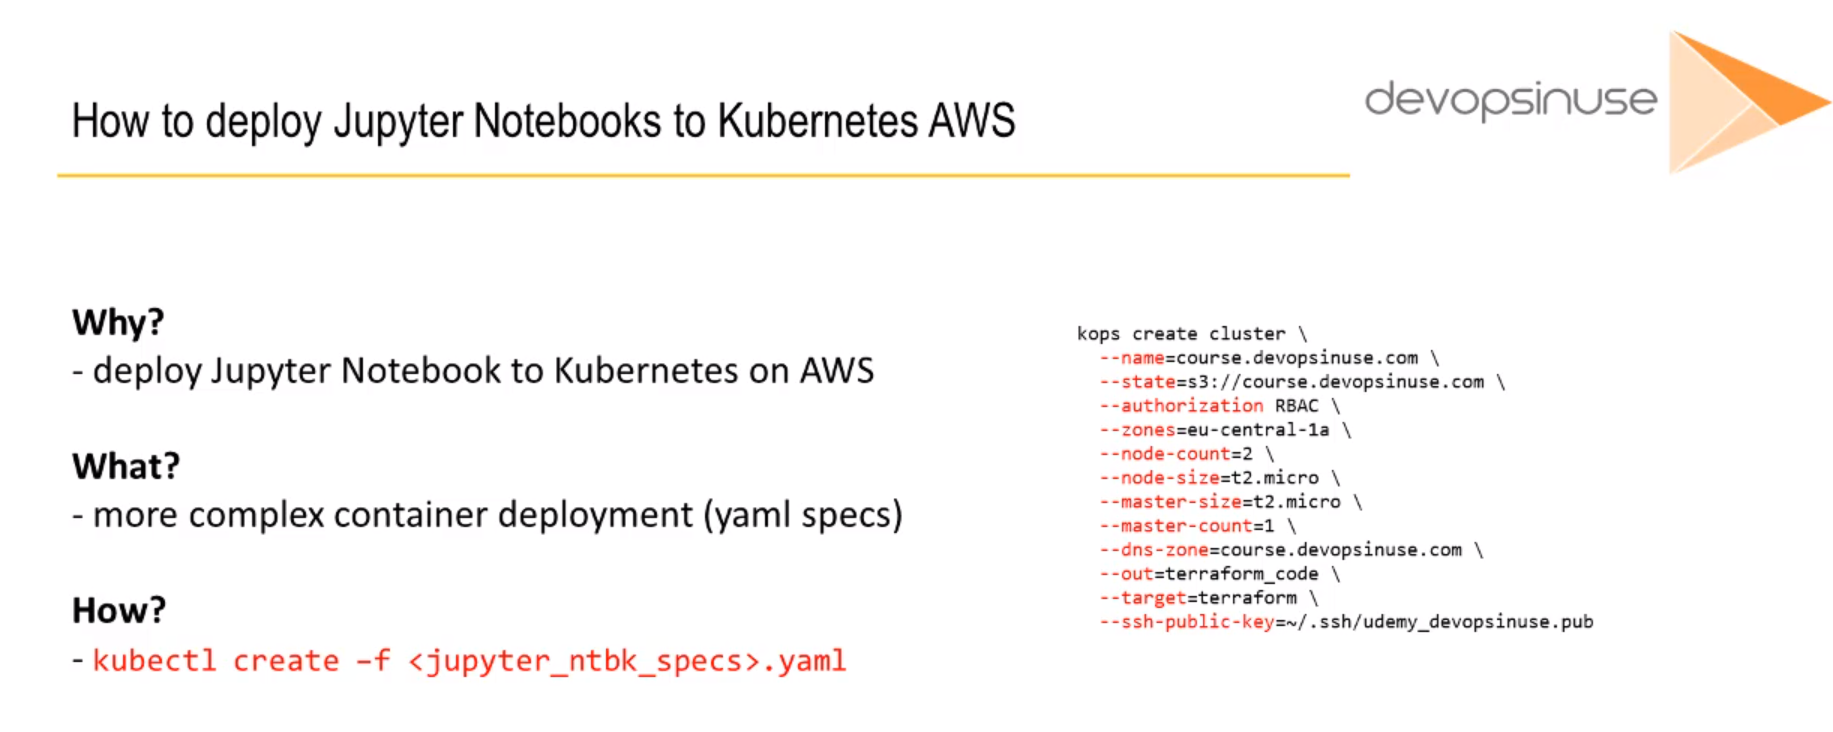
- We can see if the
Jupyter containeris still running.
root@ubuntu-s-1vcpu-2gb-lon1-01:~# docker ps
CONTAINER ID        IMAGE                    COMMAND                  CREATED             STATUS              PORTS                    NAMES
f2a4d16708ec        jupyter/scipy-notebook   "tini -g -- start-..."   4 hours ago         Up 4 hours          0.0.0.0:8888->8888/tcp   djupyter
- We can stop the container by executing
root@ubuntu-s-1vcpu-2gb-lon1-01:~# docker stop djupyter
djupyter
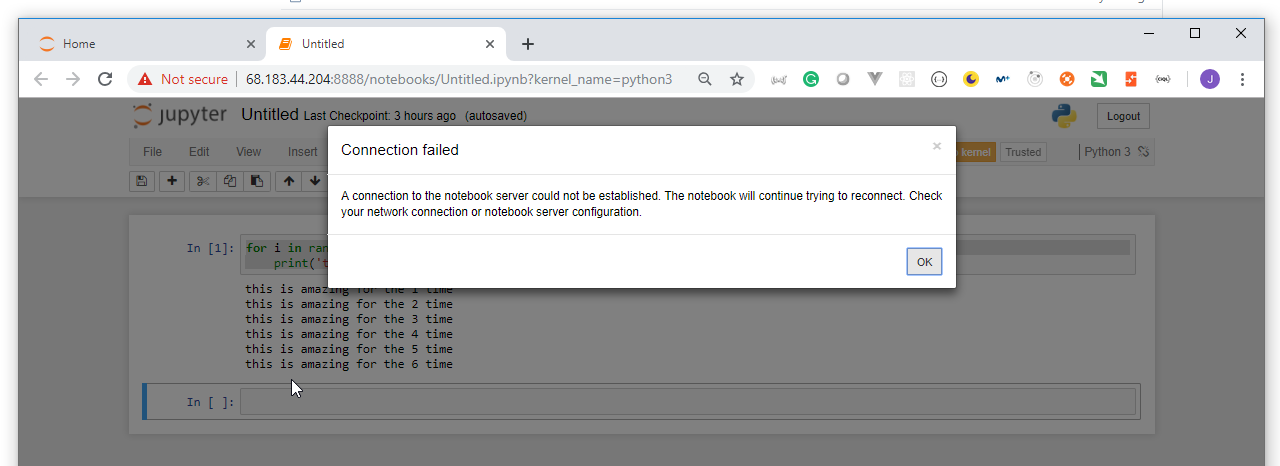
18. Materials: How to deploy Juypyter Notebooks to Kubernetes via YAML file
Simple Kubernetes YAML specification for Jupyter Notebooks
Create Save these line to a file: jupyter_notebook.yaml
Execute deployment: kubectl create -f jupyter_notebook.yaml
jupyter_notebook.yaml
apiVersion: apps/v1
kind: Deployment
metadata:
  name: jupyter-k8s-udemy
  labels:
    app: jupyter-k8s-udemy
spec:
  replicas: 1
  selector:
    matchLabels:
      app: jupyter-k8s-udemy
  template:
    metadata:
      labels:
        app: jupyter-k8s-udemy
    spec:
      containers:
        - name: minimal-notebook
          image: jupyter/minimal-notebook:latest
          ports:
            - containerPort: 8888
          command: ["start-notebook.sh"]
          args: ["--NotebookApp.token=''"]
---
kind: Service
apiVersion: v1
metadata:
  name: jupyter-k8s-udemy
spec:
  type: NodePort
  selector:
    app: jupyter-k8s-udemy
  ports:
    - protocol: TCP
      nodePort: 30040
      port: 8888
      targetPort: 8888
19. How to deploy Jupyter Notebooks to Kubernetes AWS (Part 2)
Create the
jupyter_notebook.yamldocumentEnsure it is created
root@ubuntu-s-1vcpu-2gb-lon1-01:~/kops_cluster# vi jupyter_notebook.yaml
root@ubuntu-s-1vcpu-2gb-lon1-01:~/kops_cluster# cat jupyter_notebook.yaml
apiVersion: apps/v1
kind: Deployment
metadata:
  name: jupyter-k8s-udemy
  labels:
    app: jupyter-k8s-udemy
spec:
  replicas: 1
  selector:
    matchLabels:
      app: jupyter-k8s-udemy
  template:
    metadata:
      labels:
        app: jupyter-k8s-udemy
    spec:
      containers:
      - name: minimal-notebook
        image: jupyter/minimal-notebook:latest
        ports:
        - containerPort: 8888
        command: ["start-notebook.sh"]
        args: ["--NotebookApp.token=''"]
---
kind: Service
apiVersion: v1
metadata:
  name: jupyter-k8s-udemy
spec:
  type: NodePort
  selector:
    app: jupyter-k8s-udemy
  ports:
  - protocol: TCP
    nodePort: 30040
    port: 8888
    targetPort: 8888
- Ensure the k8s cluster is also running
root@ubuntu-s-1vcpu-2gb-lon1-01:~/kops_cluster# kubectl get nodes
NAME                                             STATUS   ROLES    AGE   VERSION
ip-172-20-45-184.eu-central-1.compute.internal   Ready    master   4h    v1.10.12
ip-172-20-50-246.eu-central-1.compute.internal   Ready    node     4h    v1.10.12
ip-172-20-56-4.eu-central-1.compute.internal     Ready    node     4h    v1.10.12
20. How to deploy Jupyter Notebooks to Kubernetes AWS (Part 3)
- Execute the following command to create the deployment and the service from the
jupyter_notebook.yamldocument.
root@ubuntu-s-1vcpu-2gb-lon1-01:~/kops_cluster# kubectl create -f jupyter_notebook.yaml
deployment.apps/jupyter-k8s-udemy created
service/jupyter-k8s-udemy created
root@ubuntu-s-1vcpu-2gb-lon1-01:~/kops_cluster#
- Ensure if the pod and the service has been created executing the following command.
root@ubuntu-s-1vcpu-2gb-lon1-01:~/kops_cluster# kubectl get svc,pod
NAME                        TYPE        CLUSTER-IP     EXTERNAL-IP   PORT(S)          AGE
service/jupyter-k8s-udemy   NodePort    100.64.248.5   <none>        8888:30040/TCP   1m
service/kubernetes          ClusterIP   100.64.0.1     <none>        443/TCP          4h

NAME                                     READY   STATUS              RESTARTS   AGE
pod/jupyter-k8s-udemy-79f7dd7ffc-84nch   0/1     ContainerCreating   0          1m
- We can execute the following command to check what is there inside the
pod
root@ubuntu-s-1vcpu-2gb-lon1-01:~/kops_cluster# kubectl describe pod/jupyter-k8s-udemy-79f7dd7ffc-84nch
Name:           jupyter-k8s-udemy-79f7dd7ffc-84nch
Namespace:      default
Node:           ip-172-20-56-4.eu-central-1.compute.internal/172.20.56.4
Start Time:     Sat, 09 Mar 2019 10:39:58 +0000
Labels:         app=jupyter-k8s-udemy
                pod-template-hash=3593883997
Annotations:    kubernetes.io/limit-ranger: LimitRanger plugin set: cpu request for container minimal-notebook
Status:         Running
IP:             100.96.2.2
Controlled By:  ReplicaSet/jupyter-k8s-udemy-79f7dd7ffc
Containers:
  minimal-notebook:
    Container ID:  docker://0ed3fa16052e5a7987cebaac7516bd16c0ab0277377dcc6bea5e00dc9708fd12
    Image:         jupyter/minimal-notebook:latest
    Image ID:      docker-pullable://jupyter/minimal-notebook@sha256:8dc0487609f395526585d99dbf691e95b332789e749ef723b49868685016fd9e
    Port:          8888/TCP
    Host Port:     0/TCP
    Command:
      start-notebook.sh
    Args:
      --NotebookApp.token=''
    State:          Running
      Started:      Sat, 09 Mar 2019 10:41:40 +0000
    Ready:          True
    Restart Count:  0
    Requests:
      cpu:        100m
    Environment:  <none>
    Mounts:
      /var/run/secrets/kubernetes.io/serviceaccount from default-token-fmjqc (ro)
Conditions:
  Type           Status
  Initialized    True
  Ready          True
  PodScheduled   True
Volumes:
  default-token-fmjqc:
    Type:        Secret (a volume populated by a Secret)
    SecretName:  default-token-fmjqc
    Optional:    false
QoS Class:       Burstable
Node-Selectors:  <none>
Tolerations:     node.kubernetes.io/not-ready:NoExecute for 300s
                 node.kubernetes.io/unreachable:NoExecute for 300s
Events:
  Type    Reason                 Age    From                                                   Message
  ----    ------                 ----   ----                                                   -------
  Normal  Scheduled              3m31s  default-scheduler                                      Successfully assigned jupyter-k8s-udemy-79f7dd7ffc-84nch to ip-172-20-56-4.eu-central-1.compute.internal
  Normal  SuccessfulMountVolume  3m31s  kubelet, ip-172-20-56-4.eu-central-1.compute.internal  MountVolume.SetUp succeeded for volume "default-token-fmjqc"
  Normal  Pulling                3m30s  kubelet, ip-172-20-56-4.eu-central-1.compute.internal  pulling image "jupyter/minimal-notebook:latest"
  Normal  Pulled                 109s   kubelet, ip-172-20-56-4.eu-central-1.compute.internal  Successfully pulled image "jupyter/minimal-notebook:latest"
  Normal  Created                109s   kubelet, ip-172-20-56-4.eu-central-1.compute.internal  Created container
  Normal  Started                109s   kubelet, ip-172-20-56-4.eu-central-1.compute.internal  Started container
- Ensure it is already running
root@ubuntu-s-1vcpu-2gb-lon1-01:~/kops_cluster# kubectl get svc,pod
NAME                        TYPE        CLUSTER-IP     EXTERNAL-IP   PORT(S)          AGE
service/jupyter-k8s-udemy   NodePort    100.64.248.5   <none>        8888:30040/TCP   4m
service/kubernetes          ClusterIP   100.64.0.1     <none>        443/TCP          4h

NAME                                     READY   STATUS    RESTARTS   AGE
pod/jupyter-k8s-udemy-79f7dd7ffc-84nch   1/1     Running   0          4m
- We can check what is there inside the service by running the following command:
root@ubuntu-s-1vcpu-2gb-lon1-01:~/kops_cluster# kubectl describe service/jupyter-k8s-udemy
Name:                     jupyter-k8s-udemy
Namespace:                default
Labels:                   <none>
Annotations:              <none>
Selector:                 app=jupyter-k8s-udemy
Type:                     NodePort
IP:                       100.64.248.5
Port:                     <unset>  8888/TCP
TargetPort:               8888/TCP
NodePort:                 <unset>  30040/TCP
Endpoints:                100.96.2.2:8888
Session Affinity:         None
External Traffic Policy:  Cluster
Events:                   <none>
21. Materials: How to SSH to the physical servers in AWS
How to SSH to physical EC2 instances in AWS
ssh -i ~/.ssh/<your_public_key>.pub admin@<public_ip_address_of_node_1>
ssh -i ~/.ssh/<your_public_key>.pub admin@<public_ip_address_of_node_2>
ssh -i ~/.ssh/<your_public_key>.pub admin@<public_ip_address_of_master>
These publicly accessible IP addresses can be retrieved even from your command line
aws ec2 describe-instances \
  --query "Reservations[*].Instances[*].PublicIpAddress" \
  --output=text
22. How to deploy Jupyter Notebooks to Kubernetes AWS (Part 4)
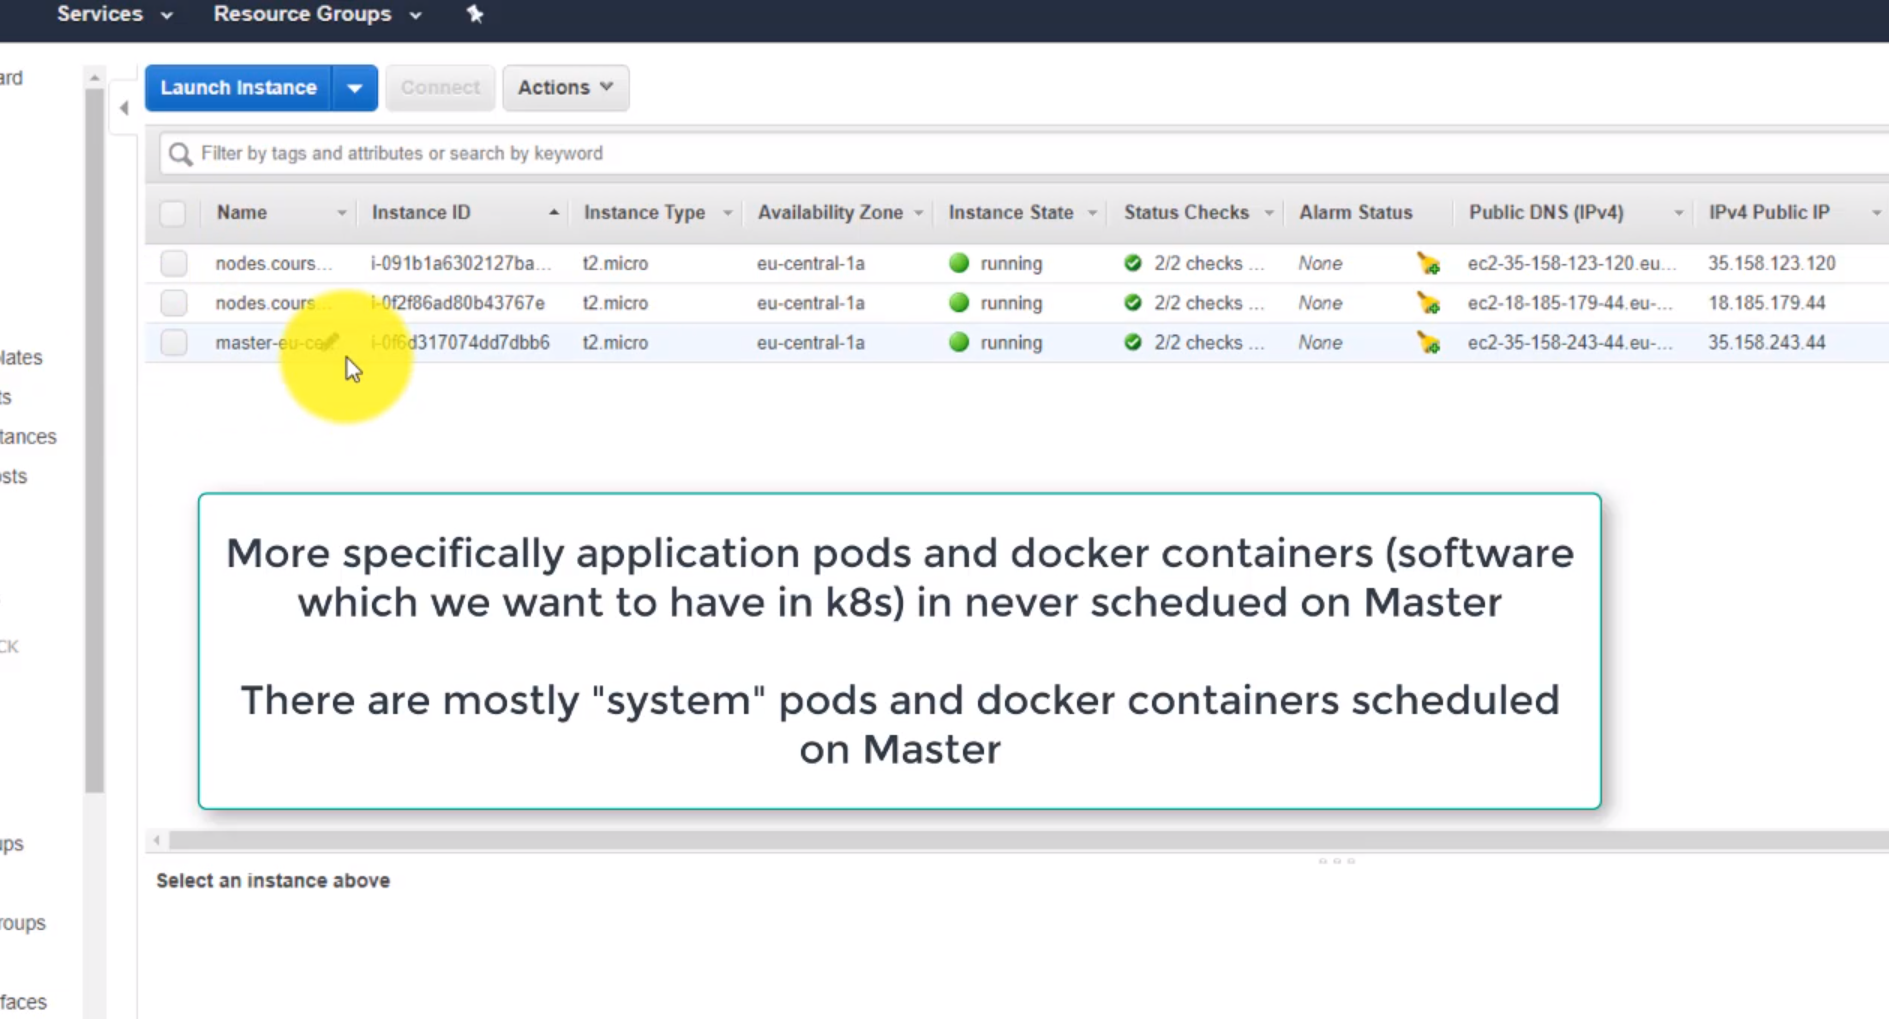
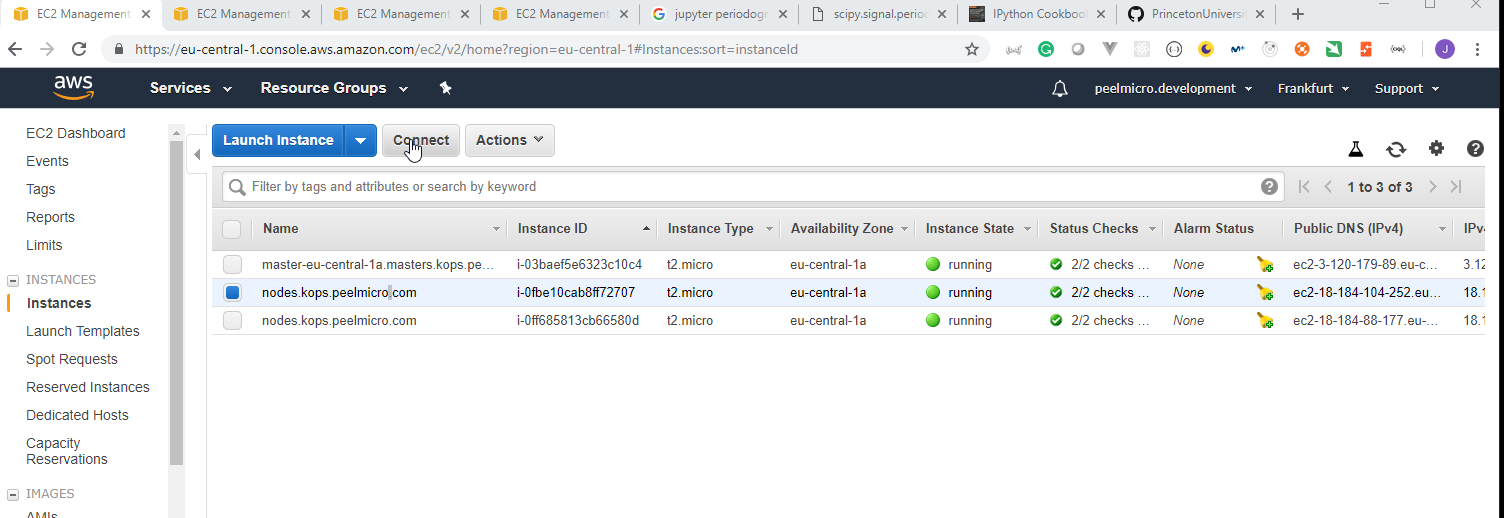
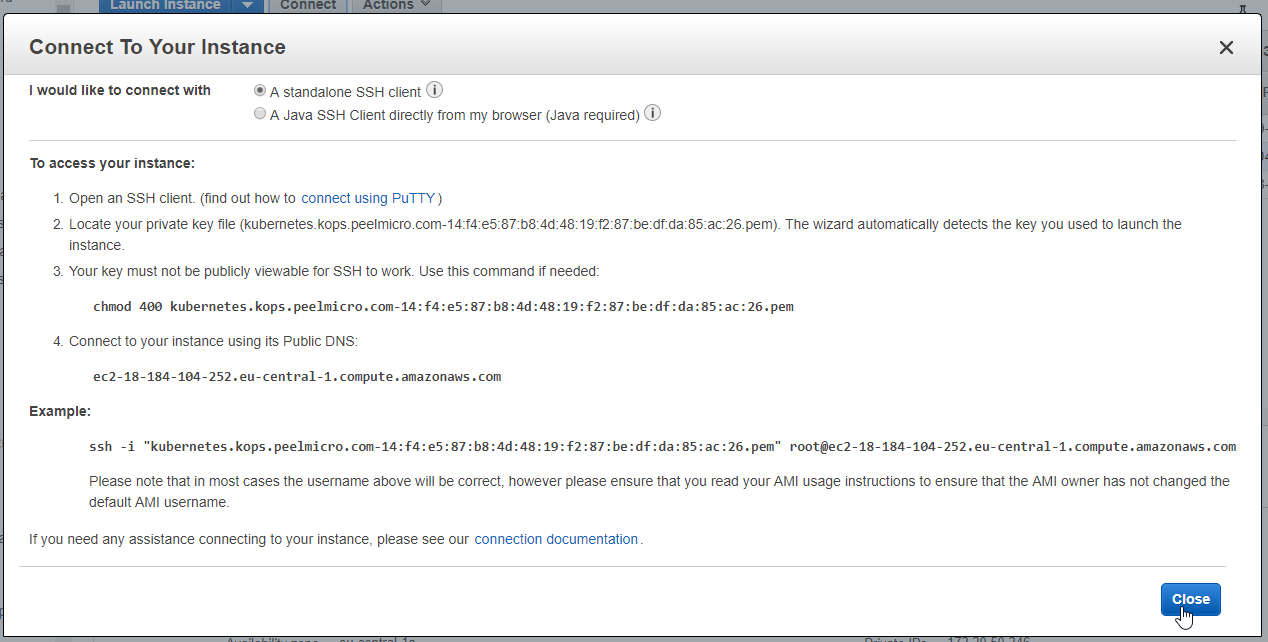
ssh -i "kubernetes.kops.peelmicro.com-14:f4:e5:87:b8:4d:48:19:f2:87:be:df:da:85:ac:26.pem" root@ec2-18-184-104-252.eu-central-1.compute.amazonaws.com
- We need to use our local ssh and the user must be
admin.
ssh -i ~/.ssh/udemy_devopsinuse admin@ec2-18-184-104-252.eu-central-1.compute.amazonaws.com
- Execute the following command to connect the node:
root@ubuntu-s-1vcpu-2gb-lon1-01:~/kops_cluster# ssh -i ~/.ssh/udemy_devopsinuse admin@ec2-18-184-104-252.eu-central-1.compute.amazonaws.com
The authenticity of host 'ec2-18-184-104-252.eu-central-1.compute.amazonaws.com (18.184.104.252)' can't be established.
ECDSA key fingerprint is SHA256:sL/7skUzmZBRIZ4FKARJ7hUg3tpetM3J47LBXwqeFoE.
Are you sure you want to continue connecting (yes/no)?
- Enter
yes
Are you sure you want to continue connecting (yes/no)? yes
Warning: Permanently added 'ec2-18-184-104-252.eu-central-1.compute.amazonaws.com,18.184.104.252' (ECDSA) to the list of known hosts.

The programs included with the Debian GNU/Linux system are free software;
the exact distribution terms for each program are described in the
individual files in /usr/share/doc/*/copyright.

Debian GNU/Linux comes with ABSOLUTELY NO WARRANTY, to the extent
permitted by applicable law.
admin@ip-172-20-50-246:~$ sudo bash
root@ip-172-20-50-246:/home/admin# netstat -tunlp | grep 30040
tcp6       0      0 :::30040                :::*                    LISTEN      1548/kube-proxy
root@ip-172-20-50-246:/home/admin# exit
exit
admin@ip-172-20-50-246:~$ logout
Connection to ec2-18-184-104-252.eu-central-1.compute.amazonaws.com closed.
- We can do the same with the second node.
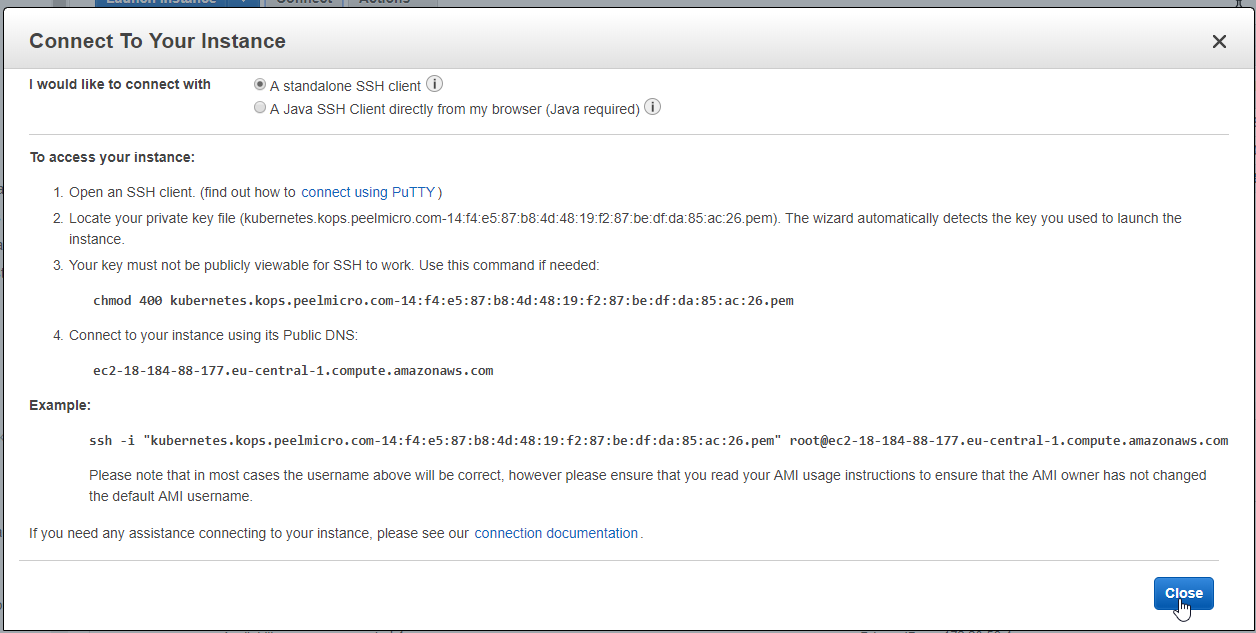
ssh -i "kubernetes.kops.peelmicro.com-14:f4:e5:87:b8:4d:48:19:f2:87:be:df:da:85:ac:26.pem" root@ec2-18-184-88-177.eu-central-1.compute.amazonaws.com
ssh -i ~/.ssh/udemy_devopsinuse admin@ec2-18-184-88-177.eu-central-1.compute.amazonaws.com
root@ubuntu-s-1vcpu-2gb-lon1-01:~/kops_cluster# ssh -i ~/.ssh/udemy_devopsinuse admin@ec2-18-184-88-177.eu-central-1.compute.amazonaws.com
The authenticity of host 'ec2-18-184-88-177.eu-central-1.compute.amazonaws.com (18.184.88.177)' can't be established.
ECDSA key fingerprint is SHA256:59rnLDQLBcL5onqke7Gim3qSO2XFym4Amjk84JXmJWA.
Are you sure you want to continue connecting (yes/no)? yes
Warning: Permanently added 'ec2-18-184-88-177.eu-central-1.compute.amazonaws.com,18.184.88.177' (ECDSA) to the list of known hosts.

The programs included with the Debian GNU/Linux system are free software;
the exact distribution terms for each program are described in the
individual files in /usr/share/doc/*/copyright.

Debian GNU/Linux comes with ABSOLUTELY NO WARRANTY, to the extent
permitted by applicable law.
admin@ip-172-20-56-4:~$ sudo bash
root@ip-172-20-56-4:/home/admin# netstat -tunlp | grep 30040
tcp6       0      0 :::30040                :::*                    LISTEN      1545/kube-proxy
root@ip-172-20-56-4:/home/admin# exit
exit
admin@ip-172-20-56-4:~$ logout
Connection to ec2-18-184-88-177.eu-central-1.compute.amazonaws.com closed.
23. How to deploy Jupyter Notebooks to Kubernetes AWS (Part 5)
- Access inside the pod by executing the following command
root@ubuntu-s-1vcpu-2gb-lon1-01:~/kops_cluster# kubectl get pods,svc
NAME                                     READY   STATUS    RESTARTS   AGE
pod/jupyter-k8s-udemy-79f7dd7ffc-84nch   1/1     Running   0          32m

NAME                        TYPE        CLUSTER-IP     EXTERNAL-IP   PORT(S)          AGE
service/jupyter-k8s-udemy   NodePort    100.64.248.5   <none>        8888:30040/TCP   32m
service/kubernetes          ClusterIP   100.64.0.1     <none>        443/TCP          5h

root@ubuntu-s-1vcpu-2gb-lon1-01:~/kops_cluster# kubectl exec -it jupyter-k8s-udemy-79f7dd7ffc-84nch -- bash
jovyan@jupyter-k8s-udemy-79f7dd7ffc-84nch:~$
- We can see what is there inside the jupyter notefile configuration file
jovyan@jupyter-k8s-udemy-79f7dd7ffc-84nch:~$ cat /etc/jupyter/jupyter_notebook_config.py
# Copyright (c) Jupyter Development Team.
# Distributed under the terms of the Modified BSD License.

from jupyter_core.paths import jupyter_data_dir
import subprocess
import os
import errno
import stat

c = get_config()
c.NotebookApp.ip = '0.0.0.0'
c.NotebookApp.port = 8888
c.NotebookApp.open_browser = False

# https://github.com/jupyter/notebook/issues/3130
c.FileContentsManager.delete_to_trash = False

# Generate a self-signed certificate
if 'GEN_CERT' in os.environ:
    dir_name = jupyter_data_dir()
    pem_file = os.path.join(dir_name, 'notebook.pem')
    try:
        os.makedirs(dir_name)
    except OSError as exc:  # Python >2.5
        if exc.errno == errno.EEXIST and os.path.isdir(dir_name):
            pass
        else:
            raise

    # Generate an openssl.cnf file to set the distinguished name
    cnf_file = os.path.join(os.getenv('CONDA_DIR', '/usr/lib'), 'ssl', 'openssl.cnf')
    if not os.path.isfile(cnf_file):
        with open(cnf_file, 'w') as fh:
            fh.write('''\
[req]
distinguished_name = req_distinguished_name
[req_distinguished_name]
''')

    # Generate a certificate if one doesn't exist on disk
    subprocess.check_call(['openssl', 'req', '-new',
                           '-newkey', 'rsa:2048',
                           '-days', '365',
                           '-nodes', '-x509',
                           '-subj', '/C=XX/ST=XX/L=XX/O=generated/CN=generated',
                           '-keyout', pem_file,
                           '-out', pem_file])
    # Restrict access to the file
    os.chmod(pem_file, stat.S_IRUSR | stat.S_IWUSR)
    c.NotebookApp.certfile = pem_file

# Change default umask for all subprocesses of the notebook server if set in
# the environment
if 'NB_UMASK' in os.environ:
    os.umask(int(os.environ['NB_UMASK'], 8))jovyan@jupyter-k8s-udemy-79f7dd7ffc-84nch:~$ exit
exit
it can be seen that the
8888port is selected inc.NotebookApp.port = 8888Copy the IP from one of the nodes:

- Browse to
http://18.184.104.252:30040/
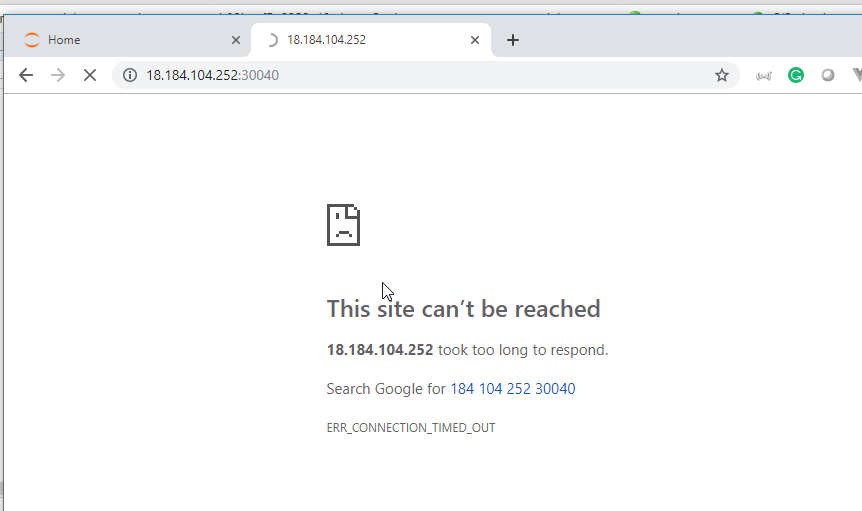
- We cannot access because the port is not opened. We have to open it in
security groups

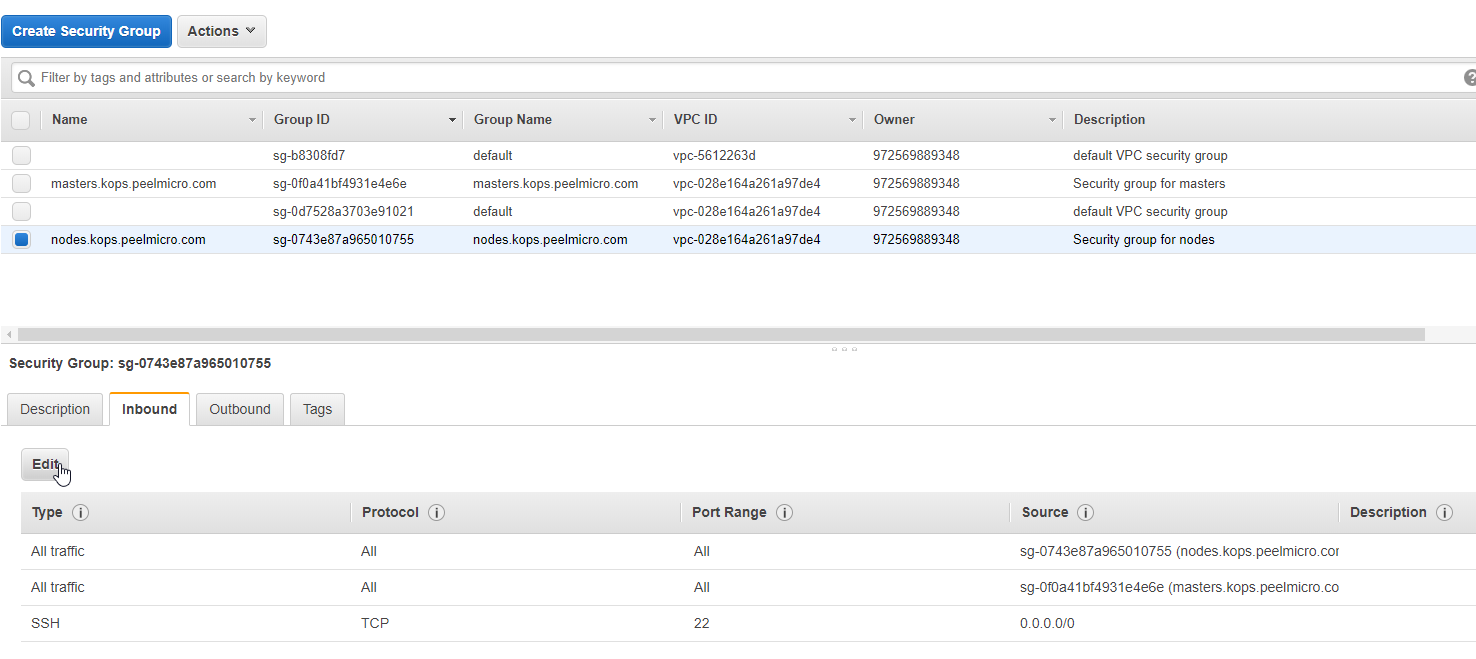
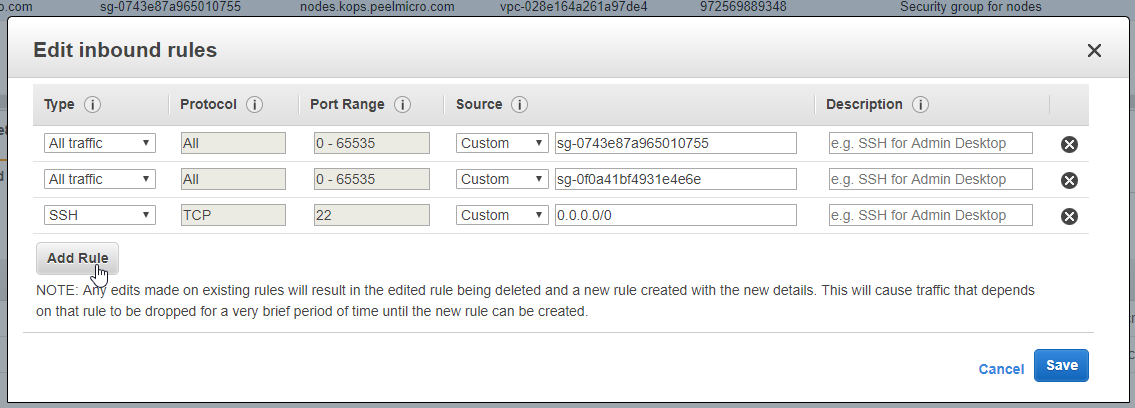
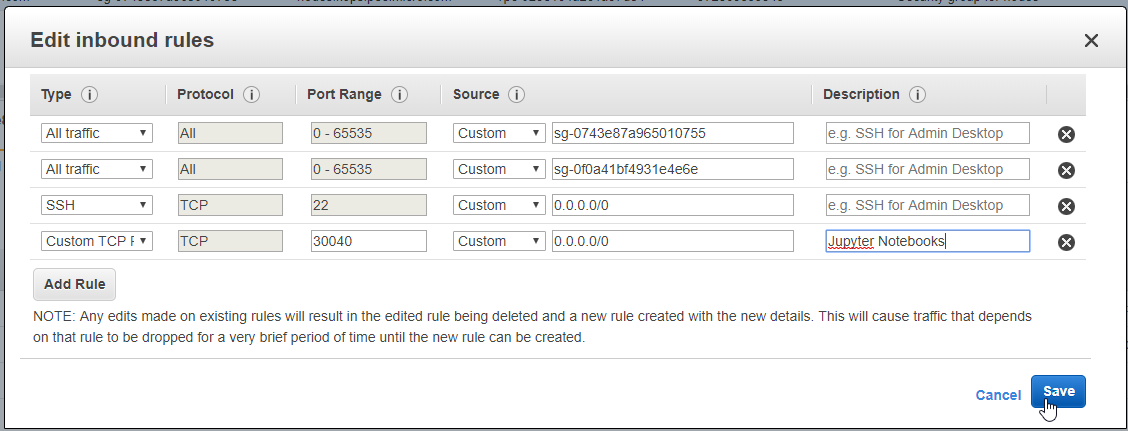
- Browse to
http://18.184.104.252:30040/again


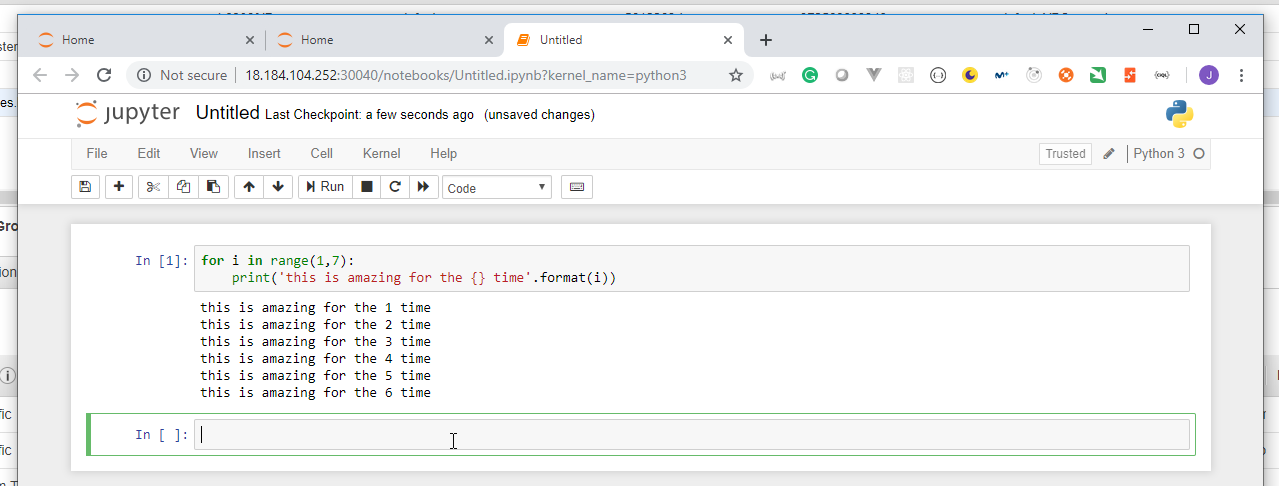
- Get the other node ip.

- Browse to
http://18.184.88.177:30040/


24. Comparison between Jupyter Notebooks running as Docker Container with Kubernetes
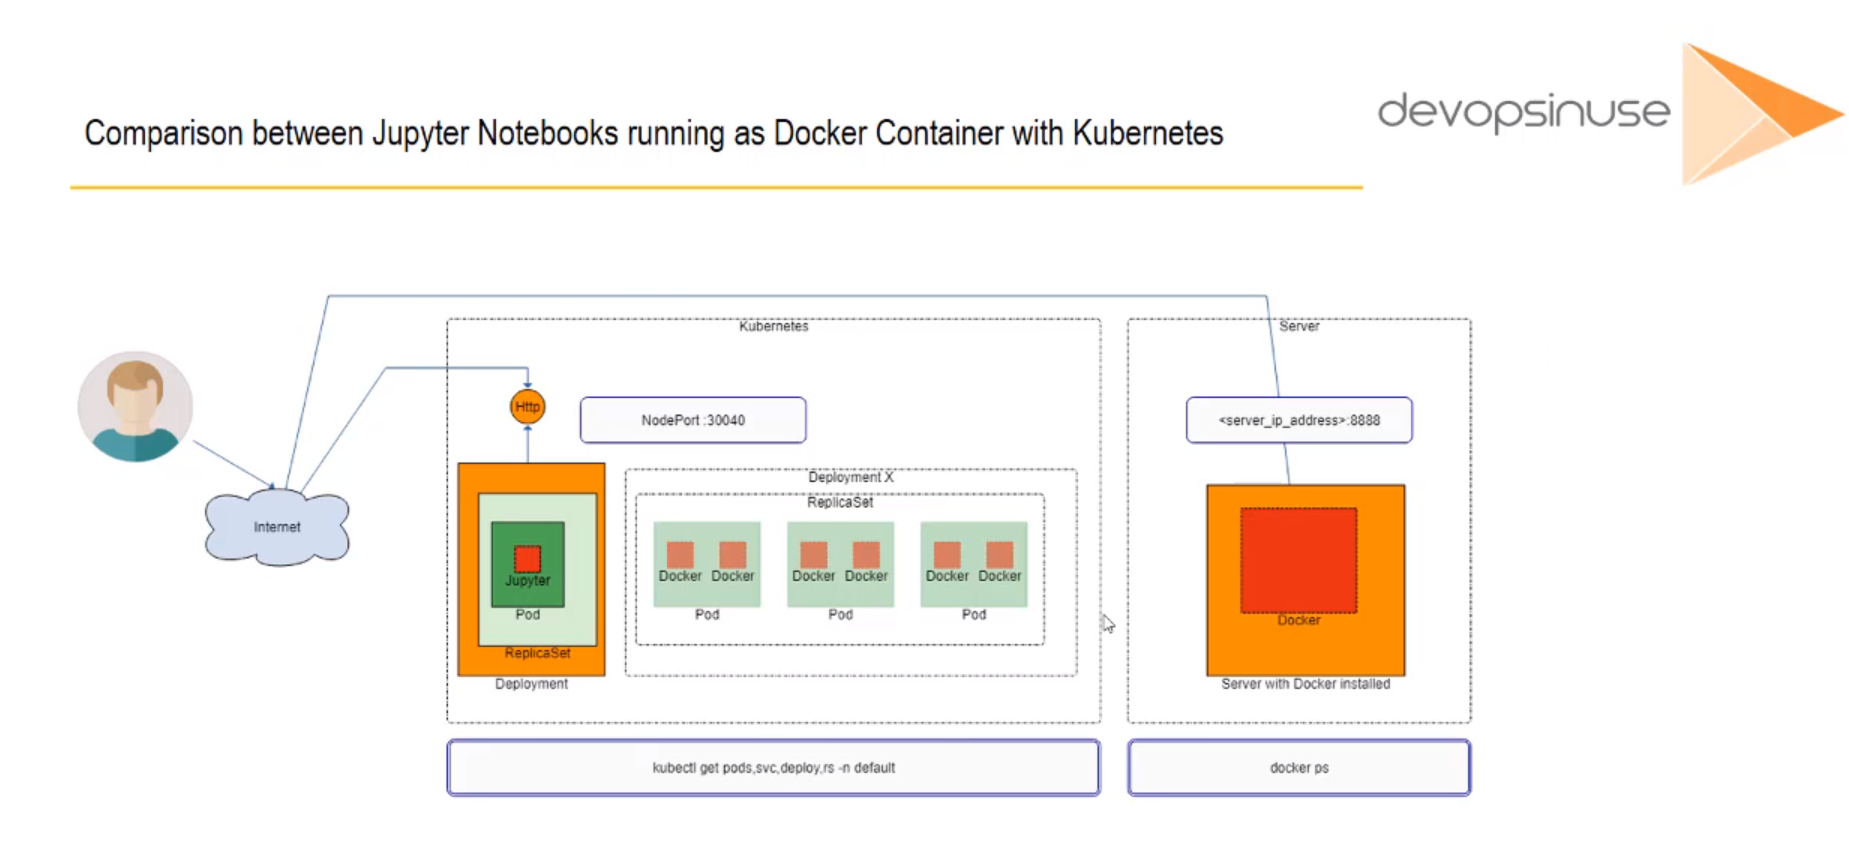
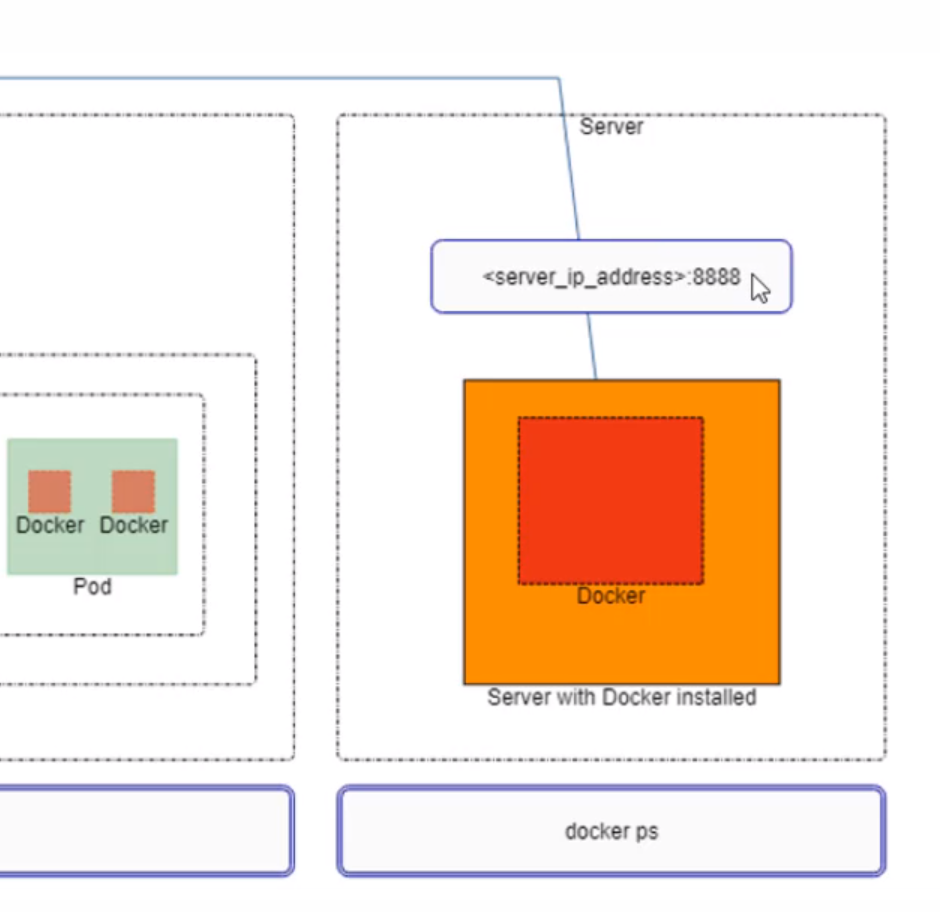
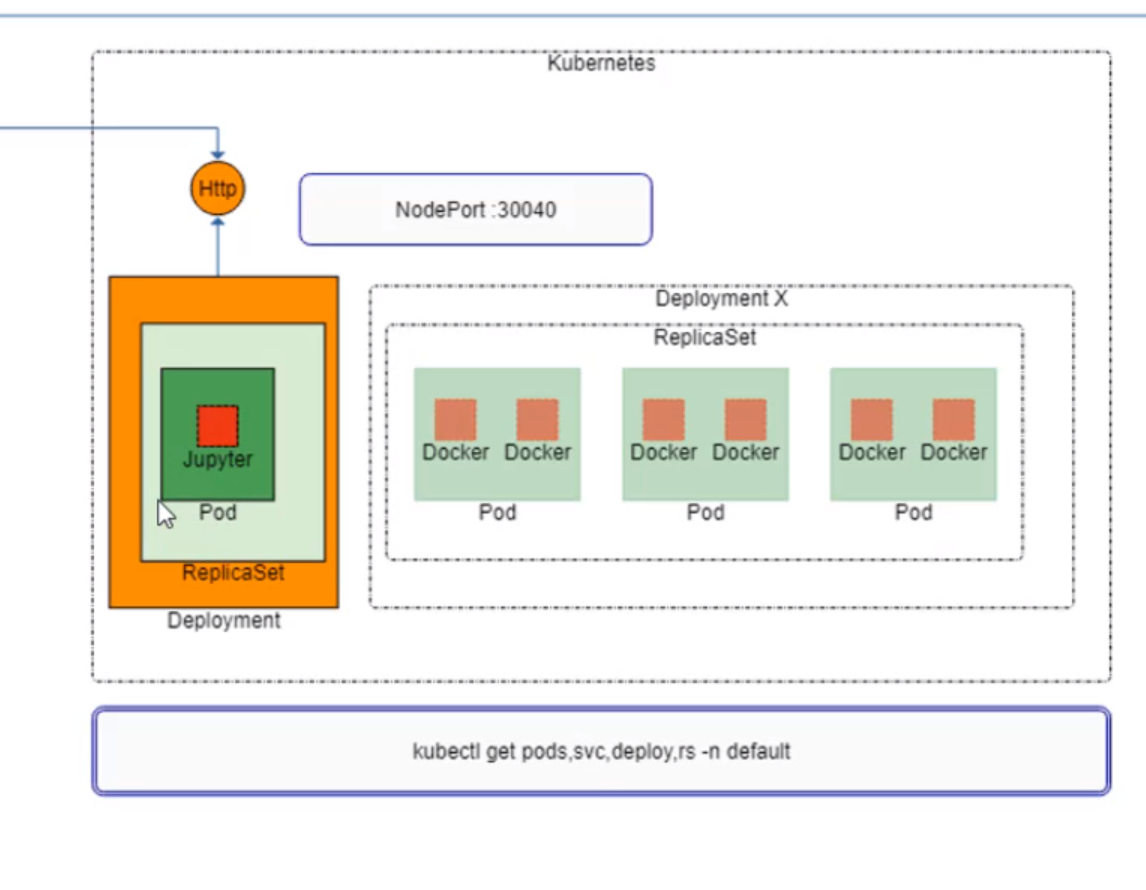
- If we detele the pod kubernetes creates it automatically
root@ubuntu-s-1vcpu-2gb-lon1-01:~/kops_cluster# kubectl get pods,svc
NAME                                     READY   STATUS    RESTARTS   AGE
pod/jupyter-k8s-udemy-79f7dd7ffc-84nch   1/1     Running   0          1h

NAME                        TYPE        CLUSTER-IP     EXTERNAL-IP   PORT(S)          AGE
service/jupyter-k8s-udemy   NodePort    100.64.248.5   <none>        8888:30040/TCP   1h
service/kubernetes          ClusterIP   100.64.0.1     <none>        443/TCP          5h
root@ubuntu-s-1vcpu-2gb-lon1-01:~/kops_cluster# kubectl delete pod/jupyter-k8s-udemy-79f7dd7ffc-84nch
pod "jupyter-k8s-udemy-79f7dd7ffc-84nch" deleted
root@ubuntu-s-1vcpu-2gb-lon1-01:~/kops_cluster# kubectl get pods,svc
NAME                                     READY   STATUS              RESTARTS   AGE
pod/jupyter-k8s-udemy-79f7dd7ffc-kfzb7   0/1     ContainerCreating   0          6s

NAME                        TYPE        CLUSTER-IP     EXTERNAL-IP   PORT(S)          AGE
service/jupyter-k8s-udemy   NodePort    100.64.248.5   <none>        8888:30040/TCP   1h
service/kubernetes          ClusterIP   100.64.0.1     <none>        443/TCP          5h
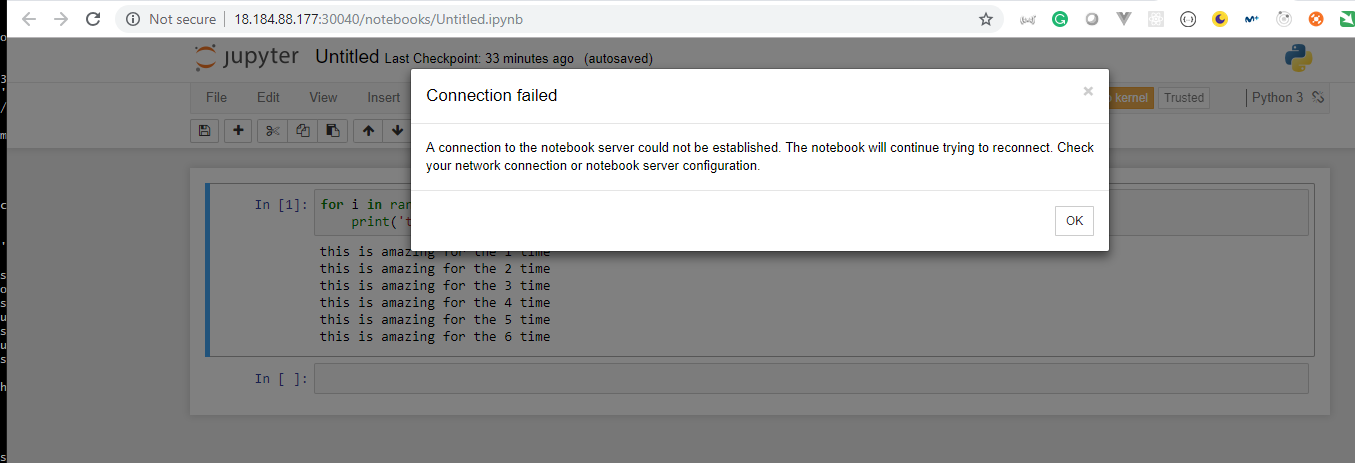
root@ubuntu-s-1vcpu-2gb-lon1-01:~/kops_cluster# kubectl get pods,svc
NAME                                     READY   STATUS    RESTARTS   AGE
pod/jupyter-k8s-udemy-79f7dd7ffc-kfzb7   1/1     Running   0          2m

NAME                        TYPE        CLUSTER-IP     EXTERNAL-IP   PORT(S)          AGE
service/jupyter-k8s-udemy   NodePort    100.64.248.5   <none>        8888:30040/TCP   1h
service/kubernetes          ClusterIP   100.64.0.1     <none>        443/TCP          5h

Section: 3. Introduction to Helm Charts
25. Materials: Install HELM binary and activate HELM user account in your cluster
Install HELM binary to your PC/server
HELM_TAR_FILE=helm-v2.9.1-linux-amd64.tar.gz
HELM_URL=https://storage.googleapis.com/kubernetes-helm
HELM_BIN=helm

function install_helm {

    if [ -z $(which $HELM_BIN) ]
       then
           wget ${HELM_URL}/${HELM_TAR_FILE}
           tar -xvzf ${HELM_TAR_FILE}
           chmod +x linux-amd64/${HELM_BIN}
           sudo cp linux-amd64/${HELM_BIN} /usr/local/bin/${HELM_BIN}
           rm -rf ${HELM_TAR_FILE} linux-amd64
           echo -e "\nwhich ${HELM_BIN}"
           which ${HELM_BIN}
    else
       echo "Helm is most likely installed"
    fi

}
Setup tiller user account in your Kubernetes cluster in AWS
kubectl create serviceaccount --namespace kube-system tiller
kubectl create clusterrolebinding tiller-cluster-rule --clusterrole=cluster-admin --serviceaccount=kube-system:tiller
# kubectl patch deploy --namespace kube-system tiller-deploy -p '{"spec":{"template":{"spec":{"serviceAccount":"tiller"}}}}'
helm init --service-account tiller --upgrade
You can learn more about HELM at this web page
26. Introduction to Helm charts
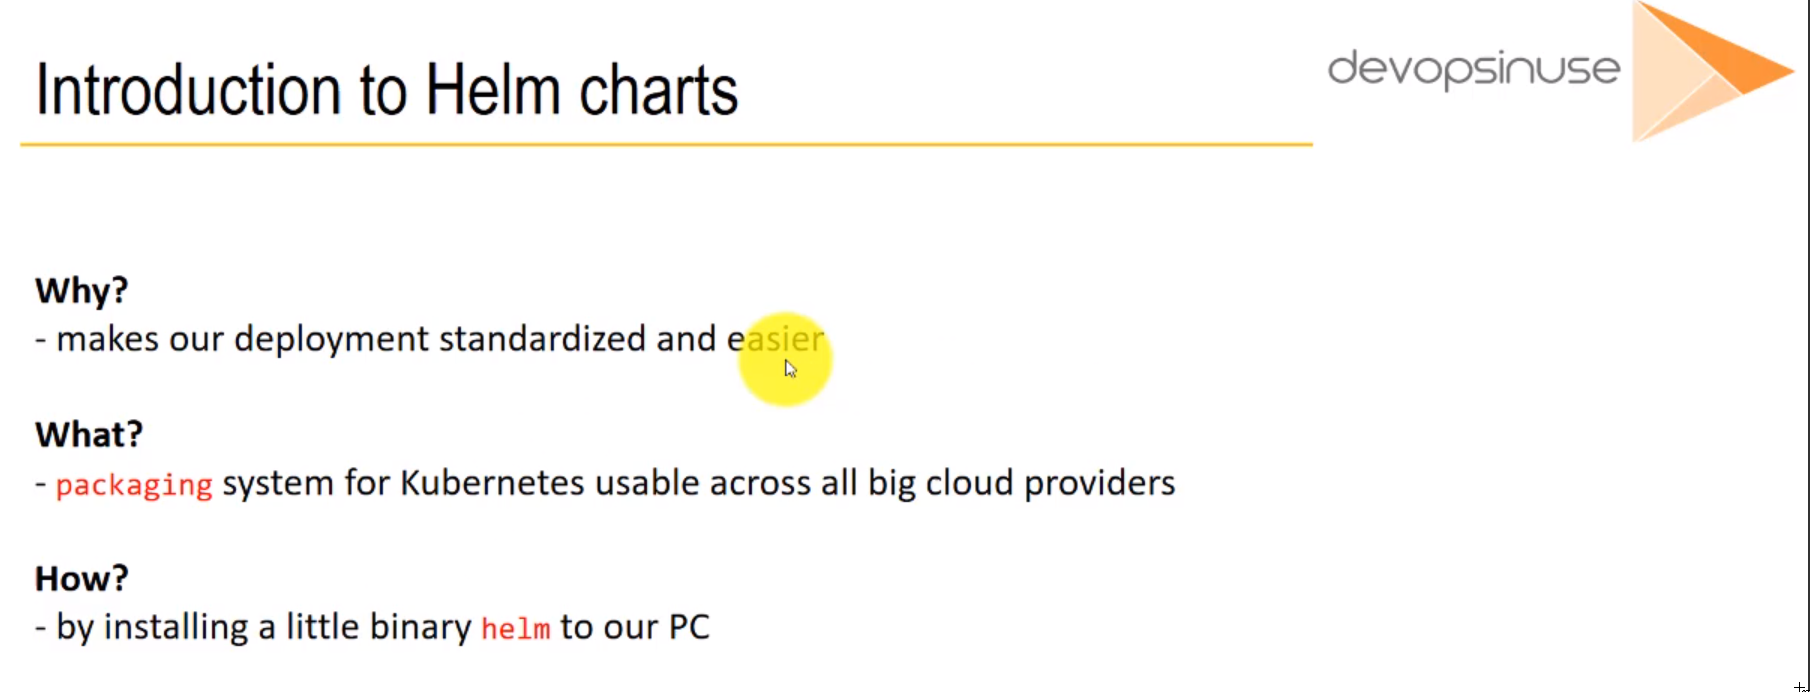
- We can get more information about
installingon https://helm.sh/docs/using_helm/#installing-helm
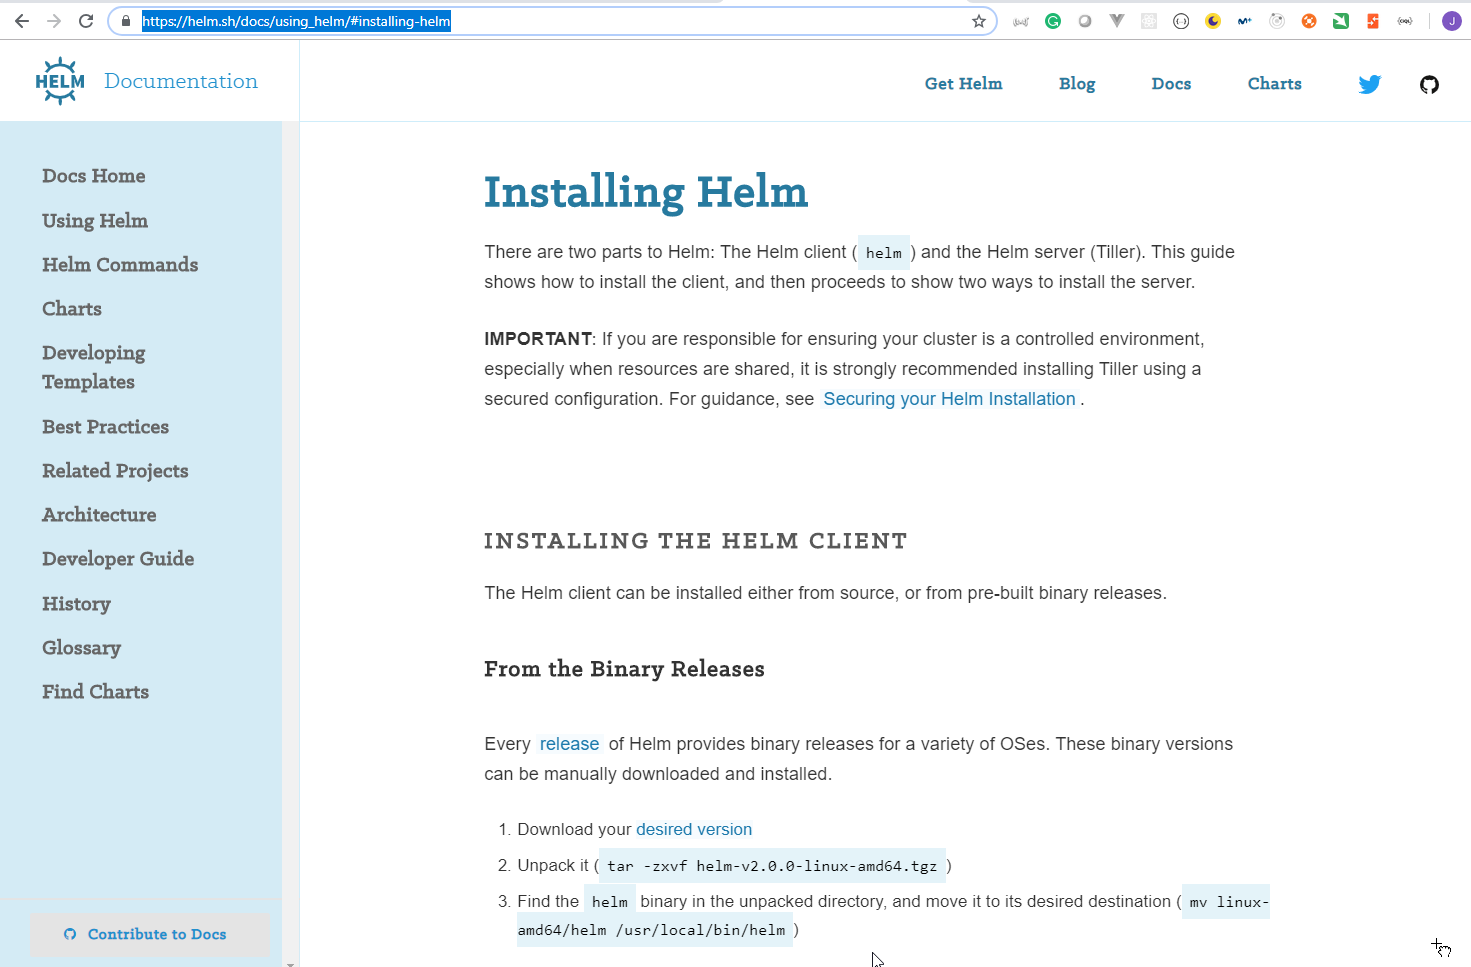
- Copy and paste the following commands:
root@ubuntu-s-1vcpu-2gb-lon1-01:~# HELM_TAR_FILE=helm-v2.9.1-linux-amd64.tar.gz
root@ubuntu-s-1vcpu-2gb-lon1-01:~# HELM_URL=https://storage.googleapis.com/kubernetes-helm
root@ubuntu-s-1vcpu-2gb-lon1-01:~# HELM_BIN=helm
root@ubuntu-s-1vcpu-2gb-lon1-01:~#
root@ubuntu-s-1vcpu-2gb-lon1-01:~# function install_helm {
>
>     if [ -z $(which $HELM_BIN) ]
>        then
>            wget ${HELM_URL}/${HELM_TAR_FILE}
>            tar -xvzf ${HELM_TAR_FILE}
>            chmod +x linux-amd64/${HELM_BIN}
>            sudo cp linux-amd64/${HELM_BIN} /usr/local/bin/${HELM_BIN}
>            rm -rf ${HELM_TAR_FILE} linux-amd64
>            echo -e "\nwhich ${HELM_BIN}"
>            which ${HELM_BIN}
>     else
>        echo "Helm is most likely installed"
>     fi
>
> }
- Execute the
install_helmfunction.
root@ubuntu-s-1vcpu-2gb-lon1-01:~# install_helm
--2019-03-10 05:26:43--  https://storage.googleapis.com/kubernetes-helm/helm-v2.9.1-linux-amd64.tar.gz
Resolving storage.googleapis.com (storage.googleapis.com)... 216.58.206.80, 2a00:1450:4009:802::2010
Connecting to storage.googleapis.com (storage.googleapis.com)|216.58.206.80|:443... connected.
HTTP request sent, awaiting response... 200 OK
Length: 9160761 (8.7M) [application/x-tar]
Saving to: ‘helm-v2.9.1-linux-amd64.tar.gz’

helm-v2.9.1-linux-amd64.tar.gz                                      100%[==================================================================================================================================================================>]   8.74M  29.4MB/s    in 0.3s

2019-03-10 05:26:44 (29.4 MB/s) - ‘helm-v2.9.1-linux-amd64.tar.gz’ saved [9160761/9160761]

linux-amd64/
linux-amd64/README.md
linux-amd64/helm
linux-amd64/LICENSE

which helm
/usr/local/bin/helm
- Ensure it is working
root@ubuntu-s-1vcpu-2gb-lon1-01:~# helm
The Kubernetes package manager

To begin working with Helm, run the 'helm init' command:

        $ helm init

This will install Tiller to your running Kubernetes cluster.
It will also set up any necessary local configuration.

Common actions from this point include:

- helm search:    search for charts
- helm fetch:     download a chart to your local directory to view
- helm install:   upload the chart to Kubernetes
- helm list:      list releases of charts

Environment:
  $HELM_HOME          set an alternative location for Helm files. By default, these are stored in ~/.helm
  $HELM_HOST          set an alternative Tiller host. The format is host:port
  $HELM_NO_PLUGINS    disable plugins. Set HELM_NO_PLUGINS=1 to disable plugins.
  $TILLER_NAMESPACE   set an alternative Tiller namespace (default "kube-system")
  $KUBECONFIG         set an alternative Kubernetes configuration file (default "~/.kube/config")

Usage:
  helm [command]

Available Commands:
  completion  Generate autocompletions script for the specified shell (bash or zsh)
  create      create a new chart with the given name
  delete      given a release name, delete the release from Kubernetes
  dependency  manage a chart's dependencies
  fetch       download a chart from a repository and (optionally) unpack it in local directory
  get         download a named release
  history     fetch release history
  home        displays the location of HELM_HOME
  init        initialize Helm on both client and server
  inspect     inspect a chart
  install     install a chart archive
  lint        examines a chart for possible issues
  list        list releases
  package     package a chart directory into a chart archive
  plugin      add, list, or remove Helm plugins
  repo        add, list, remove, update, and index chart repositories
  reset       uninstalls Tiller from a cluster
  rollback    roll back a release to a previous revision
  search      search for a keyword in charts
  serve       start a local http web server
  status      displays the status of the named release
  template    locally render templates
  test        test a release
  upgrade     upgrade a release
  verify      verify that a chart at the given path has been signed and is valid
  version     print the client/server version information

Flags:
      --debug                           enable verbose output
  -h, --help                            help for helm
      --home string                     location of your Helm config. Overrides $HELM_HOME (default "/root/.helm")
      --host string                     address of Tiller. Overrides $HELM_HOST
      --kube-context string             name of the kubeconfig context to use
      --tiller-connection-timeout int   the duration (in seconds) Helm will wait to establish a connection to tiller (default 300)
      --tiller-namespace string         namespace of Tiller (default "kube-system")

Use "helm [command] --help" for more information about a command.
root@ubuntu-s-1vcpu-2gb-lon1-01:~#
Install Heml on Windows using Chocolately
Microsoft Windows [Version 10.0.17763.195]
(c) 2018 Microsoft Corporation. All rights reserved.

C:\Windows\system32>choco install kubernetes-helm
Chocolatey v0.10.11
Installing the following packages:
kubernetes-helm
By installing you accept licenses for the packages.
Progress: Downloading kubernetes-helm 2.13.0... 100%

kubernetes-helm v2.13.0 [Approved]
kubernetes-helm package files install completed. Performing other installation steps.
The package kubernetes-helm wants to run 'chocolateyInstall.ps1'.
Note: If you don't run this script, the installation will fail.
Note: To confirm automatically next time, use '-y' or consider:
choco feature enable -n allowGlobalConfirmation
Do you want to run the script?([Y]es/[N]o/[P]rint): y

Downloading kubernetes-helm 64 bit
  from 'https://storage.googleapis.com/kubernetes-helm/helm-v2.13.0-windows-amd64.zip'
Progress: 100% - Completed download of C:\Users\juan.pablo.perez\AppData\Local\Temp\chocolatey\kubernetes-helm\2.13.0\helm-v2.13.0-windows-amd64.zip (21.92 MB).
Download of helm-v2.13.0-windows-amd64.zip (21.92 MB) completed.
Hashes match.
Extracting C:\Users\juan.pablo.perez\AppData\Local\Temp\chocolatey\kubernetes-helm\2.13.0\helm-v2.13.0-windows-amd64.zip to C:\ProgramData\chocolatey\lib\kubernetes-helm\tools...
C:\ProgramData\chocolatey\lib\kubernetes-helm\tools
 ShimGen has successfully created a shim for helm.exe
 ShimGen has successfully created a shim for tiller.exe
 The install of kubernetes-helm was successful.
  Software installed to 'C:\ProgramData\chocolatey\lib\kubernetes-helm\tools'

Chocolatey installed 1/1 packages.
 See the log for details (C:\ProgramData\chocolatey\logs\chocolatey.log).

C:\Windows\system32>
- Ensure it is working
C:\Windows\system32>helm
The Kubernetes package manager

To begin working with Helm, run the 'helm init' command:

        $ helm init

This will install Tiller to your running Kubernetes cluster.
It will also set up any necessary local configuration.

Common actions from this point include:

- helm search:    search for charts
- helm fetch:     download a chart to your local directory to view
- helm install:   upload the chart to Kubernetes
- helm list:      list releases of charts

Environment:
  $HELM_HOME           set an alternative location for Helm files. By default, these are stored in ~/.helm
  $HELM_HOST           set an alternative Tiller host. The format is host:port
  $HELM_NO_PLUGINS     disable plugins. Set HELM_NO_PLUGINS=1 to disable plugins.
  $TILLER_NAMESPACE    set an alternative Tiller namespace (default "kube-system")
  $KUBECONFIG          set an alternative Kubernetes configuration file (default "~/.kube/config")
  $HELM_TLS_CA_CERT    path to TLS CA certificate used to verify the Helm client and Tiller server certificates (default "$HELM_HOME/ca.pem")
  $HELM_TLS_CERT       path to TLS client certificate file for authenticating to Tiller (default "$HELM_HOME/cert.pem")
  $HELM_TLS_KEY        path to TLS client key file for authenticating to Tiller (default "$HELM_HOME/key.pem")
  $HELM_TLS_ENABLE     enable TLS connection between Helm and Tiller (default "false")
  $HELM_TLS_VERIFY     enable TLS connection between Helm and Tiller and verify Tiller server certificate (default "false")
  $HELM_TLS_HOSTNAME   the hostname or IP address used to verify the Tiller server certificate (default "127.0.0.1")
  $HELM_KEY_PASSPHRASE set HELM_KEY_PASSPHRASE to the passphrase of your PGP private key. If set, you will not be prompted for
                       the passphrase while signing helm charts

Usage:
  helm [command]

Available Commands:
  completion  Generate autocompletions script for the specified shell (bash or zsh)
  create      create a new chart with the given name
  delete      given a release name, delete the release from Kubernetes
  dependency  manage a chart's dependencies
  fetch       download a chart from a repository and (optionally) unpack it in local directory
  get         download a named release
  help        Help about any command
  history     fetch release history
  home        displays the location of HELM_HOME
  init        initialize Helm on both client and server
  inspect     inspect a chart
  install     install a chart archive
  lint        examines a chart for possible issues
  list        list releases
  package     package a chart directory into a chart archive
  plugin      add, list, or remove Helm plugins
  repo        add, list, remove, update, and index chart repositories
  reset       uninstalls Tiller from a cluster
  rollback    roll back a release to a previous revision
  search      search for a keyword in charts
  serve       start a local http web server
  status      displays the status of the named release
  template    locally render templates
  test        test a release
  upgrade     upgrade a release
  verify      verify that a chart at the given path has been signed and is valid
  version     print the client/server version information

Flags:
      --debug                           enable verbose output
  -h, --help                            help for helm
      --home string                     location of your Helm config. Overrides $HELM_HOME (default "C:\\Users\\juan.pablo.perez\\.helm")
      --host string                     address of Tiller. Overrides $HELM_HOST
      --kube-context string             name of the kubeconfig context to use
      --kubeconfig string               absolute path to the kubeconfig file to use
      --tiller-connection-timeout int   the duration (in seconds) Helm will wait to establish a connection to tiller (default 300)
      --tiller-namespace string         namespace of Tiller (default "kube-system")

Use "helm [command] --help" for more information about a command.

C:\Windows\system32
Install helm in the kubernetis cluster
- Ensure the cluster is running by executing this command:
root@ubuntu-s-1vcpu-2gb-lon1-01:~# kubectl get pods -n kube-system
NAME                                                                     READY   STATUS    RESTARTS   AGE
dns-controller-5875f77c46-psn65                                          1/1     Running   0          23h
etcd-server-events-ip-172-20-45-184.eu-central-1.compute.internal        1/1     Running   0          23h
etcd-server-ip-172-20-45-184.eu-central-1.compute.internal               1/1     Running   0          23h
kube-apiserver-ip-172-20-45-184.eu-central-1.compute.internal            1/1     Running   0          23h
kube-controller-manager-ip-172-20-45-184.eu-central-1.compute.internal   1/1     Running   0          23h
kube-dns-5fbcb4d67b-77r68                                                3/3     Running   0          23h
kube-dns-5fbcb4d67b-tqbx2                                                3/3     Running   0          23h
kube-dns-autoscaler-6874c546dd-79tls                                     1/1     Running   0          23h
kube-proxy-ip-172-20-45-184.eu-central-1.compute.internal                1/1     Running   0          23h
kube-proxy-ip-172-20-50-246.eu-central-1.compute.internal                1/1     Running   0          23h
kube-proxy-ip-172-20-56-4.eu-central-1.compute.internal                  1/1     Running   0          23h
kube-scheduler-ip-172-20-45-184.eu-central-1.compute.internal            1/1     Running   0          23h
As we can see,
tiller, thehelm server, is not installed in thekubernetis cluster. We need to install it before we are able to deploying anything withhelm.Before executing
helm initwe need to do some previous steps
- Create the service account for tiller.
root@ubuntu-s-1vcpu-2gb-lon1-01:~# kubectl create serviceaccount --namespace kube-system tiller
serviceaccount/tiller created
root@ubuntu-s-1vcpu-2gb-lon1-01:~#
- We need to assign the
tillerservice account as master in our kubernetes cluster
root@ubuntu-s-1vcpu-2gb-lon1-01:~# kubectl create clusterrolebinding tiller-cluster-rule --clusterrole=cluster-admin --serviceaccount=kube-system:tiller
clusterrolebinding.rbac.authorization.k8s.io/tiller-cluster-rule created
- Run the
helm initcommand with the following parameters
root@ubuntu-s-1vcpu-2gb-lon1-01:~# helm init --service-account tiller --upgrade
Creating /root/.helm
Creating /root/.helm/repository
Creating /root/.helm/repository/cache
Creating /root/.helm/repository/local
Creating /root/.helm/plugins
Creating /root/.helm/starters
Creating /root/.helm/cache/archive
Creating /root/.helm/repository/repositories.yaml
Adding stable repo with URL: https://kubernetes-charts.storage.googleapis.com
Adding local repo with URL: http://127.0.0.1:8879/charts
$HELM_HOME has been configured at /root/.helm.

Tiller (the Helm server-side component) has been installed into your Kubernetes Cluster.

Please note: by default, Tiller is deployed with an insecure 'allow unauthenticated users' policy.
For more information on securing your installation see: https://docs.helm.sh/using_helm/#securing-your-helm-installation
Happy Helming!
- Ensure the
tillerpod is running in thekube-systemby executing:
root@ubuntu-s-1vcpu-2gb-lon1-01:~# kubectl get pods -n kube-system | grep tiller --color
tiller-deploy-5c688d5f9b-tbqzh                                           1/1     Running   0          2m

- Get all the
system podsby executing the following command:
root@ubuntu-s-1vcpu-2gb-lon1-01:~# kubectl get pods -n kube-system
NAME                                                                     READY   STATUS    RESTARTS   AGE
dns-controller-5875f77c46-psn65                                          1/1     Running   0          23h
etcd-server-events-ip-172-20-45-184.eu-central-1.compute.internal        1/1     Running   0          23h
etcd-server-ip-172-20-45-184.eu-central-1.compute.internal               1/1     Running   0          23h
kube-apiserver-ip-172-20-45-184.eu-central-1.compute.internal            1/1     Running   0          23h
kube-controller-manager-ip-172-20-45-184.eu-central-1.compute.internal   1/1     Running   0          23h
kube-dns-5fbcb4d67b-77r68                                                3/3     Running   0          23h
kube-dns-5fbcb4d67b-tqbx2                                                3/3     Running   0          23h
kube-dns-autoscaler-6874c546dd-79tls                                     1/1     Running   0          23h
kube-proxy-ip-172-20-45-184.eu-central-1.compute.internal                1/1     Running   0          23h
kube-proxy-ip-172-20-50-246.eu-central-1.compute.internal                1/1     Running   0          23h
kube-proxy-ip-172-20-56-4.eu-central-1.compute.internal                  1/1     Running   0          23h
kube-scheduler-ip-172-20-45-184.eu-central-1.compute.internal            1/1     Running   0          23h
tiller-deploy-5c688d5f9b-tbqzh                                           1/1     Running   0          3m
- We can use
helm listto see what the currenthelmdeployments are:
root@ubuntu-s-1vcpu-2gb-lon1-01:~# helm list
root@ubuntu-s-1vcpu-2gb-lon1-01:~#
- We can also use
helm list -ato get more information
root@ubuntu-s-1vcpu-2gb-lon1-01:~# helm list -a
root@ubuntu-s-1vcpu-2gb-lon1-01:~#
27. Materials: Run GOGS helm deployment for the first time
Run GOGS helm deployment for the first time
# helm repo add incubator https://kubernetes-charts-incubator.storage.googleapis.com/
helm install --name <some_name> --values <values_you_edited>.yaml incubator/gogs
Check on your deployment:
helm list -a
28. How to use Helm for the first time
Helm is a packaging system for kubernetes
- Goto to the Helm Charts Github Repository
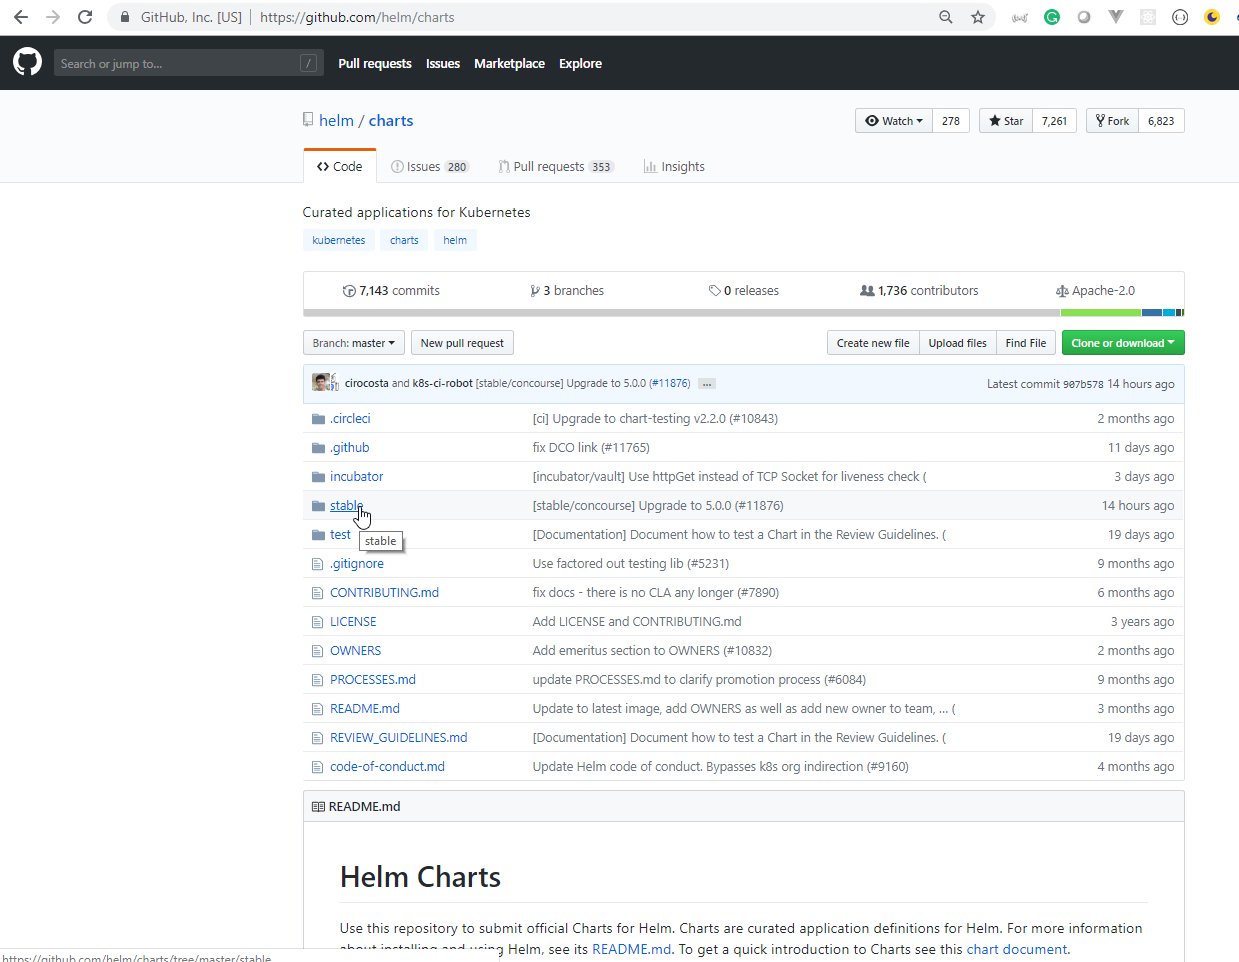
Incubatoris still under devevoliping andstableare thechartswhat can be safely used.

- If we want to install the
consulchart we should usehelm install stable/consul
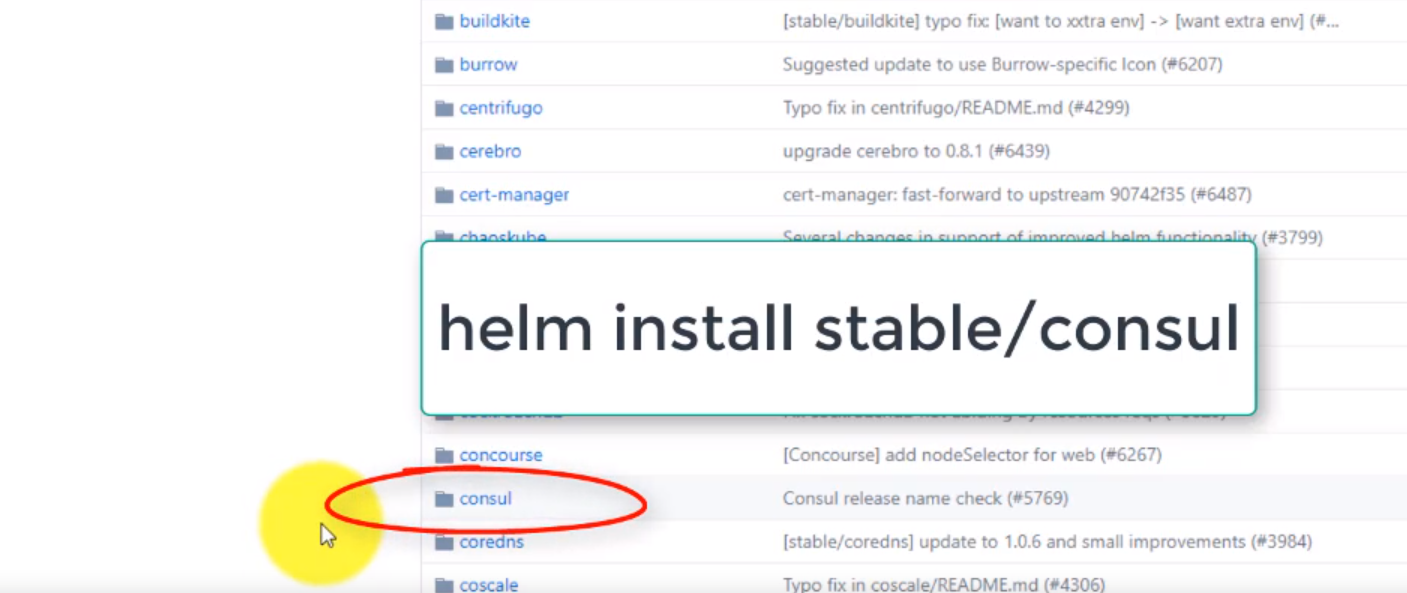
- We are going to install the
gogs, basically like your personalgithub, unstablehelm chart. We can see it going to theincubatorfolder.
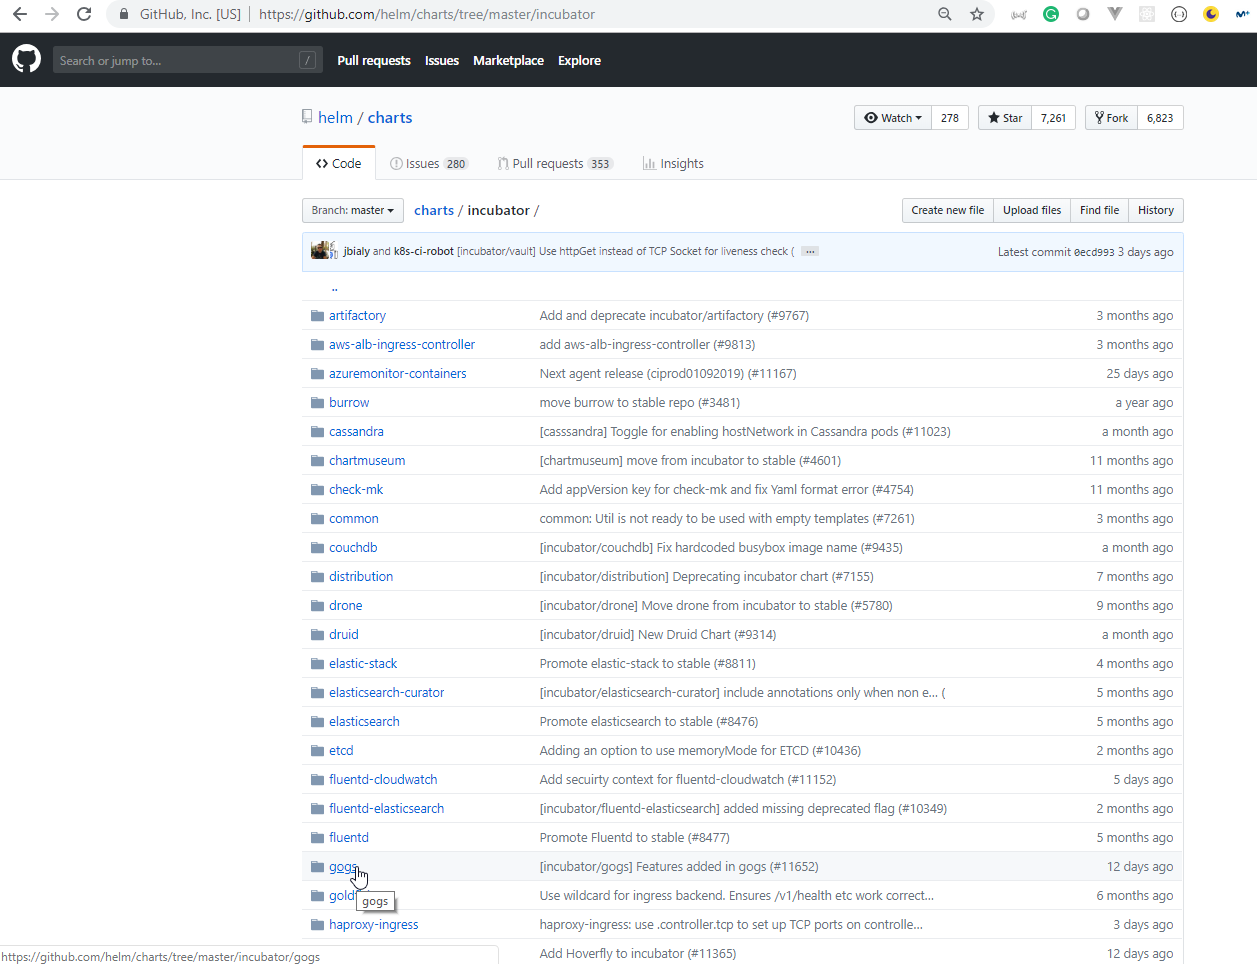
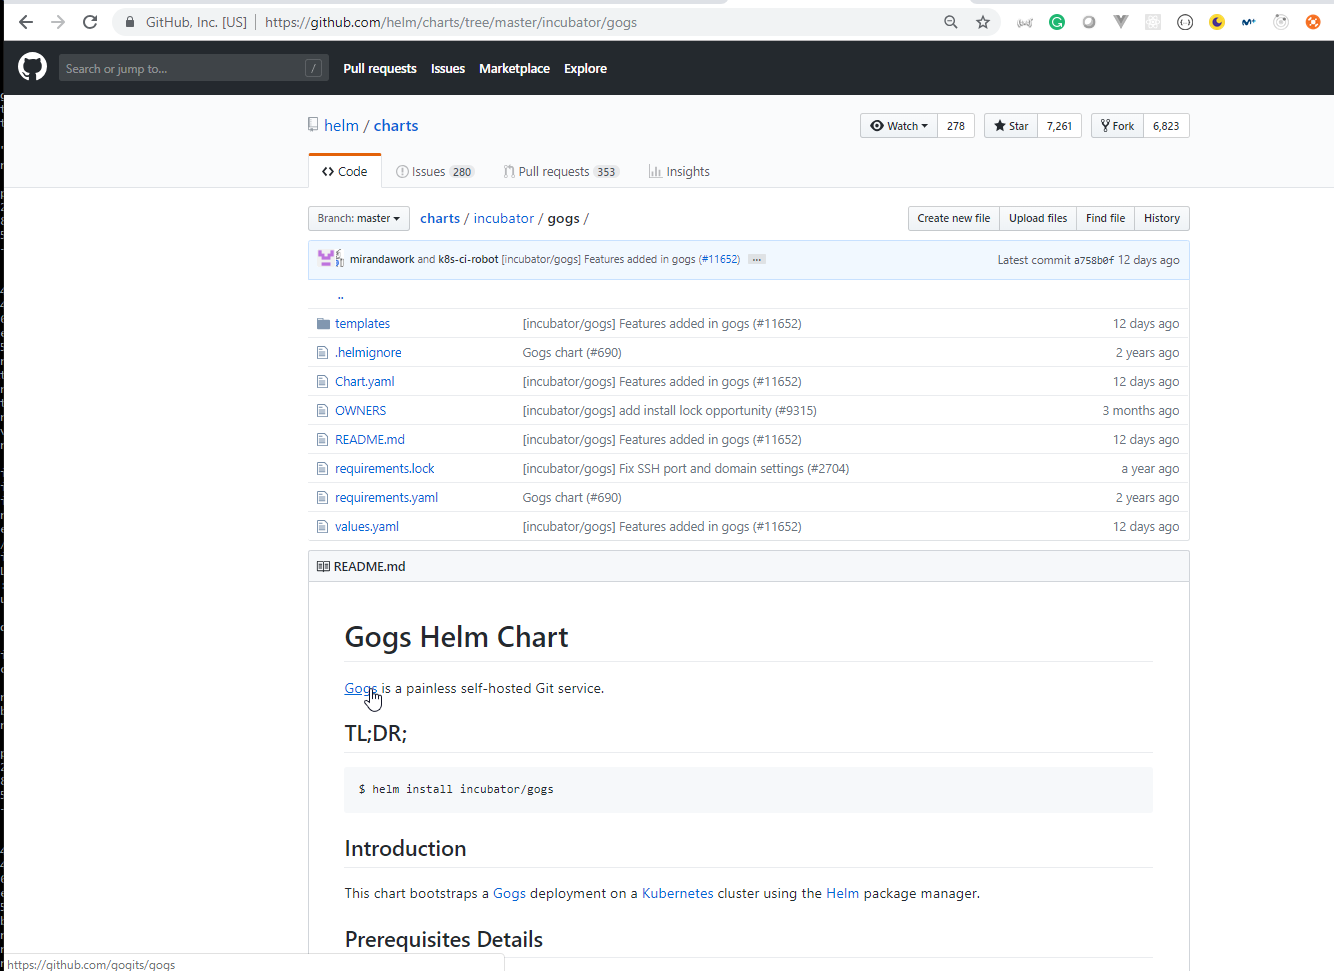
- We can get more information from Gogs - A painless self-hosted Git service
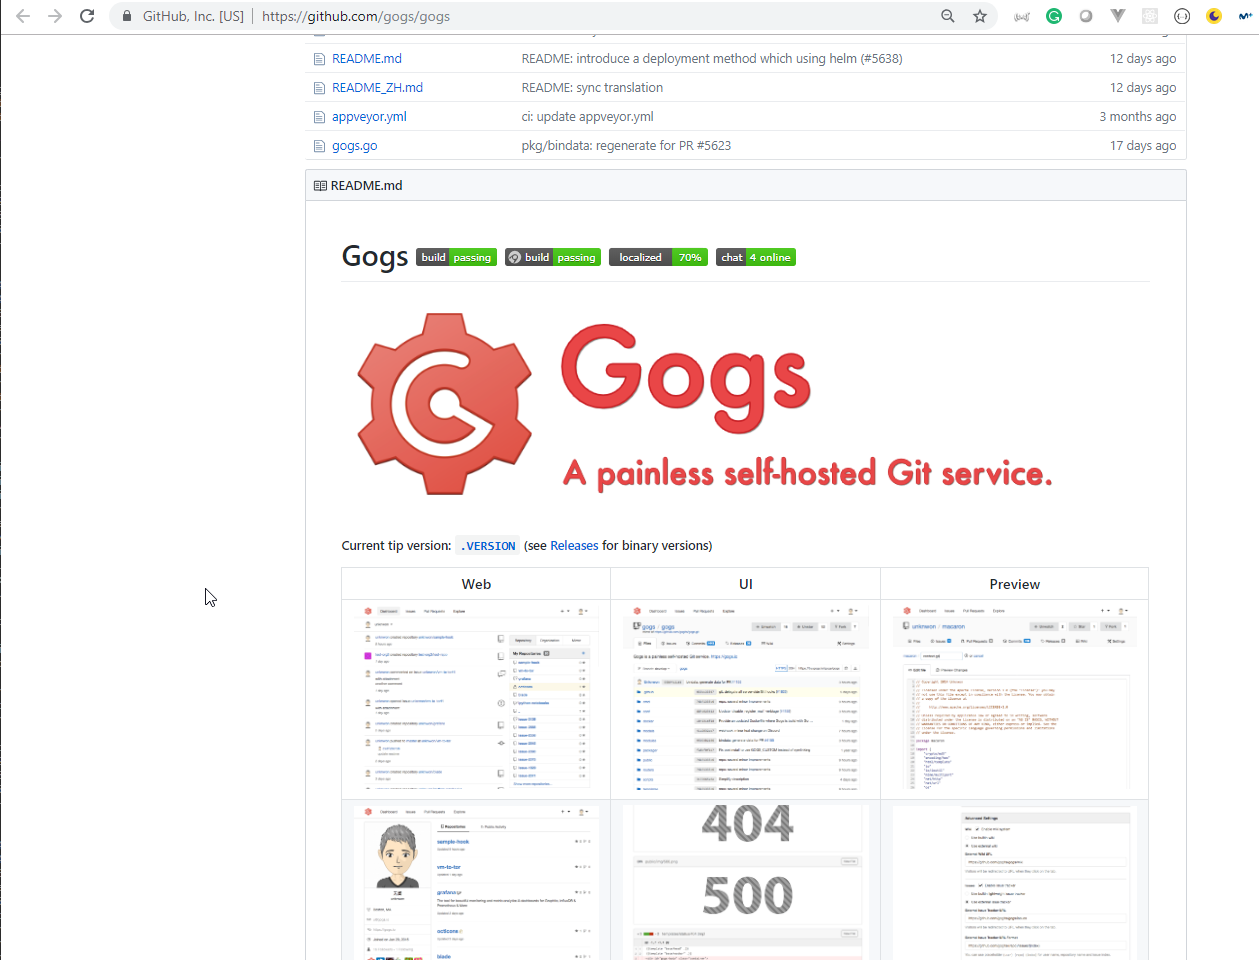
- All the
helm chartshave the same structure, atemplatefolder, aChart.yaml, arequirements.yamland avalue.yamldocuments.
Chart.yaml
apiVersion: v1
description: "Gogs: Go Git Service"
name: gogs
version: 0.7.7
appVersion: 0.11.86
home: https://gogs.io/
icon: https://gogs.io/img/favicon.ico
maintainers:
  - name: obeyler
keywords:
  - git
requirements.yaml
dependencies:
  - name: postgresql
    version: 0.6.0
    repository: https://kubernetes-charts.storage.googleapis.com/
    condition: postgresql.install
values.yaml
## Override the name of the Chart.
##
# nameOverride:

## Kubernetes configuration
## For minikube, set this to NodePort, elsewhere use LoadBalancer
##
serviceType: NodePort

replicaCount: 1

image:
  repository: gogs/gogs
  tag: 0.11.86
  pullPolicy: IfNotPresent

service:
  ## Override the components name (defaults to service).
  ##
  # nameOverride:

  ## HTTP listen port.
  ## ref: https://gogs.io/docs/advanced/configuration_cheat_sheet
  ##
  httpPort: 80

  ## HTTP listen port on Kubernetes node.
  ## ref: https://gogs.io/docs/advanced/configuration_cheat_sheet
  ##
  httpNodePort:

  ## SSH listen port.
  ##
  sshPort: 22

  ## SSH listen port on Kubernetes node.
  ##
  sshNodePort:

  ## SSH_DOMAIN - Domain name to be exposed in SSH clone URL.
  ## ref: https://gogs.io/docs/advanced/configuration_cheat_sheet
  ##
  sshDomain: localhost

  ## Gogs configuration values
  ## ref: https://gogs.io/docs/advanced/configuration_cheat_sheet
  ##
  gogs:
    ## Application name, can be your company or team name.
    ##
    appName: "Gogs"

    ## Either "dev", "prod" or "test".
    ##
    runMode: "prod"

    ## Force every new repository to be private.
    ##
    forcePrivate: false

    ## Indicates whether or not to disable Git clone through HTTP/HTTPS. When
    ## disabled, users can only perform Git operations via SSH.
    ##
    disableHttpGit: false

    ## Lock the path /install to configure gogs
    ##
    installLock: true

    ## Indicates whether or not to enable repository file upload feature.
    ##
    repositoryUploadEnabled: true

    ## File types that are allowed to be uploaded, e.g. image/jpeg|image/png.
    ## Leave empty means allow any file typ
    ##
    repositoryUploadAllowedTypes:

    ## Maximum size of each file in MB.
    ##
    repositoryUploadMaxFileSize: 3

    ## Maximum number of files per upload.
    ##
    repositoryUploadMaxFiles: 5

    ## Enable this to use captcha validation for registration.
    ##
    serviceEnableCaptcha: true

    ## Users need to confirm e-mail for registration
    ##
    serviceRegisterEmailConfirm: false

    ## Weather or not to allow users to register.
    ##
    serviceDisableRegistration: false

    ## Weather or not sign in is required to view anything.
    ##
    serviceRequireSignInView: false

    ## Mail notification
    ##
    serviceEnableNotifyMail: false

    ## Enable this to send mail with SMTP server.
    ##
    mailerEnabled: false

    ## SMTP server host.
    ##
    mailerHost:

    ## SMTP server user.
    ##
    mailerUser:

    ## SMTP server password.
    ##
    mailerPasswd:

    ## Mail from address. Format RFC 5322, email@example.com, or "Name" <email@example.com>
    ##
    mailerFrom:

    ## Prefix prepended mail subject.
    ##
    mailerSubjectPrefix:

    ## Do not verify the self-signed certificates.
    ##
    mailerSkipVerify: false

    ## Either "memory", "redis", or "memcache", default is "memory"
    ##
    cacheAdapter: memory

    ## For "memory" only, GC interval in seconds, default is 60
    ##
    cacheInterval: 60

    ## For "redis" and "memcache", connection host address
    ## redis: network=tcp,addr=:6379,password=macaron,db=0,pool_size=100,idle_timeout=180
    ## memcache: `127.0.0.1:11211`
    ##
    cacheHost:

    ## Enable this to use captcha validation for registration.
    ##
    serverDomain: gogs.example.com

    ## Full public URL of Gogs server.
    ##
    serverRootUrl: http://gogs.example.com/

    ## Landing page for non-logged users, can be "home" or "explore"
    ##
    serverLandingPage: home

    ## Either "mysql", "postgres" or "sqlite3", you can connect to TiDB with
    ## MySQL protocol.  Default is to use the postgresql configuration included
    ## with this chart.
    ##
    databaseType: postgres

    ## Database host.  Unused unless `postgresql.install` is false.
    ##
    databaseHost:

    ## Database user.  Unused unless `postgresql.install` is false.
    ##
    databaseUser:

    ## Database password.  Unused unless `postgresql.install` is false.
    ##
    databasePassword:

    ## Database password.  Unused unless `postgresql.install` is false.
    ##
    databaseName:

    ## Hook task queue length, increase if webhook shooting starts hanging
    ##
    webhookQueueLength: 1000

    ## Deliver timeout in seconds
    ##
    webhookDeliverTimeout: 5

    ## Allow insecure certification
    ##
    webhookSkipTlsVerify: true

    ## Number of history information in each page
    ##
    webhookPagingNum: 10

    ## Can be "console" and "file", default is "console"
    ## Use comma to separate multiple modes, e.g. "console, file"
    ##
    logMode: console

    ## Either "Trace", "Info", "Warn", "Error", "Fatal", default is "Trace"
    ##
    logLevel: Trace

    ## Undocumented, but you can take a guess.
    ##
    otherShowFooterBranding: false

    ## Show version information about Gogs and Go in the footer
    ##
    otherShowFooterVersion: true

    ## Show time of template execution in the footer
    ##
    otherShowFooterTemplateLoadTime: true

    ## Change this value for your installation.
    ##
    securitySecretKey: "changeme"

    ## Number of repositories that are showed in one explore page
    ##
    uiExplorePagingNum: 20

    ## Number of issues that are showed in one page
    ##
    uiIssuePagingNum: 10

    ## Number of maximum commits showed in one activity feed.
    ## NOTE: This value is also used in how many commits a webhook will send.
    ##
    uiFeedMaxCommitNum: 5

    ## Enable running cron tasks periodically.
    ##
    cronEnabled: true

    ## Run cron tasks when Gogs starts.
    ##
    cronRunAtStart: false

    ## Cron syntax for scheduling update mirrors, e.g. @every 1h.
    ##
    cronUpdateMirrorsSchedule: "@every 10m"

    ## Cron syntax for scheduling repository health check, e.g. @every 24h.
    ##
    cronRepoHealthCheckSchedule: "@every 24h"

    ## Time duration syntax for health check execution timeout, e.g. 60s.
    ##
    cronRepoHealthCheckTimeout: 60s

    ## Arguments for command git fsck, e.g. --unreachable --tags.
    ##
    cronRepoHealthCheckArgs:

    ## Enable this to run repository statistics check at start time.
    ##
    cronCheckRepoStatsRunAtStart: true

    ## Cron syntax for scheduling repository statistics check, e.g. @every 24h.
    ##
    cronCheckRepoStatsSchedule: "@every 24h"

    ## Enable this to run repository archives cleanup at start time.
    ##
    cronRepoArchiveCleanupRunAtStart: false

    ## Cron syntax for scheduling repository statistics check, e.g. @every 24h.
    ##
    cronRepoArchiveCleanupSchedule: "@every 24h"

    ## Time duration to check if archive should be cleaned, e.g. 24h
    ##
    cronRepoArchiveCleanupOlderThan: 24h

  ## Ingress configuration.
  ## ref: https://kubernetes.io/docs/user-guide/ingress/
  ##
  ingress:
    ## Enable Ingress.
    ##
    enabled: false

    ## Annotations.
    ##
    # annotations:
    #   kubernetes.io/ingress.class: nginx
    #   kubernetes.io/tls-acme: 'true'
    ## Hostnames.
    ## Must be provided if Ingress is enabled.
    ##
    # hosts:
    #   - gogs.domain.com
    ## TLS configuration.
    ## Secrets must be manually created in the namespace.
    ##
    # tls:
    #   - secretName: gogs-tls
    #     hosts:
    #       - gogs.domain.com

  ## Service annotations.
  ## Allows attaching metadata to services for kubernetes components to act on.
  ##
  # annotations:
  #   service.beta.kubernetes.io/aws-load-balancer-backend-protocol: http

## Persistent Volume Storage configuration.
## ref: https://kubernetes.io/docs/user-guide/persistent-volumes
##
persistence:
  ## Enable persistence using Persistent Volume Claims.
  ##
  enabled: true

  ## If defined, PVC must be created manually before volume will be bound
  ##
  # existingClaim: "-"

  ## gogs data Persistent Volume Storage Class
  ## If defined, storageClassName: <storageClass>
  ## If set to "-", storageClassName: "", which disables dynamic provisioning
  ## If undefined (the default) or set to null, no storageClassName spec is
  ##   set, choosing the default provisioner.  (gp2 on AWS, standard on
  ##   GKE, AWS & OpenStack)
  ##
  # storageClass: "-"

  ## Persistent Volume Access Mode.
  ##
  accessMode: ReadWriteOnce

  ## Persistent Volume Storage Size.
  ##
  size: 1Gi

## Configuration values for the postgresql dependency.
## ref: https://github.com/kubernetes/charts/blob/master/stable/postgresql/README.md
##
postgresql:
  ### Install PostgreSQL dependency
  ##
  install: true

  ### PostgreSQL User to create.
  ##
  postgresUser: gogs

  ## PostgreSQL Password for the new user.
  ## If not set, a random 10 characters password will be used.
  ##
  postgresPassword: gogs

  ## PostgreSQL Database to create.
  ##
  postgresDatabase: gogs

  ## Persistent Volume Storage configuration.
  ## ref: https://kubernetes.io/docs/user-guide/persistent-volumes
  ##
  persistence:
    ## Enable PostgreSQL persistence using Persistent Volume Claims.
    ##
    enabled: true

## Security context
securityContext: {}

## Node, affinity and tolerations labels for pod assignment
nodeSelector: {}
affinity: {}
tolerations: []
- We are going to
clonethekubernetes chartsrepository in out server.
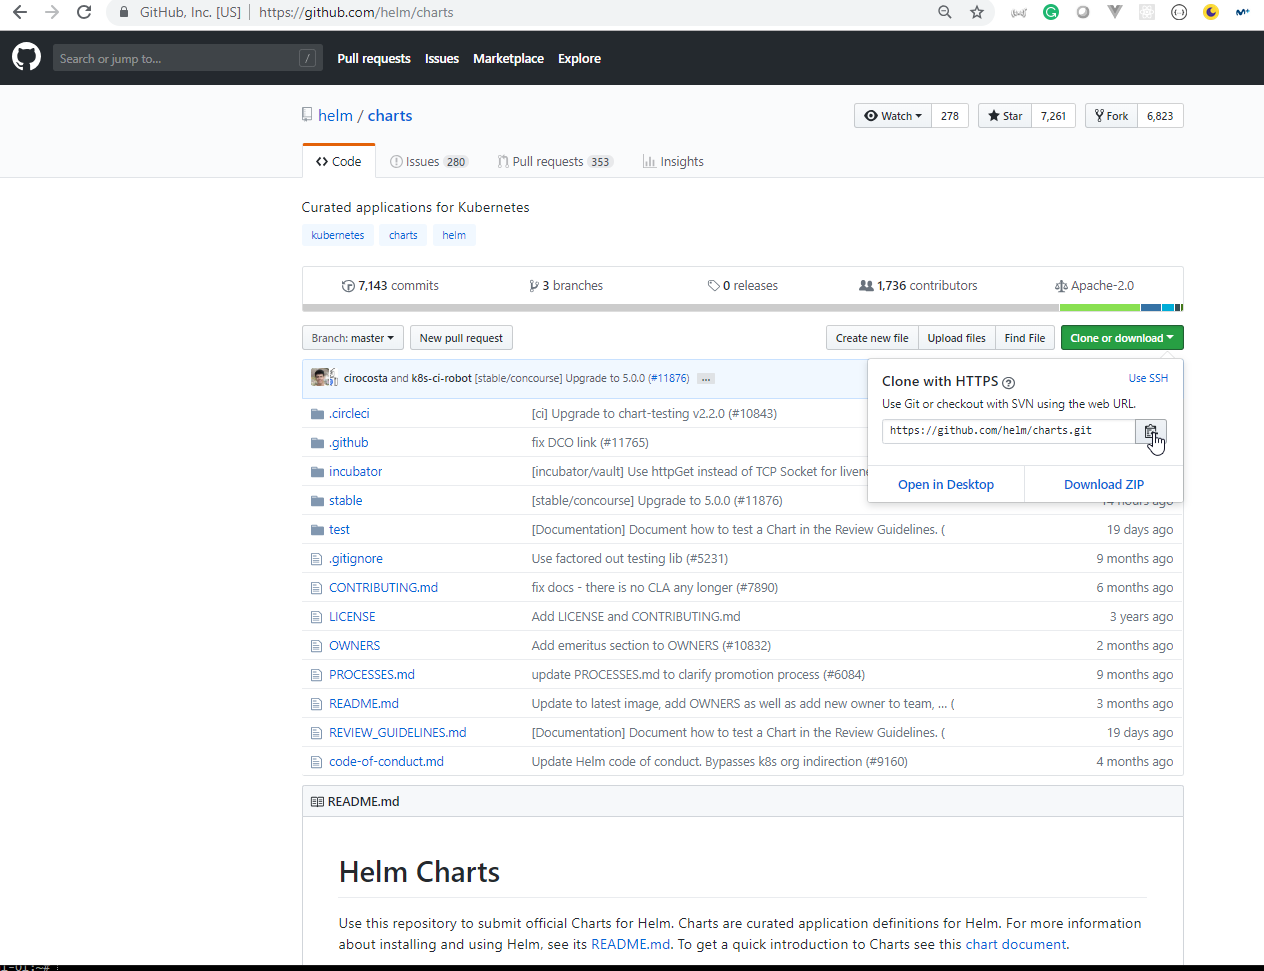
root@ubuntu-s-1vcpu-2gb-lon1-01:~# git clone https://github.com/helm/charts.git
Cloning into 'charts'...
remote: Enumerating objects: 58866, done.
remote: Total 58866 (delta 0), reused 0 (delta 0), pack-reused 58866
Receiving objects: 100% (58866/58866), 16.82 MiB | 19.57 MiB/s, done.
Resolving deltas: 100% (41399/41399), done.
root@ubuntu-s-1vcpu-2gb-lon1-01:~# cd charts
root@ubuntu-s-1vcpu-2gb-lon1-01:~/charts# ls
CONTRIBUTING.md  LICENSE  OWNERS  PROCESSES.md  README.md  REVIEW_GUIDELINES.md  code-of-conduct.md  incubator  stable  test
root@ubuntu-s-1vcpu-2gb-lon1-01:~/charts# ll
total 100
drwxr-xr-x   8 root root  4096 Mar 10 06:17 ./
drwx------  17 root root  4096 Mar 10 06:17 ../
drwxr-xr-x   2 root root  4096 Mar 10 06:17 .circleci/
drwxr-xr-x   8 root root  4096 Mar 10 06:17 .git/
drwxr-xr-x   2 root root  4096 Mar 10 06:17 .github/
-rw-r--r--   1 root root   419 Mar 10 06:17 .gitignore
-rw-r--r--   1 root root  6882 Mar 10 06:17 CONTRIBUTING.md
-rw-r--r--   1 root root 11358 Mar 10 06:17 LICENSE
-rw-r--r--   1 root root   212 Mar 10 06:17 OWNERS
-rw-r--r--   1 root root  3248 Mar 10 06:17 PROCESSES.md
-rw-r--r--   1 root root  7256 Mar 10 06:17 README.md
-rw-r--r--   1 root root 15086 Mar 10 06:17 REVIEW_GUIDELINES.md
-rw-r--r--   1 root root   137 Mar 10 06:17 code-of-conduct.md
drwxr-xr-x  56 root root  4096 Mar 10 06:17 incubator/
drwxr-xr-x 268 root root 12288 Mar 10 06:17 stable/
drwxr-xr-x   3 root root  4096 Mar 10 06:17 test/
- Go to the
gogsfolder
root@ubuntu-s-1vcpu-2gb-lon1-01:~/charts# cd incubator/
root@ubuntu-s-1vcpu-2gb-lon1-01:~/charts/incubator# cd gogs
root@ubuntu-s-1vcpu-2gb-lon1-01:~/charts/incubator/gogs# ll
total 48
drwxr-xr-x  3 root root 4096 Mar 10 06:17 ./
drwxr-xr-x 56 root root 4096 Mar 10 06:17 ../
-rw-r--r--  1 root root  333 Mar 10 06:17 .helmignore
-rw-r--r--  1 root root  205 Mar 10 06:17 Chart.yaml
-rw-r--r--  1 root root   42 Mar 10 06:17 OWNERS
-rw-r--r--  1 root root 3503 Mar 10 06:17 README.md
-rw-r--r--  1 root root  241 Mar 10 06:17 requirements.lock
-rw-r--r--  1 root root  154 Mar 10 06:17 requirements.yaml
drwxr-xr-x  2 root root 4096 Mar 10 06:17 templates/
-rw-r--r--  1 root root 9222 Mar 10 06:17 values.yaml
- We need to update the
values.yamldocument to modify thesize: 1GitosizeL 0.5Gi.
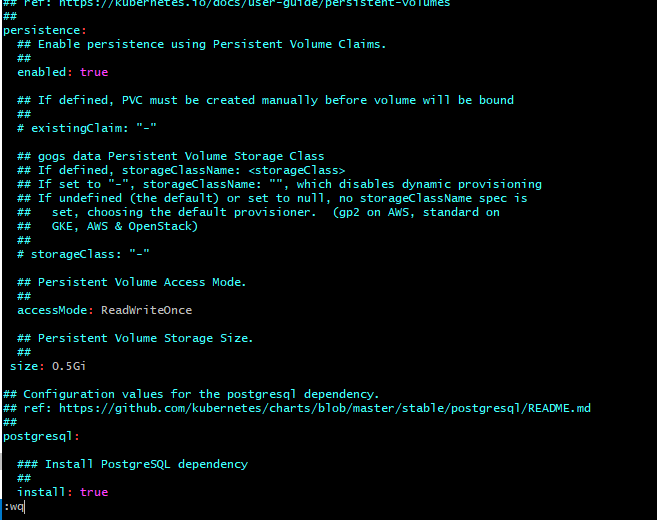
- In order to install the
gogs chartsfrom thegithub repositoryusing the currentvalues.yamldocument and naming the deployment withudemyby executing the following command:
root@ubuntu-s-1vcpu-2gb-lon1-01:~/charts/incubator/gogs# helm install --name udemy --values values.yaml incubator/gogs
Error: failed to download "incubator/gogs" (hint: running `helm repo update` may help)
root@ubuntu-s-1vcpu-2gb-lon1-01:~/charts/incubator/gogs# helm repo update
Hang tight while we grab the latest from your chart repositories...
...Skip local chart repository
...Successfully got an update from the "stable" chart repository
Update Complete. ? Happy Helming!?
root@ubuntu-s-1vcpu-2gb-lon1-01:~/charts/incubator/gogs# helm install --name udemy --values values.yaml incubator/gogs
Error: failed to download "incubator/gogs" (hint: running `helm repo update` may help)
- We need to execute the following command to fix the issue:
root@ubuntu-s-1vcpu-2gb-lon1-01:~/charts/incubator/gogs# helm repo add incubator http://storage.googleapis.com/kubernetes-charts-incubator
"incubator" has been added to your repositories
root@ubuntu-s-1vcpu-2gb-lon1-01:~/charts/incubator/gogs# helm install --name udemy --values values.yaml incubator/gogs
NAME:   udemy
LAST DEPLOYED: Sun Mar 10 06:41:08 2019
NAMESPACE: default
STATUS: DEPLOYED

RESOURCES:
==> v1/Secret
NAME              TYPE    DATA  AGE
udemy-postgresql  Opaque  1     0s
udemy-gogs        Opaque  1     0s

==> v1/ConfigMap
NAME                DATA  AGE
tcp-udemy-gogs-ssh  1     0s
udemy-gogs-config   1     0s

==> v1/PersistentVolumeClaim
NAME              STATUS   VOLUME  CAPACITY  ACCESS MODES  STORAGECLASS  AGE
udemy-postgresql  Pending  gp2     0s
udemy-gogs        Pending  gp2     0s

==> v1/Service
NAME              TYPE       CLUSTER-IP    EXTERNAL-IP  PORT(S)                    AGE
udemy-postgresql  ClusterIP  100.70.3.223  <none>       5432/TCP                   0s
udemy-gogs        NodePort   100.68.6.178  <none>       80:30846/TCP,22:32699/TCP  0s

==> v1beta1/Deployment
NAME              DESIRED  CURRENT  UP-TO-DATE  AVAILABLE  AGE
udemy-postgresql  1        1        1           0          0s
udemy-gogs        1        1        1           0          0s

==> v1/Pod(related)
NAME                               READY  STATUS   RESTARTS  AGE
udemy-postgresql-6ffd4ffc86-86bdf  0/1    Pending  0         0s
udemy-gogs-856845fbb8-qxdcg        0/1    Pending  0         0s


NOTES:
1. Get the Gogs URL by running:

  export NODE_PORT=$(kubectl get --namespace default -o jsonpath="{.spec.ports[0].nodePort}" services udemy-gogs)
  export NODE_IP=$(kubectl get nodes --namespace default -o jsonpath="{.items[0].status.addresses[0].address}")
  echo http://$NODE_IP:$NODE_PORT/

2. Register a user.  The first user registered will be the administrator.
29. How to understand helm Gogs deployment
root@ubuntu-s-1vcpu-2gb-lon1-01:~/charts/incubator/gogs# kubectl get pods,svc
NAME                                     READY   STATUS    RESTARTS   AGE
pod/jupyter-k8s-udemy-79f7dd7ffc-kfzb7   1/1     Running   0          21h
pod/udemy-gogs-856845fbb8-qxdcg          1/1     Running   0          2h
pod/udemy-postgresql-6ffd4ffc86-86bdf    1/1     Running   0          2h

NAME                        TYPE        CLUSTER-IP     EXTERNAL-IP   PORT(S)                     AGE
service/jupyter-k8s-udemy   NodePort    100.64.248.5   <none>        8888:30040/TCP              22h
service/kubernetes          ClusterIP   100.64.0.1     <none>        443/TCP                     1d
service/udemy-gogs          NodePort    100.68.6.178   <none>        80:30846/TCP,22:32699/TCP   2h
service/udemy-postgresql    ClusterIP   100.70.3.223   <none>        5432/TCP
- We need to open the
30846port to be able to access it from outside thekubernetes cluster

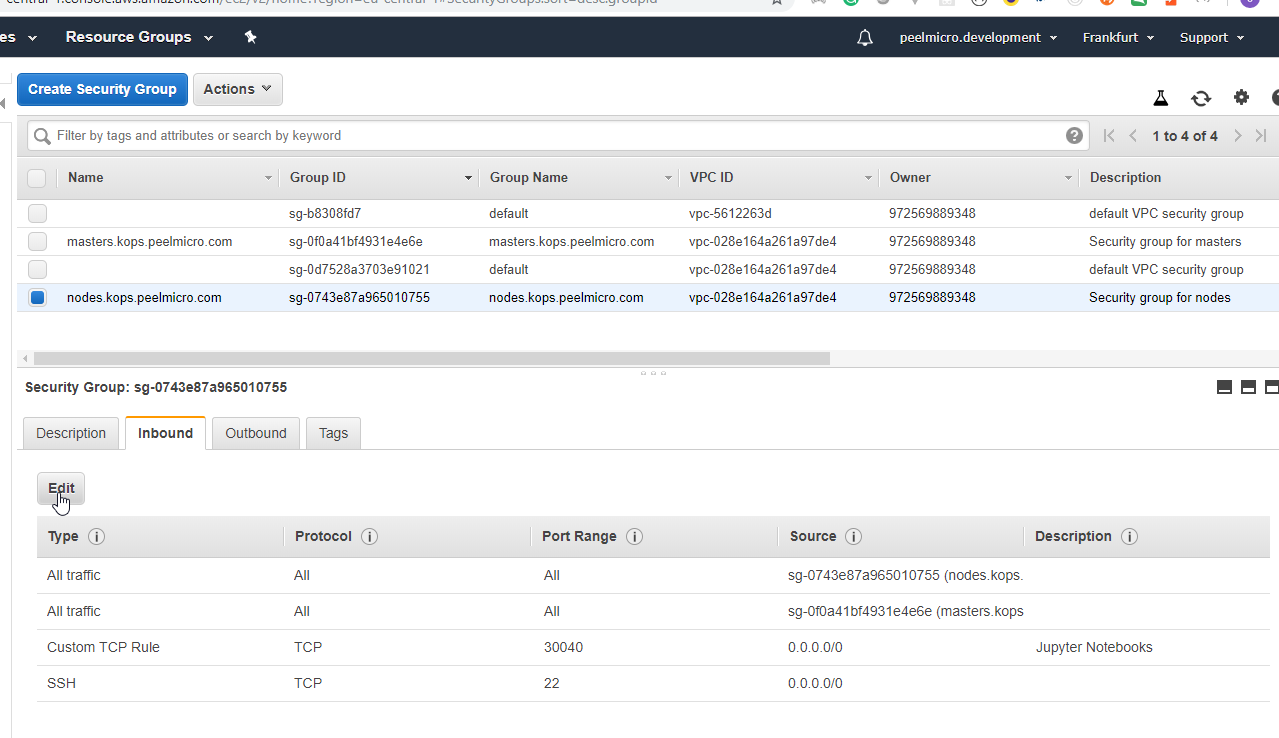
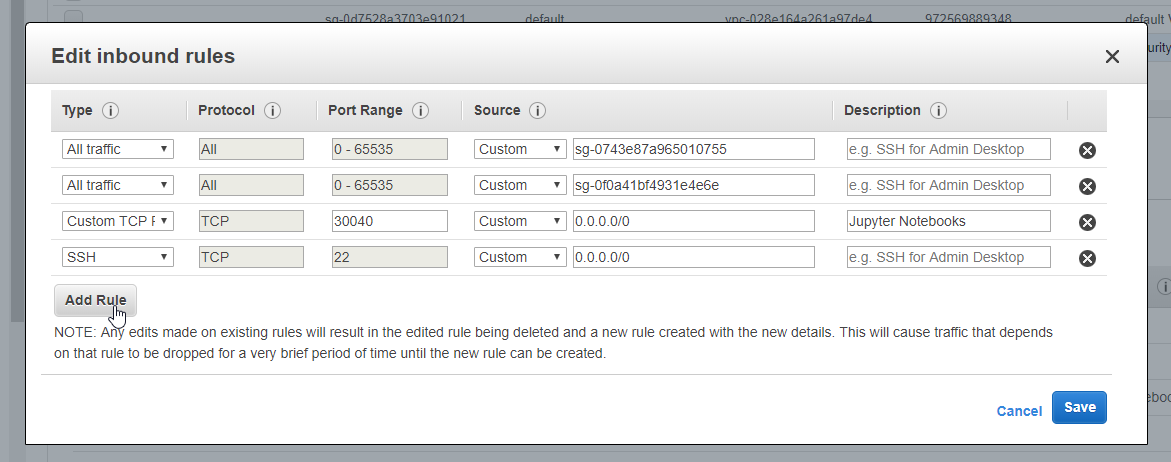
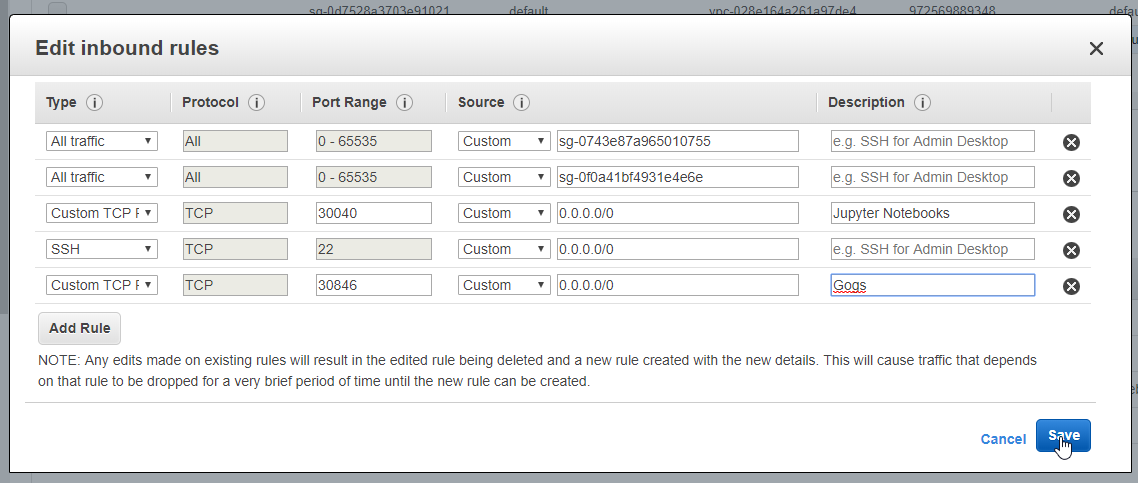
- Browse to http://18.184.104.252:30846/
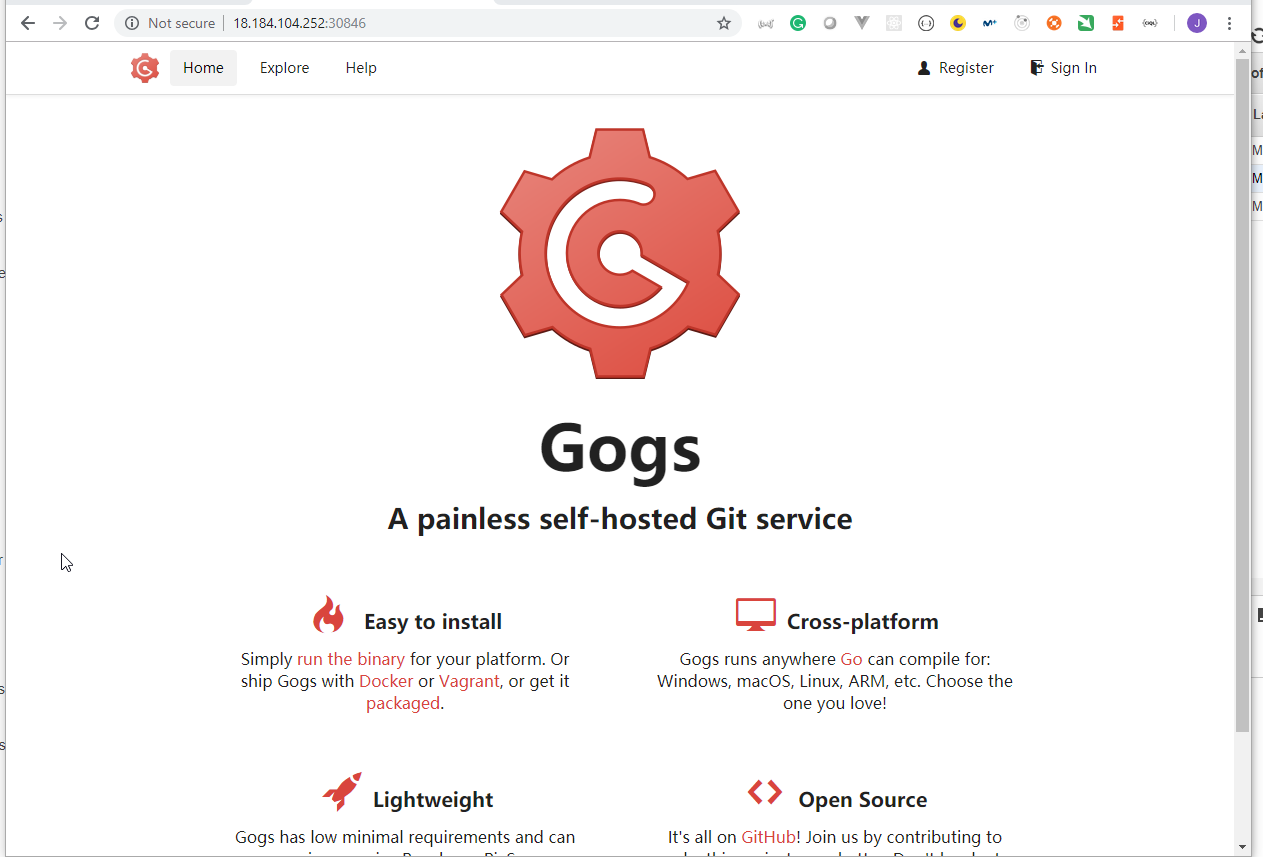
- Ensure it is working
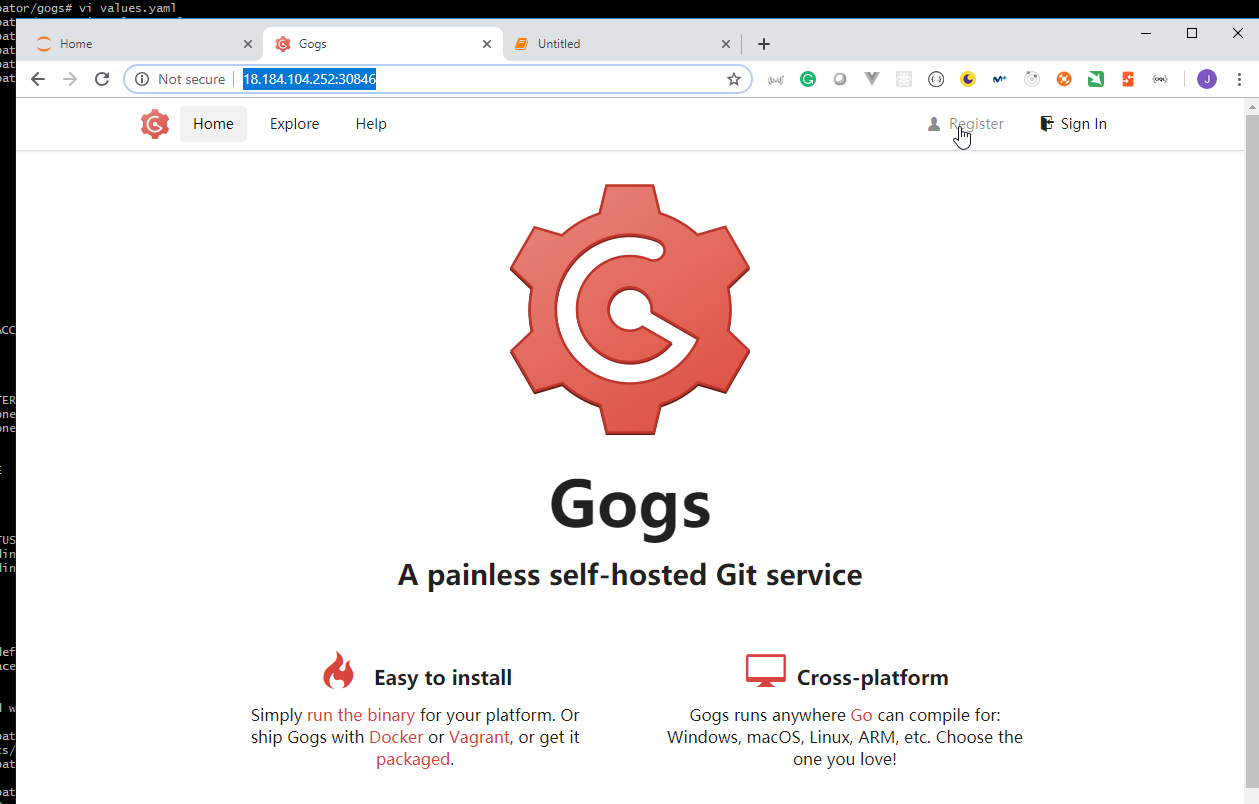
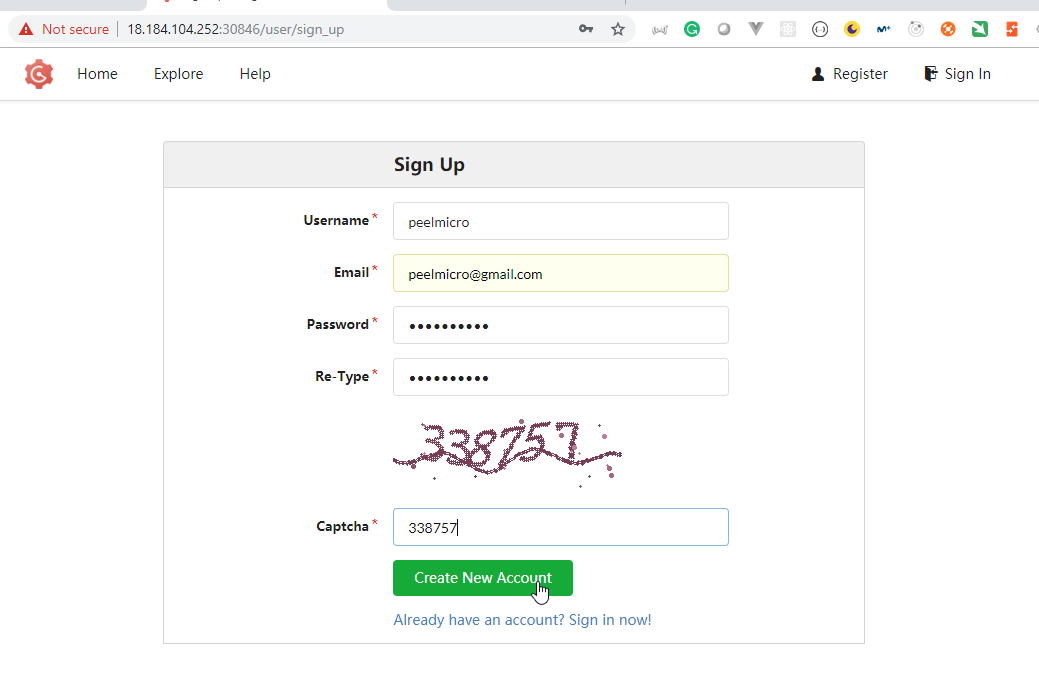
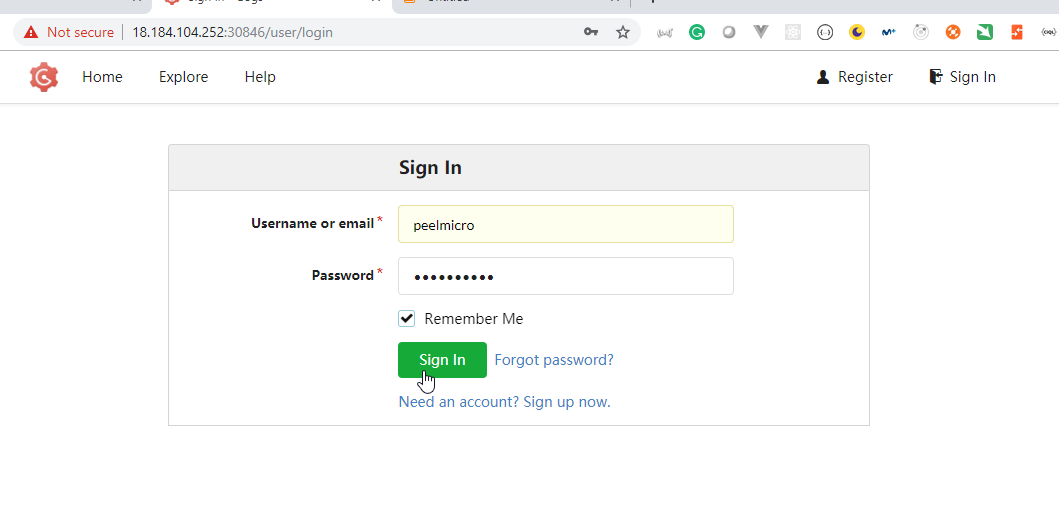
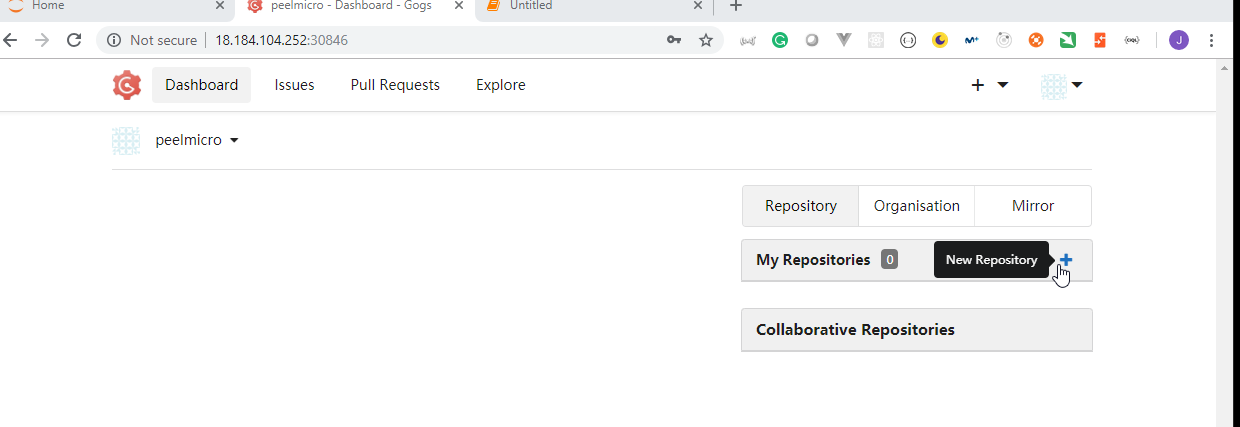
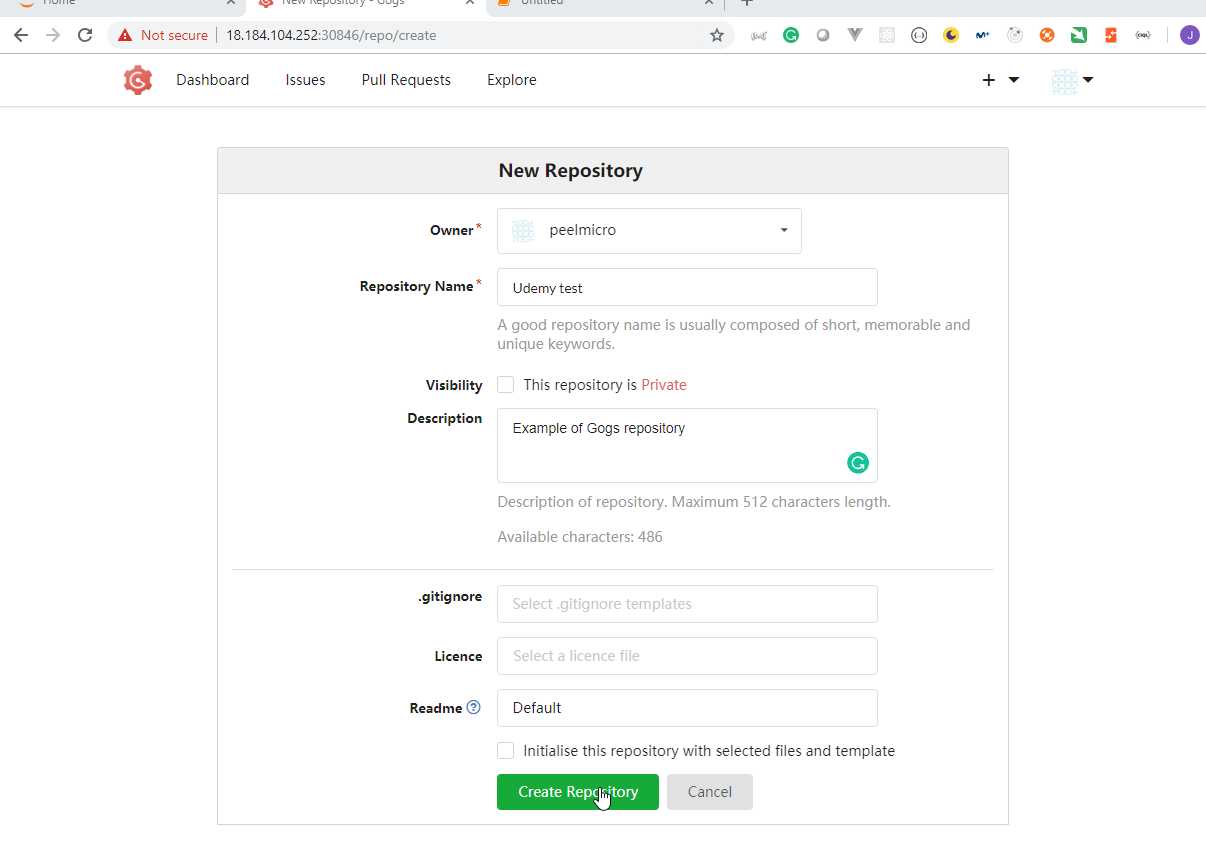
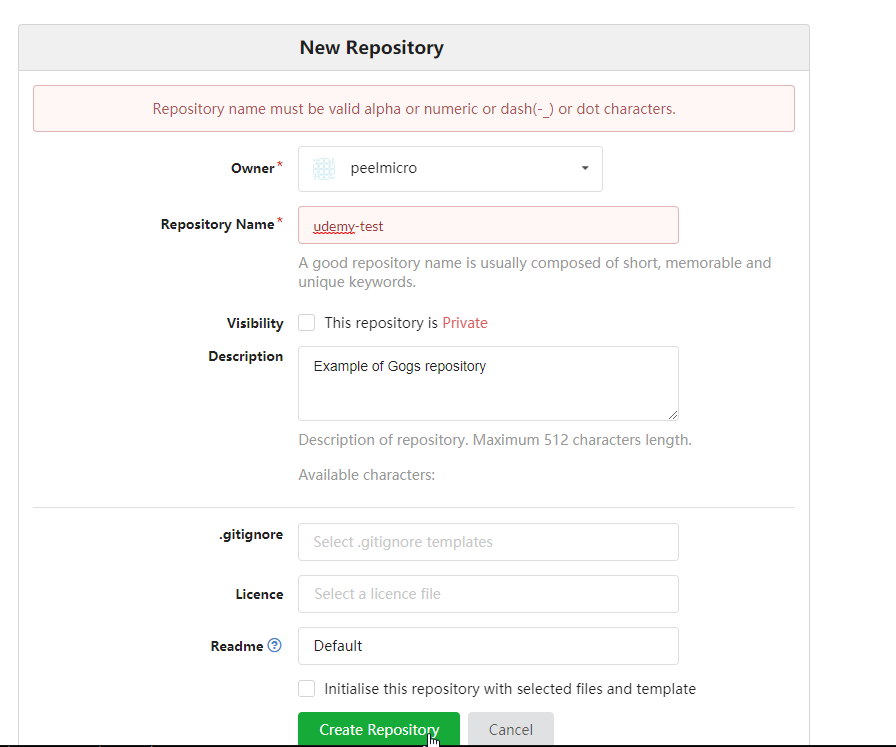
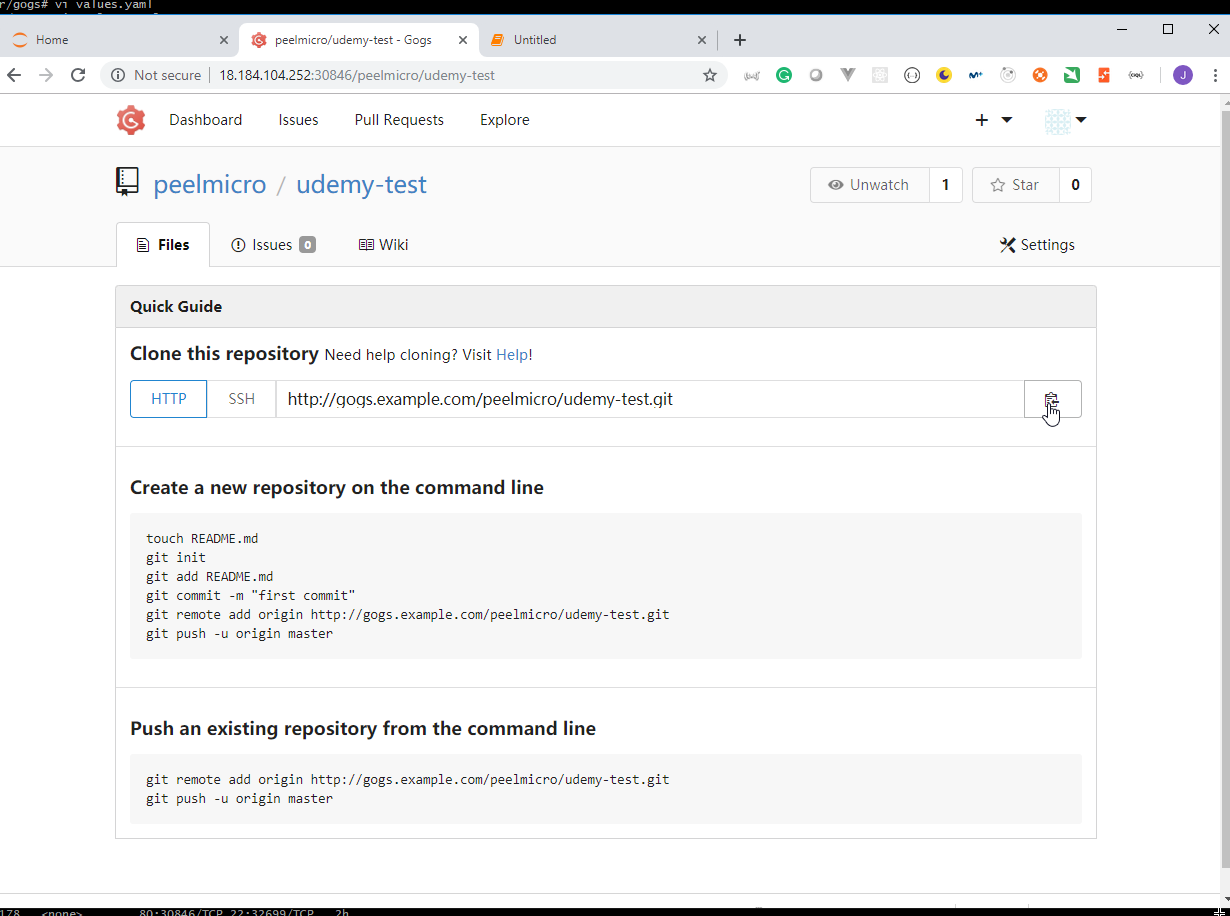
- Clone the recently created repository:
root@ubuntu-s-1vcpu-2gb-lon1-01:/# git clone http://18.184.104.252:30846/peelmicro/udemy-test.git
Cloning into 'udemy-test'...
warning: You appear to have cloned an empty repository.
root@ubuntu-s-1vcpu-2gb-lon1-01:/# cd udemy-test/
root@ubuntu-s-1vcpu-2gb-lon1-01:/udemy-test# ls
root@ubuntu-s-1vcpu-2gb-lon1-01:/udemy-test# ll
total 12
drwxr-xr-x  3 root root 4096 Mar 10 09:41 ./
drwxr-xr-x 24 root root 4096 Mar 10 09:41 ../
drwxr-xr-x  7 root root 4096 Mar 10 09:41 .git/
root@ubuntu-s-1vcpu-2gb-lon1-01:/udemy-test#
root@ubuntu-s-1vcpu-2gb-lon1-01:/udemy-test# vi readme.md
root@ubuntu-s-1vcpu-2gb-lon1-01:/udemy-test# ls
readme.md
root@ubuntu-s-1vcpu-2gb-lon1-01:/udemy-test# cat readme.md
# Gogs test repository

## Example

This is an **example** of a `test` repository
root@ubuntu-s-1vcpu-2gb-lon1-01:/udemy-test#
root@ubuntu-s-1vcpu-2gb-lon1-01:/udemy-test# git status
On branch master

No commits yet

Untracked files:
  (use "git add <file>..." to include in what will be committed)

        readme.md

nothing added to commit but untracked files present (use "git add" to track)
root@ubuntu-s-1vcpu-2gb-lon1-01:/udemy-test# git add .
root@ubuntu-s-1vcpu-2gb-lon1-01:/udemy-test# git status
On branch master

No commits yet

Changes to be committed:
  (use "git rm --cached <file>..." to unstage)

        new file:   readme.md

root@ubuntu-s-1vcpu-2gb-lon1-01:/udemy-test# git commit -m "Initial commit"

*** Please tell me who you are.

Run

  git config --global user.email "you@example.com"
  git config --global user.name "Your Name"

to set your account's default identity.
Omit --global to set the identity only in this repository.

fatal: unable to auto-detect email address (got 'root@ubuntu-s-1vcpu-2gb-lon1-01.(none)')
root@ubuntu-s-1vcpu-2gb-lon1-01:/udemy-test# git config --global user.email "peelmicro@gmail.com"
root@ubuntu-s-1vcpu-2gb-lon1-01:/udemy-test# git config --global user.name "peelmicro"
root@ubuntu-s-1vcpu-2gb-lon1-01:/udemy-test# git status
On branch master

No commits yet

Changes to be committed:
  (use "git rm --cached <file>..." to unstage)

        new file:   readme.md

root@ubuntu-s-1vcpu-2gb-lon1-01:/udemy-test# git commit -m "Initial commit"
[master (root-commit) a44f533] Initial commit
 1 file changed, 5 insertions(+)
 create mode 100644 readme.md
root@ubuntu-s-1vcpu-2gb-lon1-01:/udemy-test# git push origin master
Counting objects: 3, done.
Compressing objects: 100% (2/2), done.
Writing objects: 100% (3/3), 274 bytes | 274.00 KiB/s, done.
Total 3 (delta 0), reused 0 (delta 0)
Username for 'http://18.184.104.252:30846': peelmicro
Password for 'http://peelmicro@18.184.104.252:30846':
To http://18.184.104.252:30846/peelmicro/udemy-test.git
 * [new branch]      master -> master
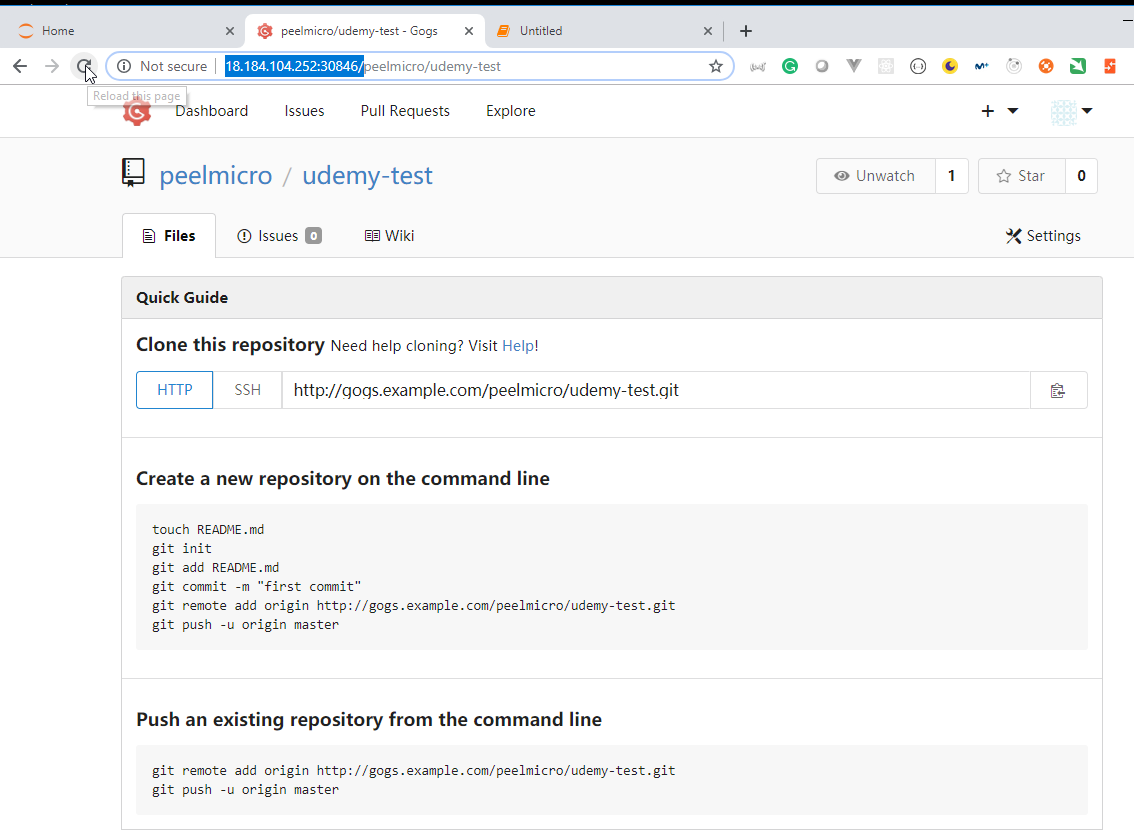
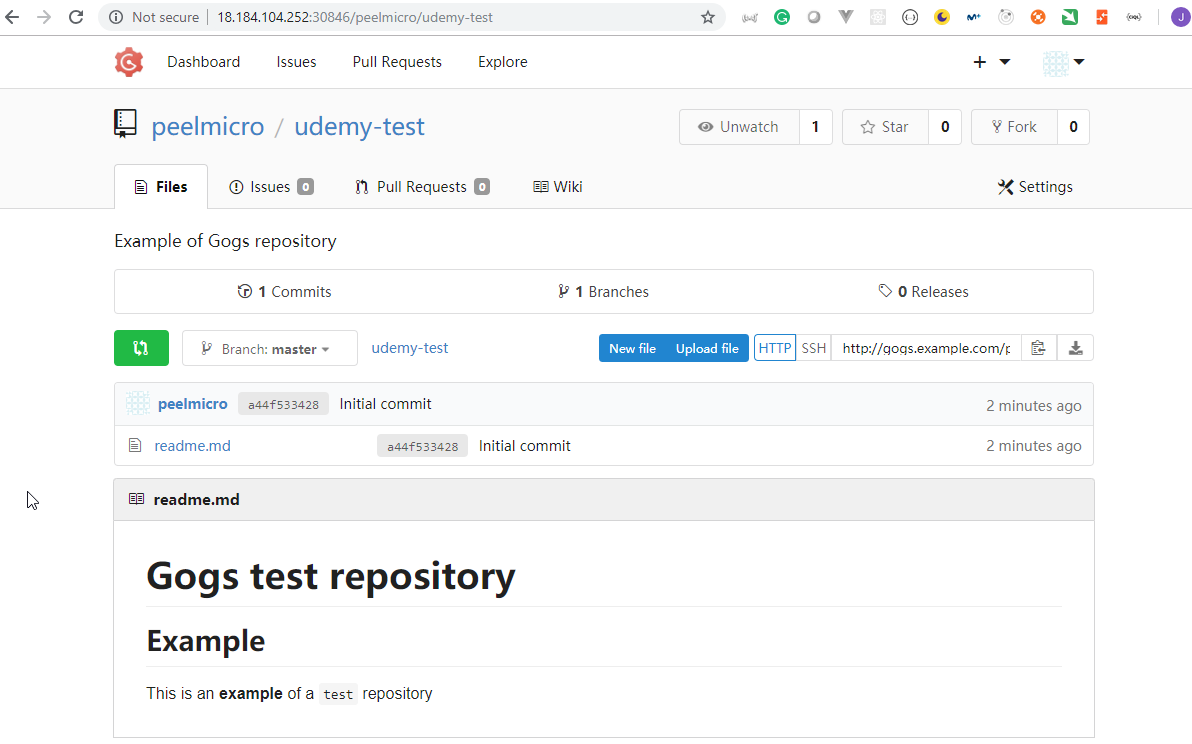
30. Materials: How to use HELM to deploy GOGS from locally downloaded HELM CHARTS
**How to create local file/directory structure for GOGS installation from local files **
I would suggest to follow the video and create it on your own.
ssh username@your_server

# this will clone all the HELM charts
username@your_server:~$ git clone https://github.com/helm/charts.git

username@your_server:~$ ls charts/
code-of-conduct.md  incubator  OWNERS        README.md             stable
CONTRIBUTING.md     LICENSE    PROCESSES.md  REVIEW_GUIDELINES.md  test

# create some folder
username@your_server:~$ mkdir local_installation
username@your_server:~$ cd local_installation

# copy gogs/ folder from charts/ folder you have cloned from github.com
username@your_server:~/local_installation$ rsync -avhx ../charts/incubator/gogs .
username@your_server:~/local_installation$ ls
gogs

# create an empty folder called charts/ inside your gogs/ folder
username@your_server:~/local_installation$ mkdir charts; cd charts

username@your_server:~/local_installation/gogs/charts$ rsync -avhx ../../../charts/stable/postgresql .


# final structure

username@your_server:~/local_installation/gogs/charts$ cd ..
username@your_server:~/local_installation/gogs$ tree -L 2

username@your_server:~/local_installation/gogs$ tree -L 2
.
├── charts
│   └── postgresql
├── Chart.yaml
├── README.md
├── requirements.lock
├── requirements.yaml
├── templates
│   ├── configmap-tcp.yaml
│   ├── configmap.yaml
│   ├── deployment.yaml
│   ├── _helpers.tpl
│   ├── ingress.yaml
│   ├── NOTES.txt
│   ├── pvc.yaml
│   ├── secrets.yaml
│   └── service.yaml
└── values.yaml
31. How to deploy Gogs from local repository
- Check all the deployments we have
root@ubuntu-s-1vcpu-2gb-lon1-01:/udemy-test# helm list -a
NAME    REVISION        UPDATED                         STATUS          CHART           NAMESPACE
udemy   1               Sun Mar 10 06:41:08 2019        DEPLOYED        gogs-0.7.7      default
- check what the requirements for
gogsare:
root@ubuntu-s-1vcpu-2gb-lon1-01:~/charts/incubator/gogs# cat requirements.yaml
dependencies:
  - name: postgresql
    version: 0.6.0
    repository: https://kubernetes-charts.storage.googleapis.com/
    condition: postgresql.install
root@ubuntu-s-1vcpu-2gb-lon1-01:~/charts/incubator/gogs# ll ../../stable/postgresql
total 92
drwxr-xr-x   4 root root  4096 Mar 10 06:17 ./
drwxr-xr-x 268 root root 12288 Mar 10 06:17 ../
-rw-r--r--   1 root root    11 Mar 10 06:17 .helmignore
-rw-r--r--   1 root root   609 Mar 10 06:17 Chart.yaml
-rw-r--r--   1 root root   169 Mar 10 06:17 OWNERS
-rw-r--r--   1 root root 31961 Mar 10 06:17 README.md
drwxr-xr-x   4 root root  4096 Mar 10 06:17 files/
drwxr-xr-x   2 root root  4096 Mar 10 06:17 templates/
-rw-r--r--   1 root root  9924 Mar 10 06:17 values-production.yaml
-rw-r--r--   1 root root 10144 Mar 10 06:17 values.yaml
- Create the
local_installationfolder
root@ubuntu-s-1vcpu-2gb-lon1-01:~# mkdir local_installation
root@ubuntu-s-1vcpu-2gb-lon1-01:~# cd local_installation
- Copy the
charts/incubator/gogsfolder inside this new folder
root@ubuntu-s-1vcpu-2gb-lon1-01:~/local_installation# rsync -avhx ../charts/incubator/gogs .
sending incremental file list
gogs/
gogs/.helmignore
gogs/Chart.yaml
gogs/OWNERS
gogs/README.md
gogs/requirements.lock
gogs/requirements.yaml
gogs/values.yaml
gogs/templates/
gogs/templates/NOTES.txt
gogs/templates/_helpers.tpl
gogs/templates/configmap-tcp.yaml
gogs/templates/configmap.yaml
gogs/templates/deployment.yaml
gogs/templates/ingress.yaml
gogs/templates/pvc.yaml
gogs/templates/secrets.yaml
gogs/templates/service.yaml

sent 28.76K bytes  received 336 bytes  58.19K bytes/sec
total size is 27.55K  speedup is 0.95
root@ubuntu-s-1vcpu-2gb-lon1-01:~/local_installation# ll
total 12
drwxr-xr-x  3 root root 4096 Mar 10 10:08 ./
drwx------ 18 root root 4096 Mar 10 10:04 ../
drwxr-xr-x  3 root root 4096 Mar 10 10:00 gogs/
root@ubuntu-s-1vcpu-2gb-lon1-01:~/local_installation#
root@ubuntu-s-1vcpu-2gb-lon1-01:~/local_installation# ll gogs
total 48
drwxr-xr-x 3 root root 4096 Mar 10 10:00 ./
drwxr-xr-x 3 root root 4096 Mar 10 10:08 ../
-rw-r--r-- 1 root root  333 Mar 10 06:17 .helmignore
-rw-r--r-- 1 root root  205 Mar 10 06:17 Chart.yaml
-rw-r--r-- 1 root root   42 Mar 10 06:17 OWNERS
-rw-r--r-- 1 root root 3503 Mar 10 06:17 README.md
-rw-r--r-- 1 root root  241 Mar 10 06:17 requirements.lock
-rw-r--r-- 1 root root  154 Mar 10 06:17 requirements.yaml
drwxr-xr-x 2 root root 4096 Mar 10 06:17 templates/
-rw-r--r-- 1 root root 9224 Mar 10 06:41 values.yaml
- Create the
chartsfolder inside the newlocal_installationfolder
root@ubuntu-s-1vcpu-2gb-lon1-01:~/local_instalation/gogs# mkdir charts
root@ubuntu-s-1vcpu-2gb-lon1-01:~/local_installation/gogs# cd charts/
- Copy from the
charts/stable/postgresqlfolder
root@ubuntu-s-1vcpu-2gb-lon1-01:~/local_installation/gogs/charts# rsync -avhx ../../../charts/stable/postgresql .
sending incremental file list
postgresql/
postgresql/.helmignore
postgresql/Chart.yaml
postgresql/OWNERS
postgresql/README.md
postgresql/values-production.yaml
postgresql/values.yaml
postgresql/files/
postgresql/files/README.md
postgresql/files/conf.d/
postgresql/files/conf.d/README.md
postgresql/files/docker-entrypoint-initdb.d/
postgresql/files/docker-entrypoint-initdb.d/README.md
postgresql/templates/
postgresql/templates/NOTES.txt
postgresql/templates/_helpers.tpl
postgresql/templates/configmap.yaml
postgresql/templates/extended-config-configmap.yaml
postgresql/templates/initialization-configmap.yaml
postgresql/templates/metrics-svc.yaml
postgresql/templates/networkpolicy.yaml
postgresql/templates/secrets.yaml
postgresql/templates/statefulset-slaves.yaml
postgresql/templates/statefulset.yaml
postgresql/templates/svc-headless.yaml
postgresql/templates/svc-read.yaml
postgresql/templates/svc.yaml

sent 93.97K bytes  received 462 bytes  188.86K bytes/sec
total size is 92.19K  speedup is 0.98
root@ubuntu-s-1vcpu-2gb-lon1-01:~/local_installation/gogs/charts#
root@ubuntu-s-1vcpu-2gb-lon1-01:~/local_installation/gogs/charts# ll
total 12
drwxr-xr-x 3 root root 4096 Mar 10 10:15 ./
drwxr-xr-x 4 root root 4096 Mar 10 10:11 ../
drwxr-xr-x 4 root root 4096 Mar 10 06:17 postgresql/
root@ubuntu-s-1vcpu-2gb-lon1-01:~/local_installation/gogs/charts#
- Modify the
postgresql/values.yamldocument to changesize: 8Gitosize: 1Gi.

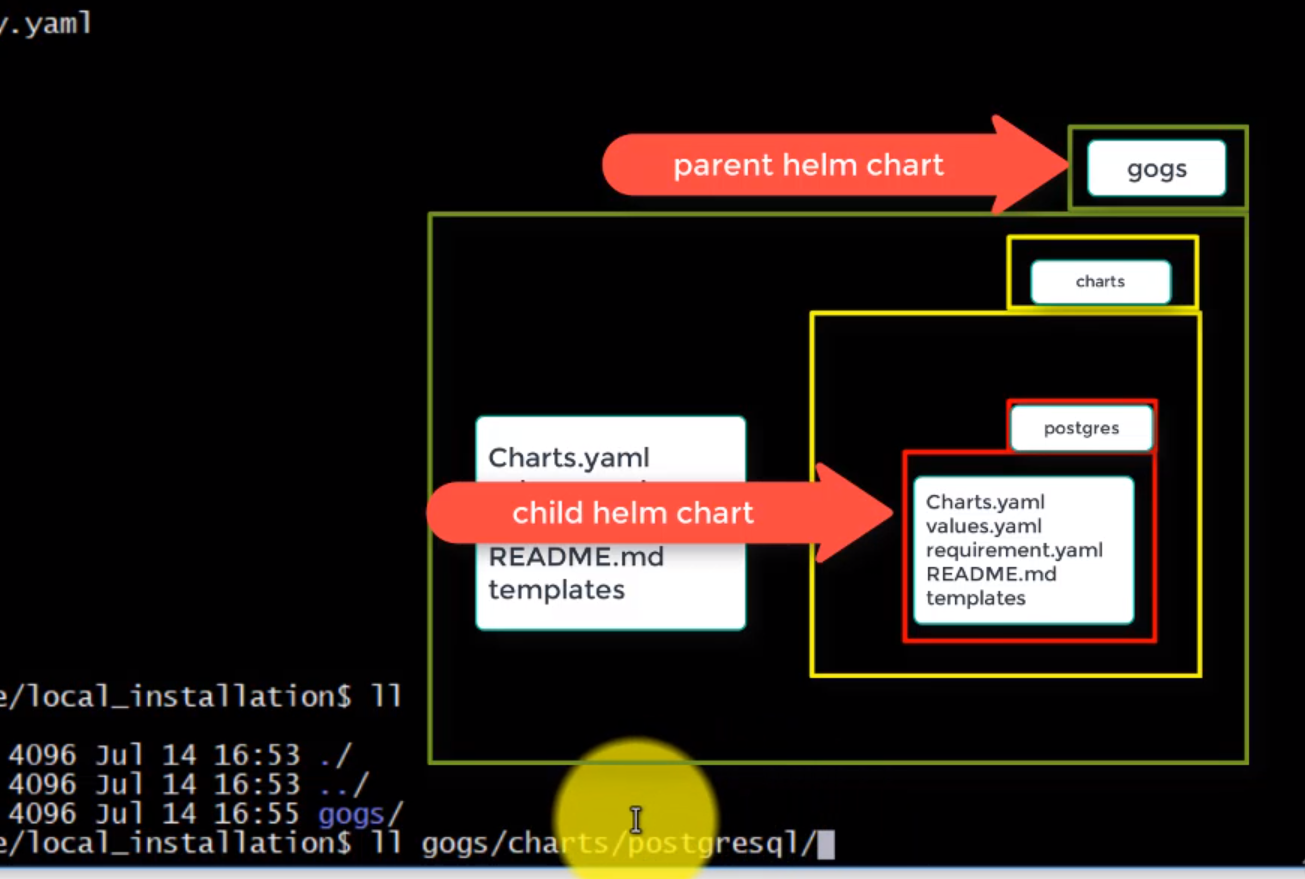
- Our current deployment is still there
root@ubuntu-s-1vcpu-2gb-lon1-01:~/local_installation# helm list
NAME    REVISION        UPDATED                         STATUS          CHART           NAMESPACE
udemy   1               Sun Mar 10 06:41:08 2019        DEPLOYED        gogs-0.7.7      default
- We need to delete the deployment by using the following command
root@ubuntu-s-1vcpu-2gb-lon1-01:~/local_installation# helm delete udemy --purge
release "udemy" deleted
root@ubuntu-s-1vcpu-2gb-lon1-01:~/local_installation# kubectl get all
NAME                                     READY   STATUS    RESTARTS   AGE
pod/jupyter-k8s-udemy-79f7dd7ffc-kfzb7   1/1     Running   0          22h

NAME                        TYPE        CLUSTER-IP     EXTERNAL-IP   PORT(S)          AGE
service/jupyter-k8s-udemy   NodePort    100.64.248.5   <none>        8888:30040/TCP   23h
service/kubernetes          ClusterIP   100.64.0.1     <none>        443/TCP          1d

NAME                                DESIRED   CURRENT   UP-TO-DATE   AVAILABLE   AGE
deployment.apps/jupyter-k8s-udemy   1         1         1            1           23h

NAME                                           DESIRED   CURRENT   READY   AGE
replicaset.apps/jupyter-k8s-udemy-79f7dd7ffc   1         1         1       23h
root@ubuntu-s-1vcpu-2gb-lon1-01:~/local_installation# tree -L 4
.
+-- gogs
    +-- Chart.yaml
    +-- OWNERS
    +-- README.md
    +-- charts
    ¦   +-- postgresql
    ¦       +-- Chart.yaml
    ¦       +-- OWNERS
    ¦       +-- README.md
    ¦       +-- files
    ¦       +-- templates
    ¦       +-- values-production.yaml
    ¦       +-- values.yaml
    +-- requirements.lock
    +-- requirements.yaml
    +-- templates
    ¦   +-- NOTES.txt
    ¦   +-- _helpers.tpl
    ¦   +-- configmap-tcp.yaml
    ¦   +-- configmap.yaml
    ¦   +-- deployment.yaml
    ¦   +-- ingress.yaml
    ¦   +-- pvc.yaml
    ¦   +-- secrets.yaml
    ¦   +-- service.yaml
    +-- values.yaml

6 directories, 20 files
- In order to install the
helm chartfrom the local server we have to execute:
root@ubuntu-s-1vcpu-2gb-lon1-01:~/local_installation# helm install --name local gogs
NAME:   local
LAST DEPLOYED: Sun Mar 10 10:30:24 2019
NAMESPACE: default
STATUS: DEPLOYED

RESOURCES:
==> v1/Service
NAME                       TYPE       CLUSTER-IP      EXTERNAL-IP  PORT(S)                    AGE
local-postgresql-headless  ClusterIP  None            <none>       5432/TCP                   1s
local-postgresql           ClusterIP  100.71.85.138   <none>       5432/TCP                   1s
local-gogs                 NodePort   100.67.180.140  <none>       80:32677/TCP,22:31272/TCP  1s

==> v1beta1/Deployment
NAME        DESIRED  CURRENT  UP-TO-DATE  AVAILABLE  AGE
local-gogs  1        1        1           0          1s

==> v1beta2/StatefulSet
NAME              DESIRED  CURRENT  AGE
local-postgresql  1        1        1s

==> v1/Pod(related)
NAME                         READY  STATUS   RESTARTS  AGE
local-gogs-7b7cb96b7f-ns5zs  0/1    Pending  0         1s
local-postgresql-0           0/1    Pending  0         1s

==> v1/Secret
NAME              TYPE    DATA  AGE
local-postgresql  Opaque  1     1s
local-gogs        Opaque  1     1s

==> v1/ConfigMap
NAME                DATA  AGE
tcp-local-gogs-ssh  1     1s
local-gogs-config   1     1s

==> v1/PersistentVolumeClaim
NAME        STATUS   VOLUME  CAPACITY  ACCESS MODES  STORAGECLASS  AGE
local-gogs  Pending  gp2     1s


NOTES:
1. Get the Gogs URL by running:

  export NODE_PORT=$(kubectl get --namespace default -o jsonpath="{.spec.ports[0].nodePort}" services local-gogs)
  export NODE_IP=$(kubectl get nodes --namespace default -o jsonpath="{.items[0].status.addresses[0].address}")
  echo http://$NODE_IP:$NODE_PORT/

2. Register a user.  The first user registered will be the administrator.
root@ubuntu-s-1vcpu-2gb-lon1-01:~/local_installation# kubectl get pods,svc,pv
NAME                                     READY   STATUS    RESTARTS   AGE
pod/jupyter-k8s-udemy-79f7dd7ffc-kfzb7   1/1     Running   0          22h
pod/local-gogs-7b7cb96b7f-ns5zs          0/1     Running   0          1m
pod/local-postgresql-0                   1/1     Running   0          1m

NAME                                TYPE        CLUSTER-IP       EXTERNAL-IP   PORT(S)                     AGE
service/jupyter-k8s-udemy           NodePort    100.64.248.5     <none>        8888:30040/TCP              23h
service/kubernetes                  ClusterIP   100.64.0.1       <none>        443/TCP                     1d
service/local-gogs                  NodePort    100.67.180.140   <none>        80:32677/TCP,22:31272/TCP   1m
service/local-postgresql            ClusterIP   100.71.85.138    <none>        5432/TCP                    1m
service/local-postgresql-headless   ClusterIP   None             <none>        5432/TCP                    1m

NAME                                                        CAPACITY   ACCESS MODES   RECLAIM POLICY   STATUS   CLAIM                             STORAGECLASS   REASON   AGE
persistentvolume/pvc-83e27ba8-431f-11e9-b1ba-023d0745758e   1Gi        RWO            Delete           Bound    default/local-gogs                gp2                     1m
persistentvolume/pvc-84039d38-431f-11e9-b1ba-023d0745758e   1Gi        RWO            Delete           Bound    default/data-local-postgresql-0   gp2                     1m
- We need to change the firewall to open the ip to
32677
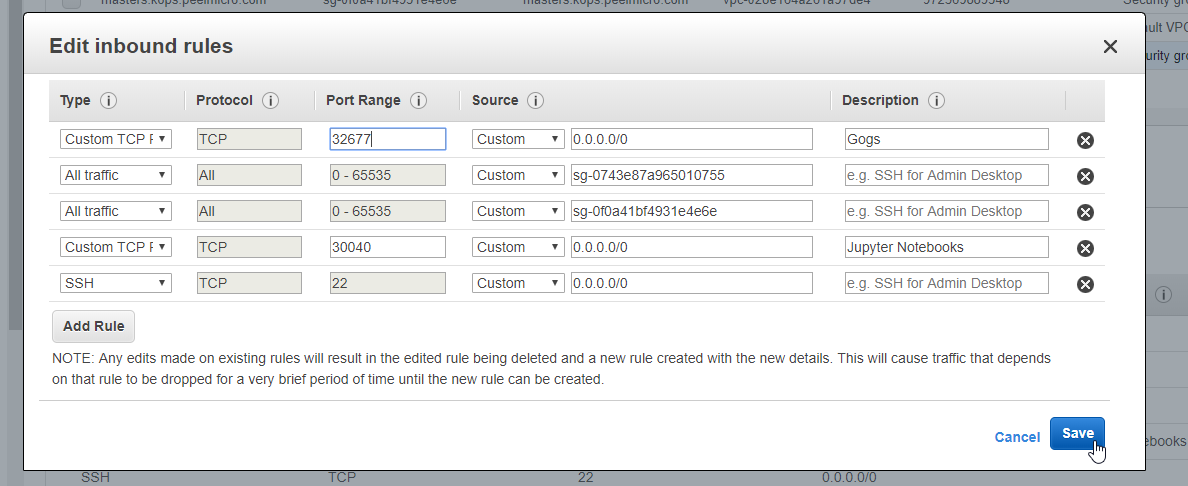
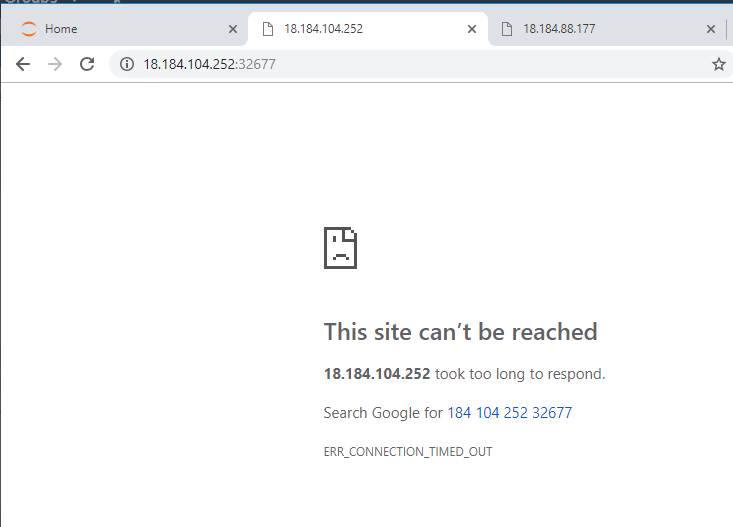
- the problem is that new
pod/local-gogs-7b7cb96b7f-ns5zspod is not ready.
root@ubuntu-s-1vcpu-2gb-lon1-01:~/local_installation# kubectl logs pod/local-gogs-7b7cb96b7f-ns5zs
.
.
.
chown: /data/gogs/conf/app.ini: Read-only file system
2019/03/10 10:57:32 [TRACE] Custom path: /data/gogs
2019/03/10 10:57:32 [TRACE] Log path: /app/gogs/log
2019/03/10 10:57:32 [TRACE] Build Time: 2019-01-31 03:38:34 UTC
2019/03/10 10:57:32 [TRACE] Build Git Hash: 06b6eaba060f8b874a4c2a8c84515b2ea45321d6
2019/03/10 10:57:32 [TRACE] Log Mode: Console (Trace)
2019/03/10 10:57:32 [ INFO] Gogs 0.11.86.0130
2019/03/10 10:57:32 [ INFO] Cache Service Enabled
2019/03/10 10:57:32 [ INFO] Session Service Enabled
2019/03/10 10:57:32 [FATAL] [...gs/routes/install.go:66 GlobalInit()] Fail to initialize ORM engine: migrate: sync: pq: password authentication failed for user "gogs"
Mar 10 10:57:33 sshd[23]: Received signal 15; terminating.
Mar 10 10:57:33 syslogd exiting
- Remove the current deployment and create it again
root@ubuntu-s-1vcpu-2gb-lon1-01:~/local_installation/gogs# helm delete local --purge
release "local" deleted
root@ubuntu-s-1vcpu-2gb-lon1-01:~/local_installation/gogs# kubectl get all
NAME                                     READY   STATUS    RESTARTS   AGE
pod/jupyter-k8s-udemy-79f7dd7ffc-kfzb7   1/1     Running   0          23h

NAME                        TYPE        CLUSTER-IP     EXTERNAL-IP   PORT(S)          AGE
service/jupyter-k8s-udemy   NodePort    100.64.248.5   <none>        8888:30040/TCP   1d
service/kubernetes          ClusterIP   100.64.0.1     <none>        443/TCP          1d

NAME                                DESIRED   CURRENT   UP-TO-DATE   AVAILABLE   AGE
deployment.apps/jupyter-k8s-udemy   1         1         1            1           1d

NAME                                           DESIRED   CURRENT   READY   AGE
replicaset.apps/jupyter-k8s-udemy-79f7dd7ffc   1         1         1       1d

root@ubuntu-s-1vcpu-2gb-lon1-01:~/local_installation# helm install --name local gogs
NAME:   local
LAST DEPLOYED: Sun Mar 10 11:21:59 2019
NAMESPACE: default
STATUS: DEPLOYED

RESOURCES:
==> v1beta1/Deployment
NAME        DESIRED  CURRENT  UP-TO-DATE  AVAILABLE  AGE
local-gogs  1        1        1           0          0s

==> v1beta2/StatefulSet
NAME              DESIRED  CURRENT  AGE
local-postgresql  1        1        0s

==> v1/Pod(related)
NAME                         READY  STATUS    RESTARTS  AGE
local-gogs-7b7cb96b7f-kqwp4  0/1    Pending   0         0s
local-postgresql-0           0/1    Init:0/1  0         0s

==> v1/Secret
NAME              TYPE    DATA  AGE
local-postgresql  Opaque  1     0s
local-gogs        Opaque  1     0s

==> v1/ConfigMap
NAME                DATA  AGE
tcp-local-gogs-ssh  1     0s
local-gogs-config   1     0s

==> v1/PersistentVolumeClaim
NAME        STATUS   VOLUME  CAPACITY  ACCESS MODES  STORAGECLASS  AGE
local-gogs  Pending  gp2     0s

==> v1/Service
NAME                       TYPE       CLUSTER-IP      EXTERNAL-IP  PORT(S)                    AGE
local-postgresql-headless  ClusterIP  None            <none>       5432/TCP                   0s
local-postgresql           ClusterIP  100.64.246.239  <none>       5432/TCP                   0s
local-gogs                 NodePort   100.67.249.46   <none>       80:31243/TCP,22:30688/TCP  0s


NOTES:
1. Get the Gogs URL by running:

  export NODE_PORT=$(kubectl get --namespace default -o jsonpath="{.spec.ports[0].nodePort}" services local-gogs)
  export NODE_IP=$(kubectl get nodes --namespace default -o jsonpath="{.items[0].status.addresses[0].address}")
  echo http://$NODE_IP:$NODE_PORT/

2. Register a user.  The first user registered will be the administrator.

root@ubuntu-s-1vcpu-2gb-lon1-01:~/local_installation# kubectl get pods,svc,pv
NAME                                     READY   STATUS              RESTARTS   AGE
pod/jupyter-k8s-udemy-79f7dd7ffc-kfzb7   1/1     Running             0          23h
pod/local-gogs-7b7cb96b7f-kqwp4          0/1     ContainerCreating   0          20s
pod/local-postgresql-0                   0/1     PodInitializing     0          20s

NAME                                TYPE        CLUSTER-IP       EXTERNAL-IP   PORT(S)                     AGE
service/jupyter-k8s-udemy           NodePort    100.64.248.5     <none>        8888:30040/TCP              1d
service/kubernetes                  ClusterIP   100.64.0.1       <none>        443/TCP                     1d
service/local-gogs                  NodePort    100.67.249.46    <none>        80:31243/TCP,22:30688/TCP   20s
service/local-postgresql            ClusterIP   100.64.246.239   <none>        5432/TCP                    20s
service/local-postgresql-headless   ClusterIP   None             <none>        5432/TCP                    20s

NAME                                                        CAPACITY   ACCESS MODES   RECLAIM POLICY   STATUS   CLAIM                             STORAGECLASS   REASON   AGE
persistentvolume/pvc-84039d38-431f-11e9-b1ba-023d0745758e   1Gi        RWO            Delete           Bound    default/data-local-postgresql-0   gp2                     51m
persistentvolume/pvc-b8da85d9-4326-11e9-b1ba-023d0745758e   1Gi        RWO            Delete           Bound    default/local-gogs                gp2                     20s
root@ubuntu-s-1vcpu-2gb-lon1-01:~/local_installation# kubectl get pods,svc,pv
NAME                                     READY   STATUS    RESTARTS   AGE
pod/jupyter-k8s-udemy-79f7dd7ffc-kfzb7   1/1     Running   0          23h
pod/local-gogs-7b7cb96b7f-kqwp4          0/1     Running   0          1m
pod/local-postgresql-0                   1/1     Running   0          1m

NAME                                TYPE        CLUSTER-IP       EXTERNAL-IP   PORT(S)                     AGE
service/jupyter-k8s-udemy           NodePort    100.64.248.5     <none>        8888:30040/TCP              1d
service/kubernetes                  ClusterIP   100.64.0.1       <none>        443/TCP                     1d
service/local-gogs                  NodePort    100.67.249.46    <none>        80:31243/TCP,22:30688/TCP   1m
service/local-postgresql            ClusterIP   100.64.246.239   <none>        5432/TCP                    1m
service/local-postgresql-headless   ClusterIP   None             <none>        5432/TCP                    1m

NAME                                                        CAPACITY   ACCESS MODES   RECLAIM POLICY   STATUS   CLAIM                             STORAGECLASS   REASON   AGE
persistentvolume/pvc-84039d38-431f-11e9-b1ba-023d0745758e   1Gi        RWO            Delete           Bound    default/data-local-postgresql-0   gp2                     52m
persistentvolume/pvc-b8da85d9-4326-11e9-b1ba-023d0745758e   1Gi        RWO            Delete           Bound    default/local-gogs                gp2                     1m
root@ubuntu-s-1vcpu-2gb-lon1-01:~/local_installation# kubectl get pods,svc,pv
NAME                                     READY   STATUS    RESTARTS   AGE
pod/jupyter-k8s-udemy-79f7dd7ffc-kfzb7   1/1     Running   0          23h
pod/local-gogs-7b7cb96b7f-kqwp4          0/1     Running   0          2m
pod/local-postgresql-0                   1/1     Running   0          2m

NAME                                TYPE        CLUSTER-IP       EXTERNAL-IP   PORT(S)                     AGE
service/jupyter-k8s-udemy           NodePort    100.64.248.5     <none>        8888:30040/TCP              1d
service/kubernetes                  ClusterIP   100.64.0.1       <none>        443/TCP                     1d
service/local-gogs                  NodePort    100.67.249.46    <none>        80:31243/TCP,22:30688/TCP   2m
service/local-postgresql            ClusterIP   100.64.246.239   <none>        5432/TCP                    2m
service/local-postgresql-headless   ClusterIP   None             <none>        5432/TCP                    2m

NAME                                                        CAPACITY   ACCESS MODES   RECLAIM POLICY   STATUS   CLAIM                             STORAGECLASS   REASON   AGE
persistentvolume/pvc-84039d38-431f-11e9-b1ba-023d0745758e   1Gi        RWO            Delete           Bound    default/data-local-postgresql-0   gp2                     53m
persistentvolume/pvc-b8da85d9-4326-11e9-b1ba-023d0745758e   1Gi        RWO            Delete           Bound    default/local-gogs                gp2                     2m
- it is still not working. The age of the
persistentvolume/pvc-84039d38-431f-11e9-b1ba-023d0745758epod is53m. It should have been created again.
- Remove the current deployment and ensure the volumen is completely deleted and create it again.
root@ubuntu-s-1vcpu-2gb-lon1-01:~/local_installation# helm delete local --purge
release "local" deleted
root@ubuntu-s-1vcpu-2gb-lon1-01:~/local_installation# kubectl get pods,svc,pv
NAME                                     READY   STATUS    RESTARTS   AGE
pod/jupyter-k8s-udemy-79f7dd7ffc-kfzb7   1/1     Running   0          23h

NAME                        TYPE        CLUSTER-IP     EXTERNAL-IP   PORT(S)          AGE
service/jupyter-k8s-udemy   NodePort    100.64.248.5   <none>        8888:30040/TCP   1d
service/kubernetes          ClusterIP   100.64.0.1     <none>        443/TCP          1d

NAME                                                        CAPACITY   ACCESS MODES   RECLAIM POLICY   STATUS   CLAIM                             STORAGECLASS   REASON   AGE
persistentvolume/pvc-84039d38-431f-11e9-b1ba-023d0745758e   1Gi        RWO            Delete           Bound    default/data-local-postgresql-0   gp2                     1h
persistentvolume/pvc-b8da85d9-4326-11e9-b1ba-023d0745758e   1Gi        RWO            Delete           Failed   default/local-gogs                gp2                     9m
root@ubuntu-s-1vcpu-2gb-lon1-01:~/local_installation# kubectl get pods,svc,pv
NAME                                     READY   STATUS    RESTARTS   AGE
pod/jupyter-k8s-udemy-79f7dd7ffc-kfzb7   1/1     Running   0          23h

NAME                        TYPE        CLUSTER-IP     EXTERNAL-IP   PORT(S)          AGE
service/jupyter-k8s-udemy   NodePort    100.64.248.5   <none>        8888:30040/TCP   1d
service/kubernetes          ClusterIP   100.64.0.1     <none>        443/TCP          1d

NAME                                                        CAPACITY   ACCESS MODES   RECLAIM POLICY   STATUS   CLAIM                             STORAGECLASS   REASON   AGE
persistentvolume/pvc-84039d38-431f-11e9-b1ba-023d0745758e   1Gi        RWO            Delete           Bound    default/data-local-postgresql-0   gp2                     1h
- The
persistentvolume/pvc-84039d38-431f-11e9-b1ba-023d0745758ehas not been removed.
root@ubuntu-s-1vcpu-2gb-lon1-01:~/local_installation# kubectl delete persistentvolume/pvc-84039d38-431f-11e9-b1ba-023d0745758e
persistentvolume "pvc-84039d38-431f-11e9-b1ba-023d0745758e" deleted
root@ubuntu-s-1vcpu-2gb-lon1-01:~/local_installation# kubectl get pods,svc,pv
NAME                                     READY   STATUS    RESTARTS   AGE
pod/jupyter-k8s-udemy-79f7dd7ffc-kfzb7   1/1     Running   0          23h

NAME                        TYPE        CLUSTER-IP     EXTERNAL-IP   PORT(S)          AGE
service/jupyter-k8s-udemy   NodePort    100.64.248.5   <none>        8888:30040/TCP   1d
service/kubernetes          ClusterIP   100.64.0.1     <none>        443/TCP          1d

NAME                                                        CAPACITY   ACCESS MODES   RECLAIM POLICY   STATUS        CLAIM                             STORAGECLASS   REASON   AGE
persistentvolume/pvc-84039d38-431f-11e9-b1ba-023d0745758e   1Gi        RWO            Delete           Terminating   default/data-local-postgresql-0   gp2                     1h
root@ubuntu-s-1vcpu-2gb-lon1-01:~/local_installation# kubectl get pods,svc,pv,pvc
NAME                                     READY   STATUS    RESTARTS   AGE
pod/jupyter-k8s-udemy-79f7dd7ffc-kfzb7   1/1     Running   0          23h

NAME                        TYPE        CLUSTER-IP     EXTERNAL-IP   PORT(S)          AGE
service/jupyter-k8s-udemy   NodePort    100.64.248.5   <none>        8888:30040/TCP   1d
service/kubernetes          ClusterIP   100.64.0.1     <none>        443/TCP          1d

NAME                                                        CAPACITY   ACCESS MODES   RECLAIM POLICY   STATUS        CLAIM                             STORAGECLASS   REASON   AGE
persistentvolume/pvc-84039d38-431f-11e9-b1ba-023d0745758e   1Gi        RWO            Delete           Terminating   default/data-local-postgresql-0   gp2                     1h

NAME                                            STATUS   VOLUME                                     CAPACITY   ACCESS MODES   STORAGECLASS   AGE
persistentvolumeclaim/data-local-postgresql-0   Bound    pvc-84039d38-431f-11e9-b1ba-023d0745758e   1Gi        RWO            gp2            1h
root@ubuntu-s-1vcpu-2gb-lon1-01:~/local_installation# kubectl delete persistentvolumeclaim/data-local-postgresql-0
persistentvolumeclaim "data-local-postgresql-0" deleted
root@ubuntu-s-1vcpu-2gb-lon1-01:~/local_installation# kubectl get pods,svc,pv,pvc
NAME                                     READY   STATUS    RESTARTS   AGE
pod/jupyter-k8s-udemy-79f7dd7ffc-kfzb7   1/1     Running   0          23h

NAME                        TYPE        CLUSTER-IP     EXTERNAL-IP   PORT(S)          AGE
service/jupyter-k8s-udemy   NodePort    100.64.248.5   <none>        8888:30040/TCP   1d
service/kubernetes          ClusterIP   100.64.0.1     <none>        443/TCP          1d
root@ubuntu-s-1vcpu-2gb-lon1-01:~/local_installation#
- Now that there are no pods related to the deployment, we are going to deploy it again:
root@ubuntu-s-1vcpu-2gb-lon1-01:~/local_installation# helm install --name local gogs
NAME:   local
LAST DEPLOYED: Sun Mar 10 11:42:53 2019
NAMESPACE: default
STATUS: DEPLOYED

RESOURCES:
==> v1/PersistentVolumeClaim
NAME        STATUS   VOLUME  CAPACITY  ACCESS MODES  STORAGECLASS  AGE
local-gogs  Pending  gp2     1s

==> v1/Service
NAME                       TYPE       CLUSTER-IP      EXTERNAL-IP  PORT(S)                    AGE
local-postgresql-headless  ClusterIP  None            <none>       5432/TCP                   1s
local-postgresql           ClusterIP  100.68.175.131  <none>       5432/TCP                   1s
local-gogs                 NodePort   100.66.116.89   <none>       80:30277/TCP,22:30159/TCP  1s

==> v1beta1/Deployment
NAME        DESIRED  CURRENT  UP-TO-DATE  AVAILABLE  AGE
local-gogs  1        1        1           0          1s

==> v1beta2/StatefulSet
NAME              DESIRED  CURRENT  AGE
local-postgresql  1        1        1s

==> v1/Pod(related)
NAME                         READY  STATUS   RESTARTS  AGE
local-gogs-7b7cb96b7f-7564z  0/1    Pending  0         1s
local-postgresql-0           0/1    Pending  0         1s

==> v1/Secret
NAME              TYPE    DATA  AGE
local-postgresql  Opaque  1     1s
local-gogs        Opaque  1     1s

==> v1/ConfigMap
NAME                DATA  AGE
tcp-local-gogs-ssh  1     1s
local-gogs-config   1     1s


NOTES:
1. Get the Gogs URL by running:

  export NODE_PORT=$(kubectl get --namespace default -o jsonpath="{.spec.ports[0].nodePort}" services local-gogs)
  export NODE_IP=$(kubectl get nodes --namespace default -o jsonpath="{.items[0].status.addresses[0].address}")
  echo http://$NODE_IP:$NODE_PORT/

2. Register a user.  The first user registered will be the administrator.
root@ubuntu-s-1vcpu-2gb-lon1-01:~/local_installation# kubectl get pods,svc,pv,pvc
NAME                                     READY   STATUS    RESTARTS   AGE
pod/jupyter-k8s-udemy-79f7dd7ffc-kfzb7   1/1     Running   0          23h
pod/local-gogs-7b7cb96b7f-7564z          0/1     Running   0          1m
pod/local-postgresql-0                   1/1     Running   0          1m

NAME                                TYPE        CLUSTER-IP       EXTERNAL-IP   PORT(S)                     AGE
service/jupyter-k8s-udemy           NodePort    100.64.248.5     <none>        8888:30040/TCP              1d
service/kubernetes                  ClusterIP   100.64.0.1       <none>        443/TCP                     1d
service/local-gogs                  NodePort    100.66.116.89    <none>        80:30277/TCP,22:30159/TCP   1m
service/local-postgresql            ClusterIP   100.68.175.131   <none>        5432/TCP                    1m
service/local-postgresql-headless   ClusterIP   None             <none>        5432/TCP                    1m

NAME                                                        CAPACITY   ACCESS MODES   RECLAIM POLICY   STATUS   CLAIM                             STORAGECLASS   REASON   AGE
persistentvolume/pvc-a421a118-4329-11e9-b1ba-023d0745758e   1Gi        RWO            Delete           Bound    default/local-gogs                gp2                     1m
persistentvolume/pvc-a4388eb2-4329-11e9-b1ba-023d0745758e   1Gi        RWO            Delete           Bound    default/data-local-postgresql-0   gp2                     1m

NAME                                            STATUS   VOLUME                                     CAPACITY   ACCESS MODES   STORAGECLASS   AGE
persistentvolumeclaim/data-local-postgresql-0   Bound    pvc-a4388eb2-4329-11e9-b1ba-023d0745758e   1Gi        RWO            gp2            1m
persistentvolumeclaim/local-gogs                Bound    pvc-a421a118-4329-11e9-b1ba-023d0745758e   1Gi        RWO            gp2            1m
root@ubuntu-s-1vcpu-2gb-lon1-01:~/local_installation# kubectl logs pod/local-gogs-7b7cb96b7f-7564z
usermod: no changes
init:socat  | Will not try to create socat links as requested
Mar 10 11:43:12 syslogd started: BusyBox v1.29.3
chown: /data/gogs/conf/app.ini: Read-only file system
/app/gogs/docker/sshd_config line 14: Deprecated option UsePrivilegeSeparation
Mar 10 11:43:13 sshd[27]: Server listening on :: port 22.
Mar 10 11:43:13 sshd[27]: Server listening on 0.0.0.0 port 22.
2019/03/10 11:43:17 [TRACE] Custom path: /data/gogs
2019/03/10 11:43:17 [TRACE] Log path: /app/gogs/log
2019/03/10 11:43:17 [TRACE] Build Time: 2019-01-31 03:38:34 UTC
2019/03/10 11:43:17 [TRACE] Build Git Hash: 06b6eaba060f8b874a4c2a8c84515b2ea45321d6
2019/03/10 11:43:17 [TRACE] Log Mode: Console (Trace)
2019/03/10 11:43:17 [ INFO] Gogs 0.11.86.0130
2019/03/10 11:43:17 [ INFO] Cache Service Enabled
2019/03/10 11:43:17 [ INFO] Session Service Enabled
root@ubuntu-s-1vcpu-2gb-lon1-01:~/local_installation#
- Enable the new
30277port.
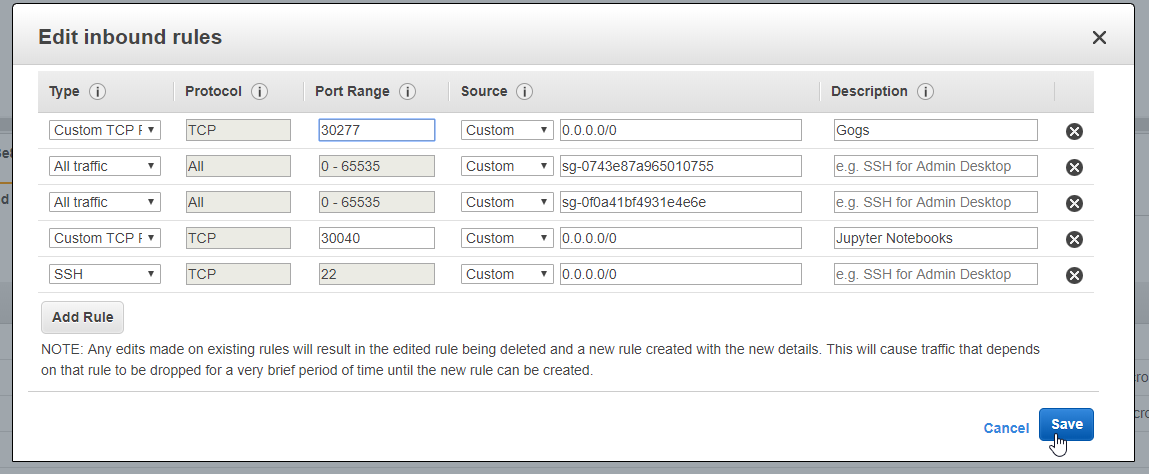
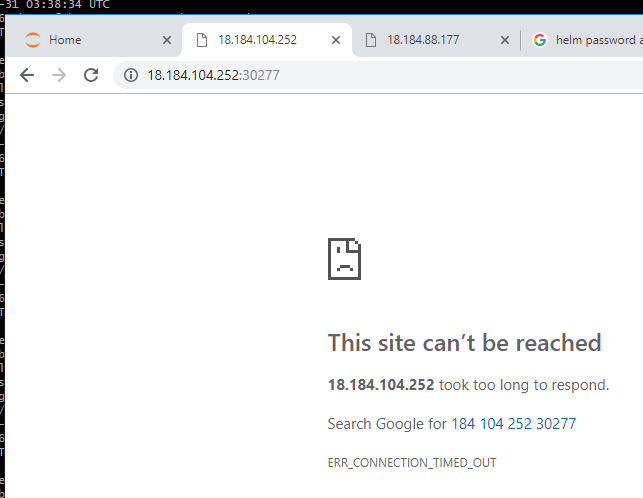
- It still not working and the problem is the same:
root@ubuntu-s-1vcpu-2gb-lon1-01:~/local_installation# kubectl logs pod/local-gogs-7b7cb96b7f-7564z
.
.
.
chown: /data/gogs/conf/app.ini: Read-only file system
2019/03/10 11:49:30 [TRACE] Custom path: /data/gogs
2019/03/10 11:49:30 [TRACE] Log path: /app/gogs/log
2019/03/10 11:49:30 [TRACE] Build Time: 2019-01-31 03:38:34 UTC
2019/03/10 11:49:30 [TRACE] Build Git Hash: 06b6eaba060f8b874a4c2a8c84515b2ea45321d6
2019/03/10 11:49:30 [TRACE] Log Mode: Console (Trace)
2019/03/10 11:49:30 [ INFO] Gogs 0.11.86.0130
2019/03/10 11:49:30 [ INFO] Cache Service Enabled
2019/03/10 11:49:30 [ INFO] Session Service Enabled
2019/03/10 11:49:30 [FATAL] [...gs/routes/install.go:66 GlobalInit()] Fail to initialize ORM engine: migrate: sync: pq: password authentication failed for user "gogs"
HowToDeployGogsFromLocalRepository7 HowToDeployGogsFromLocalRepository8 HowToDeployGogsFromLocalRepository9
32. Materials: How to understand persistentVolumeClaim and persistentVolumes
How to edit persistentVolumeClaim and persistentVolumes on the fly
Source: https://kubernetes.io/docs/tasks/administer-cluster/change-pv-reclaim-policy/
Choose one of your PersistentVolumes and change its reclaim policy:
kubectl patch pv <your-pv-name> -p '{"spec":{"persistentVolumeReclaimPolicy":"Retain"}}'
where <your-pv-name> is the name of your chosen PersistentVolume.
33. How to make your data persistent
- Remove the previous deployment
root@ubuntu-s-1vcpu-2gb-lon1-01:~/local_installation# helm delete local --purge
release "local" deleted
root@ubuntu-s-1vcpu-2gb-lon1-01:~/local_installation# kubectl get pods,svc,pv,pvc
NAME                                     READY   STATUS    RESTARTS   AGE
pod/jupyter-k8s-udemy-79f7dd7ffc-kfzb7   1/1     Running   0          23h

NAME                        TYPE        CLUSTER-IP     EXTERNAL-IP   PORT(S)          AGE
service/jupyter-k8s-udemy   NodePort    100.64.248.5   <none>        8888:30040/TCP   1d
service/kubernetes          ClusterIP   100.64.0.1     <none>        443/TCP          1d

NAME                                                        CAPACITY   ACCESS MODES   RECLAIM POLICY   STATUS   CLAIM                             STORAGECLASS   REASON   AGE
persistentvolume/pvc-a4388eb2-4329-11e9-b1ba-023d0745758e   1Gi        RWO            Delete           Bound    default/data-local-postgresql-0   gp2                     15m

NAME                                            STATUS   VOLUME                                     CAPACITY   ACCESS MODES   STORAGECLASS   AGE
persistentvolumeclaim/data-local-postgresql-0   Bound    pvc-a4388eb2-4329-11e9-b1ba-023d0745758e   1Gi        RWO            gp2            16m
root@ubuntu-s-1vcpu-2gb-lon1-01:~/local_installation# kubectl delete persistentvolumeclaim/data-local-postgresql-0
persistentvolumeclaim "data-local-postgresql-0" deleted
root@ubuntu-s-1vcpu-2gb-lon1-01:~/local_installation# kubectl get pods,svc,pv,pvc
NAME                                     READY   STATUS    RESTARTS   AGE
pod/jupyter-k8s-udemy-79f7dd7ffc-kfzb7   1/1     Running   0          23h

NAME                        TYPE        CLUSTER-IP     EXTERNAL-IP   PORT(S)          AGE
service/jupyter-k8s-udemy   NodePort    100.64.248.5   <none>        8888:30040/TCP   1d
service/kubernetes          ClusterIP   100.64.0.1     <none>        443/TCP          1d
root@ubuntu-s-1vcpu-2gb-lon1-01:~/local_installation# tree -L 5
.
+-- gogs
    +-- Chart.yaml
    +-- OWNERS
    +-- README.md
    +-- charts
    ¦   +-- postgresql
    ¦       +-- Chart.yaml
    ¦       +-- OWNERS
    ¦       +-- README.md
    ¦       +-- files
    ¦       ¦   +-- README.md
    ¦       ¦   +-- conf.d
    ¦       ¦   +-- docker-entrypoint-initdb.d
    ¦       +-- templates
    ¦       ¦   +-- NOTES.txt
    ¦       ¦   +-- _helpers.tpl
    ¦       ¦   +-- configmap.yaml
    ¦       ¦   +-- extended-config-configmap.yaml
    ¦       ¦   +-- initialization-configmap.yaml
    ¦       ¦   +-- metrics-svc.yaml
    ¦       ¦   +-- networkpolicy.yaml
    ¦       ¦   +-- secrets.yaml
    ¦       ¦   +-- statefulset-slaves.yaml
    ¦       ¦   +-- statefulset.yaml
    ¦       ¦   +-- svc-headless.yaml
    ¦       ¦   +-- svc-read.yaml
    ¦       ¦   +-- svc.yaml
    ¦       +-- values-production.yaml
    ¦       +-- values.yaml
    +-- requirements.lock
    +-- requirements.yaml
    +-- templates
    ¦   +-- NOTES.txt
    ¦   +-- _helpers.tpl
    ¦   +-- configmap-tcp.yaml
    ¦   +-- configmap.yaml
    ¦   +-- deployment.yaml
    ¦   +-- ingress.yaml
    ¦   +-- pvc.yaml
    ¦   +-- secrets.yaml
    ¦   +-- service.yaml
    +-- values.yaml

8 directories, 34 files
- Modify the
gogs/values.yamldocument again to leave it tosize: 3Gi
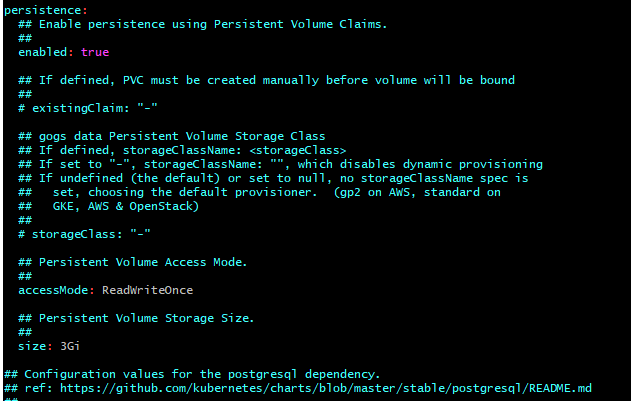
- Modify
gogs/charts/postgresql/values.yamlthe document again to leave it tosize: 2Gi
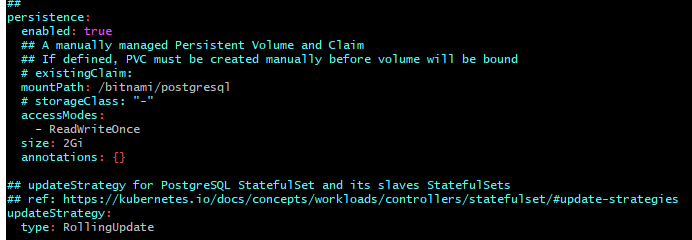
- Deploy it again with the command:
root@ubuntu-s-1vcpu-2gb-lon1-01:~/local_installation# helm install --name dstorage gogs
NAME:   dstorage
LAST DEPLOYED: Sun Mar 10 12:15:08 2019
NAMESPACE: default
STATUS: DEPLOYED

RESOURCES:
==> v1/Secret
NAME                 TYPE    DATA  AGE
dstorage-postgresql  Opaque  1     0s
dstorage-gogs        Opaque  1     0s

==> v1/ConfigMap
NAME                   DATA  AGE
tcp-dstorage-gogs-ssh  1     0s
dstorage-gogs-config   1     0s

==> v1/PersistentVolumeClaim
NAME           STATUS   VOLUME  CAPACITY  ACCESS MODES  STORAGECLASS  AGE
dstorage-gogs  Pending  gp2     0s

==> v1/Service
NAME                          TYPE       CLUSTER-IP     EXTERNAL-IP  PORT(S)                    AGE
dstorage-postgresql-headless  ClusterIP  None           <none>       5432/TCP                   0s
dstorage-postgresql           ClusterIP  100.69.166.47  <none>       5432/TCP                   0s
dstorage-gogs                 NodePort   100.69.50.56   <none>       80:31863/TCP,22:30007/TCP  0s

==> v1beta1/Deployment
NAME           DESIRED  CURRENT  UP-TO-DATE  AVAILABLE  AGE
dstorage-gogs  1        1        1           0          0s

==> v1beta2/StatefulSet
NAME                 DESIRED  CURRENT  AGE
dstorage-postgresql  1        1        0s

==> v1/Pod(related)
NAME                            READY  STATUS   RESTARTS  AGE
dstorage-gogs-56b4cb8ffc-bllfg  0/1    Pending  0         0s
dstorage-postgresql-0           0/1    Pending  0         0s


NOTES:
1. Get the Gogs URL by running:

  export NODE_PORT=$(kubectl get --namespace default -o jsonpath="{.spec.ports[0].nodePort}" services dstorage-gogs)
  export NODE_IP=$(kubectl get nodes --namespace default -o jsonpath="{.items[0].status.addresses[0].address}")
  echo http://$NODE_IP:$NODE_PORT/

2. Register a user.  The first user registered will be the administrator.
root@ubuntu-s-1vcpu-2gb-lon1-01:~/local_installation# kubectl get pods,svc,pv,pvc
NAME                                     READY   STATUS    RESTARTS   AGE
pod/dstorage-gogs-56b4cb8ffc-bllfg       0/1     Running   0          48s
pod/dstorage-postgresql-0                1/1     Running   0          48s
pod/jupyter-k8s-udemy-79f7dd7ffc-kfzb7   1/1     Running   0          1d

NAME                                   TYPE        CLUSTER-IP      EXTERNAL-IP   PORT(S)                     AGE
service/dstorage-gogs                  NodePort    100.69.50.56    <none>        80:31863/TCP,22:30007/TCP   48s
service/dstorage-postgresql            ClusterIP   100.69.166.47   <none>        5432/TCP                    48s
service/dstorage-postgresql-headless   ClusterIP   None            <none>        5432/TCP                    48s
service/jupyter-k8s-udemy              NodePort    100.64.248.5    <none>        8888:30040/TCP              1d
service/kubernetes                     ClusterIP   100.64.0.1      <none>        443/TCP                     1d

NAME                                                        CAPACITY   ACCESS MODES   RECLAIM POLICY   STATUS   CLAIM                                STORAGECLASS   REASON   AGE
persistentvolume/pvc-2569f71e-432e-11e9-b1ba-023d0745758e   3Gi        RWO            Delete           Bound    default/dstorage-gogs                gp2                     42s
persistentvolume/pvc-257ef973-432e-11e9-b1ba-023d0745758e   2Gi        RWO            Delete           Bound    default/data-dstorage-postgresql-0   gp2                     41s

NAME                                               STATUS   VOLUME                                     CAPACITY   ACCESS MODES   STORAGECLASS   AGE
persistentvolumeclaim/data-dstorage-postgresql-0   Bound    pvc-257ef973-432e-11e9-b1ba-023d0745758e   2Gi        RWO            gp2            48s
persistentvolumeclaim/dstorage-gogs                Bound    pvc-2569f71e-432e-11e9-b1ba-023d0745758e   3Gi        RWO            gp2            48s
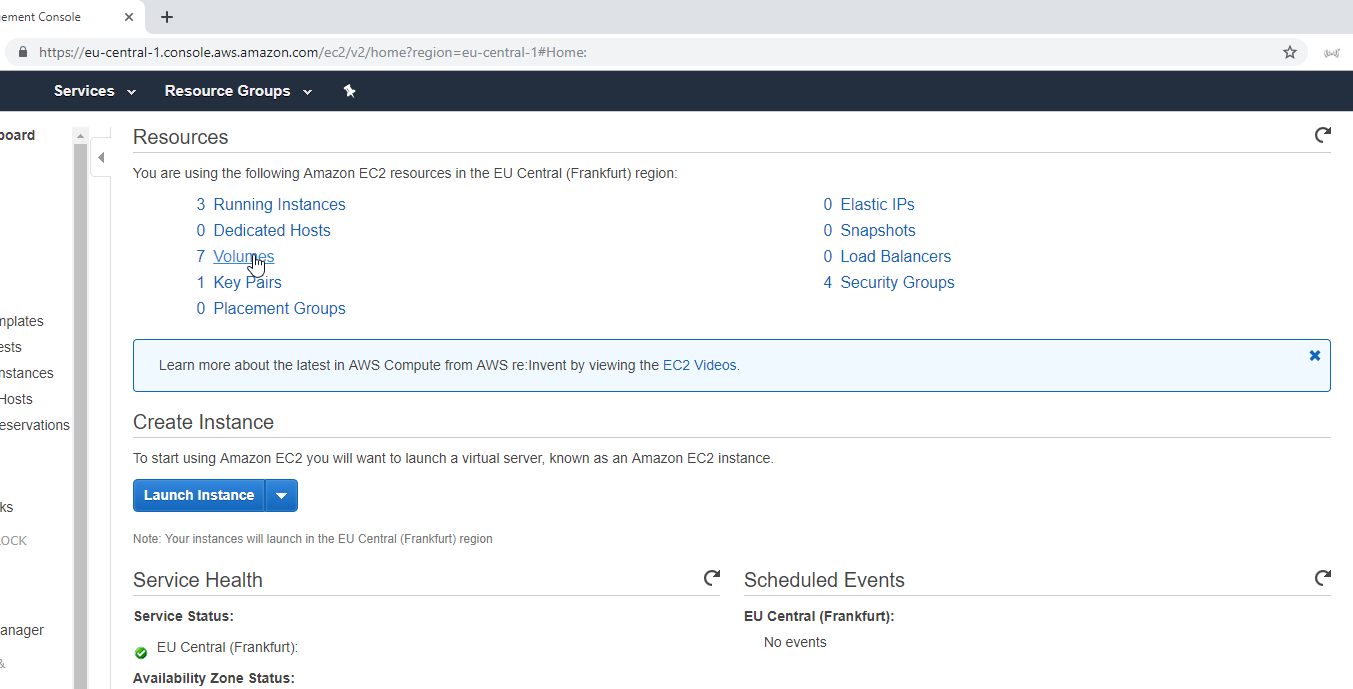

- We can change the policy from
DeletetoRetainto make the volumen always persistant
NAME                                                        CAPACITY   ACCESS MODES   RECLAIM POLICY   STATUS   CLAIM                                STORAGECLASS   REASON   AGE
persistentvolume/pvc-2569f71e-432e-11e9-b1ba-023d0745758e   3Gi        RWO            Delete           Bound    default/dstorage-gogs                gp2                     42s
persistentvolume/pvc-257ef973-432e-11e9-b1ba-023d0745758e   2Gi        RWO            Delete           Bound    default/data-dstorage-postgresql-0   gp2                     41s

NAME                                               STATUS   VOLUME                                     CAPACITY   ACCESS MODES   STORAGECLASS   AGE
persistentvolumeclaim/data-dstorage-postgresql-0   Bound    pvc-257ef973-432e-11e9-b1ba-023d0745758e   2Gi        RWO            gp2            48s
persistentvolumeclaim/dstorage-gogs                Bound    pvc-2569f71e-432e-11e9-b1ba-023d0745758e   3Gi        RWO            gp2            48s
root@ubuntu-s-1vcpu-2gb-lon1-01:~/local_installation# kubectl edit pv pvc-257ef973-432e-11e9-b1ba-023d0745758e
persistentvolume/pvc-257ef973-432e-11e9-b1ba-023d0745758e edited
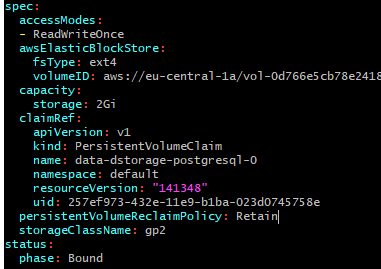
root@ubuntu-s-1vcpu-2gb-lon1-01:~/local_installation# kubectl get pods,svc,pv,pvc
NAME                                     READY   STATUS    RESTARTS   AGE
pod/dstorage-gogs-56b4cb8ffc-bllfg       0/1     Running   3          10m
pod/dstorage-postgresql-0                1/1     Running   0          10m
pod/jupyter-k8s-udemy-79f7dd7ffc-kfzb7   1/1     Running   0          1d

NAME                                   TYPE        CLUSTER-IP      EXTERNAL-IP   PORT(S)                     AGE
service/dstorage-gogs                  NodePort    100.69.50.56    <none>        80:31863/TCP,22:30007/TCP   10m
service/dstorage-postgresql            ClusterIP   100.69.166.47   <none>        5432/TCP                    10m
service/dstorage-postgresql-headless   ClusterIP   None            <none>        5432/TCP                    10m
service/jupyter-k8s-udemy              NodePort    100.64.248.5    <none>        8888:30040/TCP              1d
service/kubernetes                     ClusterIP   100.64.0.1      <none>        443/TCP                     1d

NAME                                                        CAPACITY   ACCESS MODES   RECLAIM POLICY   STATUS   CLAIM                                STORAGECLASS   REASON   AGE
persistentvolume/pvc-2569f71e-432e-11e9-b1ba-023d0745758e   3Gi        RWO            Delete           Bound    default/dstorage-gogs                gp2                     10m
persistentvolume/pvc-257ef973-432e-11e9-b1ba-023d0745758e   2Gi        RWO            Retain           Bound    default/data-dstorage-postgresql-0   gp2                     10m

NAME                                               STATUS   VOLUME                                     CAPACITY   ACCESS MODES   STORAGECLASS   AGE
persistentvolumeclaim/data-dstorage-postgresql-0   Bound    pvc-257ef973-432e-11e9-b1ba-023d0745758e   2Gi        RWO            gp2            10m
persistentvolumeclaim/dstorage-gogs                Bound    pvc-2569f71e-432e-11e9-b1ba-023d0745758e   3Gi        RWO            gp2            10m
- There is another way to change from
DeletetoRetain
root@ubuntu-s-1vcpu-2gb-lon1-01:~/local_installation# kubectl patch pv pvc-2569f71e-432e-11e9-b1ba-023d0745758e -p '{"spec":{"persistentVolumeReclaimPolicy":"Retain"}}'
persistentvolume/pvc-2569f71e-432e-11e9-b1ba-023d0745758e patched
root@ubuntu-s-1vcpu-2gb-lon1-01:~/local_installation# kubectl get pv
NAME                                       CAPACITY   ACCESS MODES   RECLAIM POLICY   STATUS   CLAIM                                STORAGECLASS   REASON   AGE
pvc-2569f71e-432e-11e9-b1ba-023d0745758e   3Gi        RWO            Retain           Bound    default/dstorage-gogs                gp2                     15m
pvc-257ef973-432e-11e9-b1ba-023d0745758e   2Gi        RWO            Retain           Bound    default/data-dstorage-postgresql-0   gp2                     15m
root@ubuntu-s-1vcpu-2gb-lon1-01:~/local_installation# helm delete dstorage --purge
release "dstorage" deleted
root@ubuntu-s-1vcpu-2gb-lon1-01:~/local_installation# kubectl get pv
NAME                                       CAPACITY   ACCESS MODES   RECLAIM POLICY   STATUS     CLAIM                                STORAGECLASS   REASON   AGE
pvc-2569f71e-432e-11e9-b1ba-023d0745758e   3Gi        RWO            Retain           Released   default/dstorage-gogs                gp2                     17m
pvc-257ef973-432e-11e9-b1ba-023d0745758e   2Gi        RWO            Retain           Bound      default/data-dstorage-postgresql-0   gp2                     17m
root@ubuntu-s-1vcpu-2gb-lon1-01:~/local_installation# kubectl get pv,pvc
NAME                                                        CAPACITY   ACCESS MODES   RECLAIM POLICY   STATUS        CLAIM                                STORAGECLASS   REASON   AGE
persistentvolume/pvc-257ef973-432e-11e9-b1ba-023d0745758e   2Gi        RWO            Retain           Terminating   default/data-dstorage-postgresql-0   gp2                     20m

NAME                                               STATUS   VOLUME                                     CAPACITY   ACCESS MODES   STORAGECLASS   AGE
persistentvolumeclaim/data-dstorage-postgresql-0   Bound    pvc-257ef973-432e-11e9-b1ba-023d0745758e   2Gi        RWO            gp2            20m
root@ubuntu-s-1vcpu-2gb-lon1-01:~/local_installation# kubectl delete pvc data-dstorage-postgresql-0
persistentvolumeclaim "data-dstorage-postgresql-0" deleted
root@ubuntu-s-1vcpu-2gb-lon1-01:~/local_installation# kubectl get pv,pvc
No resources found.
root@ubuntu-s-1vcpu-2gb-lon1-01:~/local_installation#
34. Lets summarize on Gogs helm chart deployment
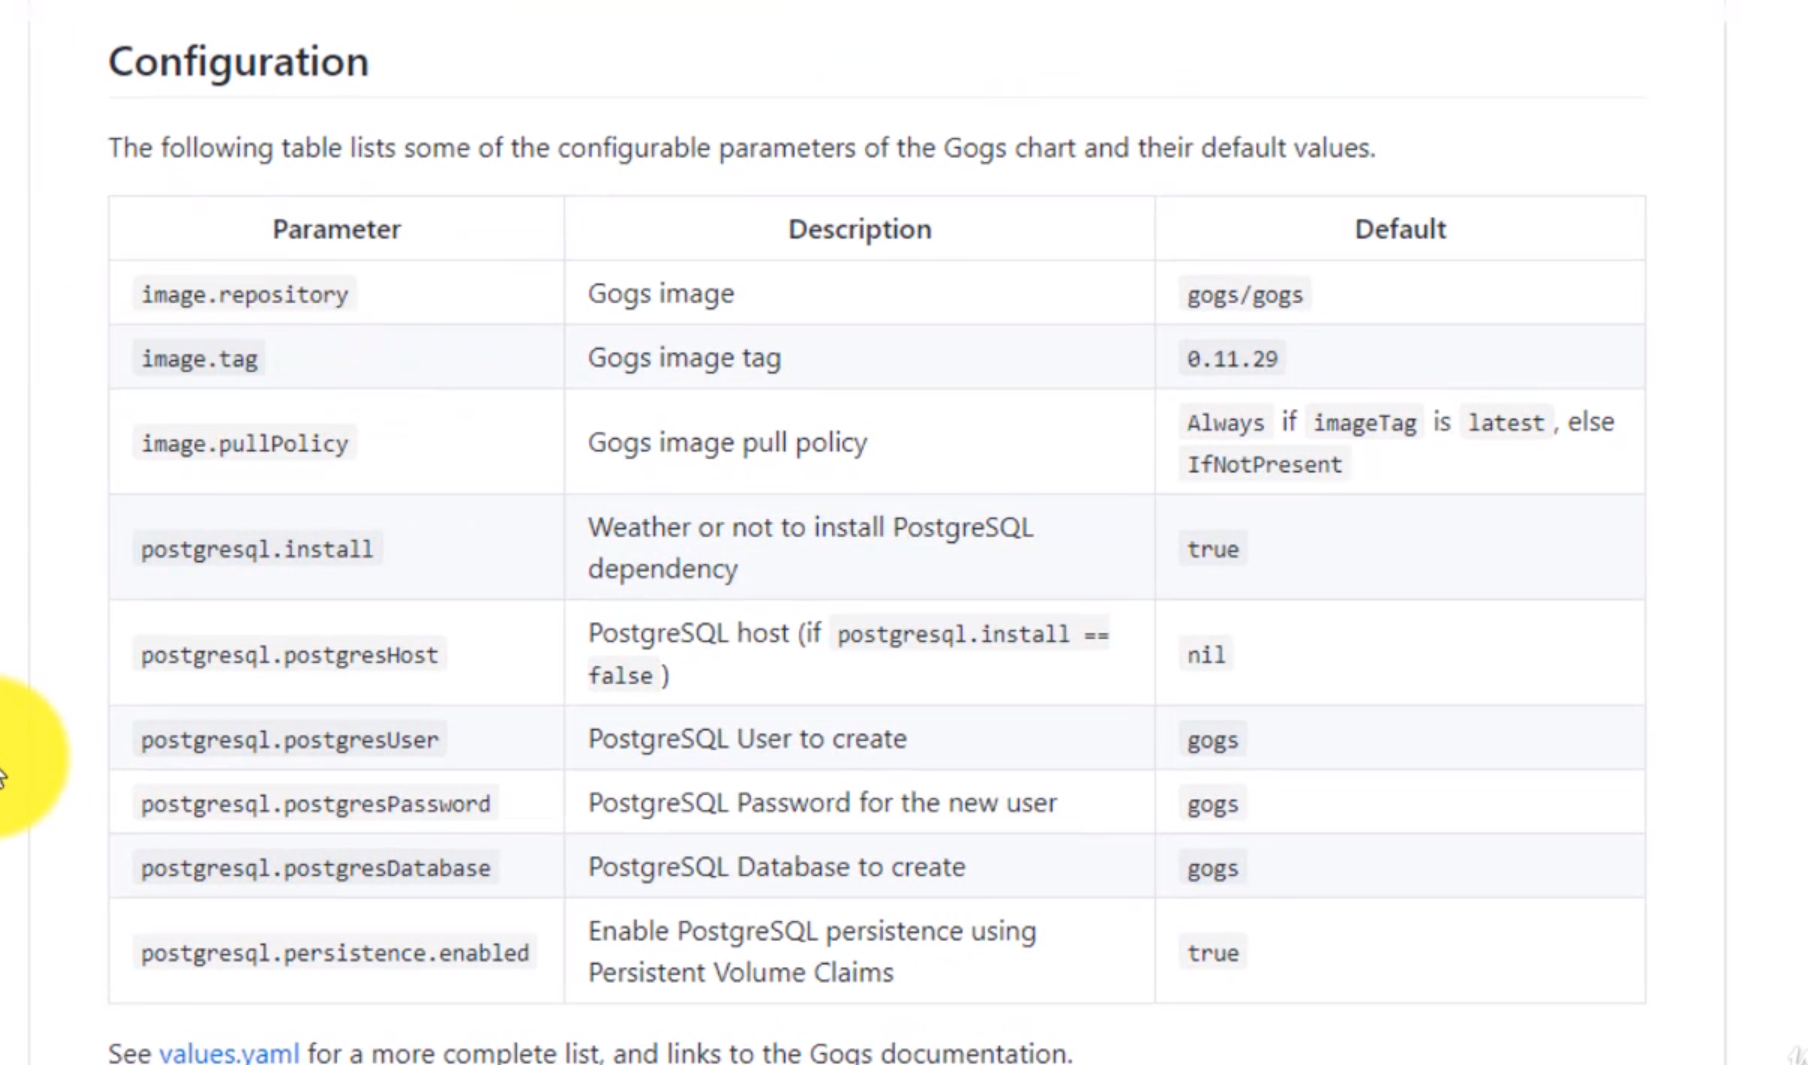
Section: 4. Exploring Helmfile deployment in Kubernetes
35. Materials: How to install HELMFILE binary to your machine
How to install HELMFILE binary to your Linux server
HELMFILE_VERSION=v0.20.0
HELMFILE_DOWNLOADED_FILENAME=helmfile_linux_amd64
HURL=https://github.com/roboll/helmfile/releases/download
HELMFILE_URL=${HURL}/${HELMFILE_VERSION}/${HELMFILE_DOWNLOADED_FILENAME}
HELMFILE_BIN=helmfile

function install_helmfile {

    if [ -z $(which $HELMFILE_BIN) ]
       then
           wget ${HELMFILE_URL}
           chmod +x ${HELMFILE_DOWNLOADED_FILENAME}
           sudo mv ${HELMFILE_DOWNLOADED_FILENAME} /usr/local/bin/${HELMFILE_BIN}
           echo -e "\nexecuting: which ${HELMFILE_BIN}"
           which ${HELMFILE_BIN}
    else
       echo "Helmfile is most likely installed"
    fi

}
36. Introduction to Helmfile
- Helmfile is used to deply
Kubernetes Helm Charts
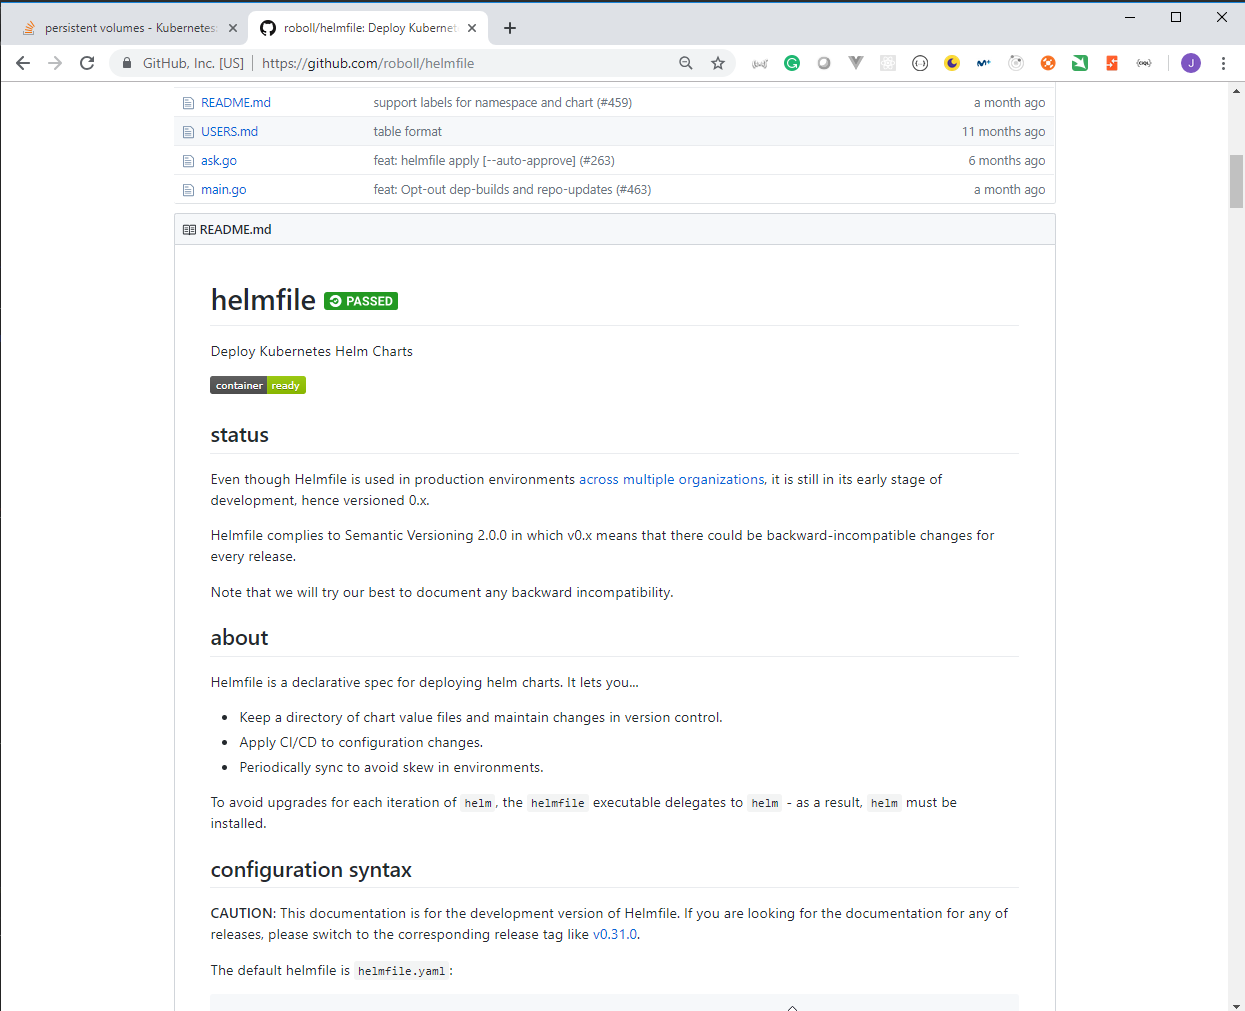
repositories- Where we specify where thehelm chartsare.context:Our kubernetes cluster context running.
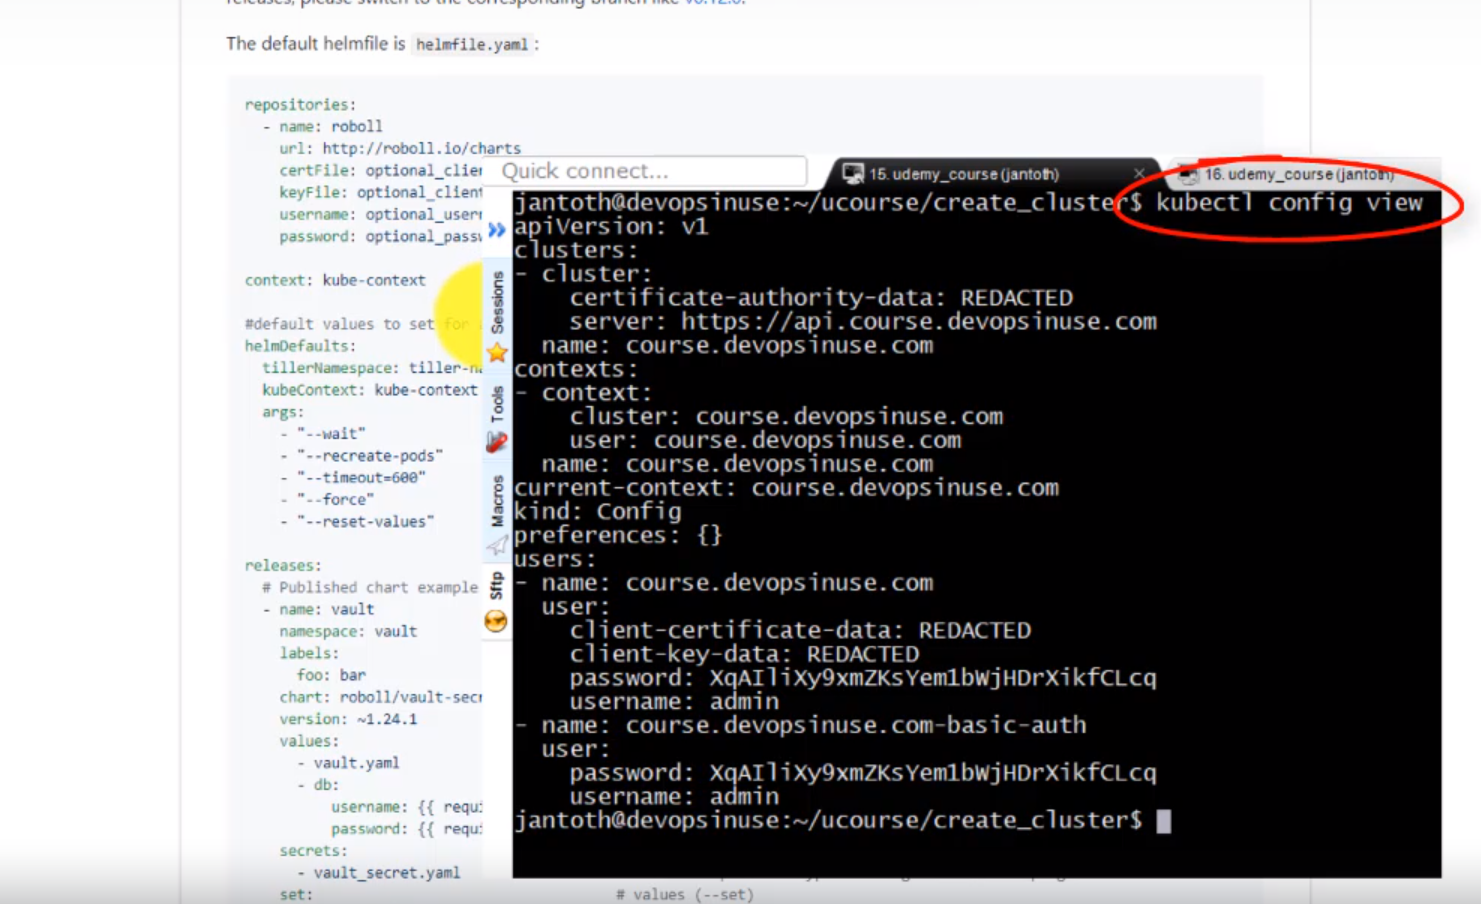
root@ubuntu-s-1vcpu-2gb-lon1-01:~# kubectl config view
apiVersion: v1
clusters:
- cluster:
    certificate-authority-data: DATA+OMITTED
    server: https://api.kops.peelmicro.com
  name: kops.peelmicro.com
contexts:
- context:
    cluster: kops.peelmicro.com
    user: kops.peelmicro.com
  name: kops.peelmicro.com
current-context: kops.peelmicro.com
kind: Config
preferences: {}
users:
- name: kops.peelmicro.com
  user:
    client-certificate-data: REDACTED
    client-key-data: REDACTED
    password: SuBXlxbB71dggNtiS8nl4lFdDY3Xxjis
    username: admin
- name: kops.peelmicro.com-basic-auth
  user:
    password: SuBXlxbB71dggNtiS8nl4lFdDY3Xxjis
    username: admin
root@ubuntu-s-1vcpu-2gb-lon1-01:~#
releases:is where we specify our releases or deployments. Thechart:is used to specify the helm chart we want to deploy. We usevalues:to overwrite the default values.
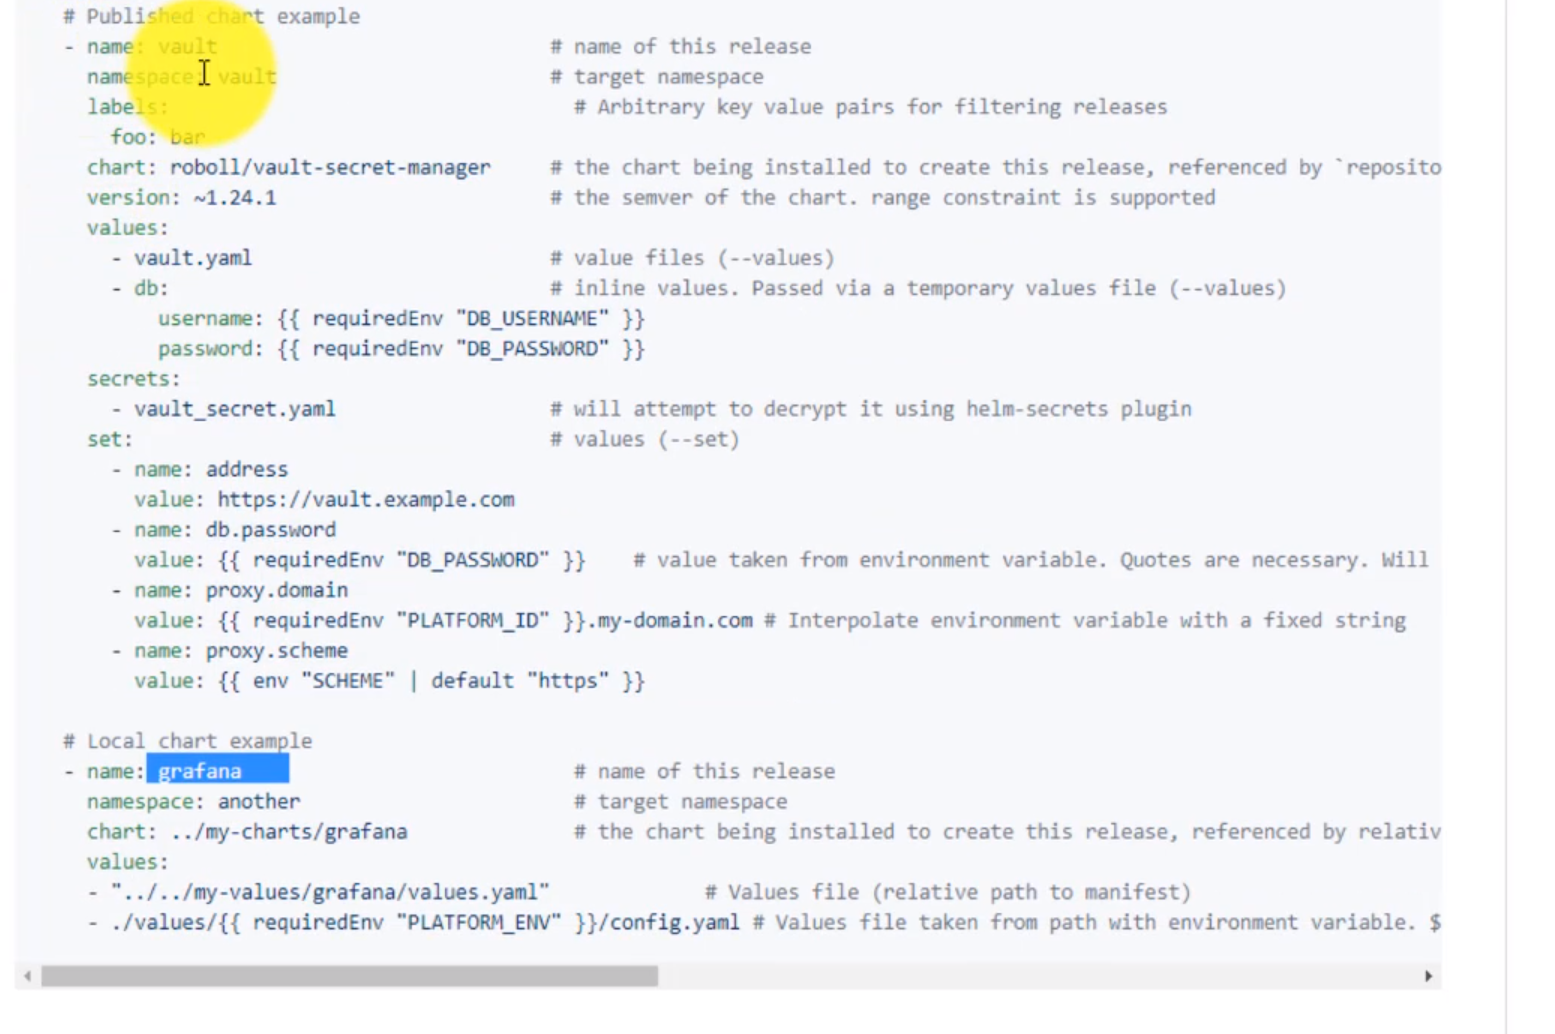
- We need to copy and paste the following code to install helmfile:
root@ubuntu-s-1vcpu-2gb-lon1-01:~# cd kops_cluster/
root@ubuntu-s-1vcpu-2gb-lon1-01:~/kops_cluster# HELMFILE_VERSION=v0.20.0
root@ubuntu-s-1vcpu-2gb-lon1-01:~/kops_cluster# HELMFILE_DOWNLOADED_FILENAME=helmfile_linux_amd64
root@ubuntu-s-1vcpu-2gb-lon1-01:~/kops_cluster# HURL=https://github.com/roboll/helmfile/releases/download
root@ubuntu-s-1vcpu-2gb-lon1-01:~/kops_cluster# HELMFILE_URL=${HURL}/${HELMFILE_VERSION}/${HELMFILE_DOWNLOADED_FILENAME}
root@ubuntu-s-1vcpu-2gb-lon1-01:~/kops_cluster# HELMFILE_BIN=helmfile
root@ubuntu-s-1vcpu-2gb-lon1-01:~/kops_cluster#
root@ubuntu-s-1vcpu-2gb-lon1-01:~/kops_cluster# function install_helmfile {
>
>     if [ -z $(which $HELMFILE_BIN) ]
>        then
>            wget ${HELMFILE_URL}
>            chmod +x ${HELMFILE_DOWNLOADED_FILENAME}
>            sudo mv ${HELMFILE_DOWNLOADED_FILENAME} /usr/local/bin/${HELMFILE_BIN}
>            echo -e "\nexecuting: which ${HELMFILE_BIN}"
>            which ${HELMFILE_BIN}
>     else
>        echo "Helmfile is most likely installed"
>     fi
>
> }
- Execute the
install_helmfilefunction:
root@ubuntu-s-1vcpu-2gb-lon1-01:~/kops_cluster# install_helmfile
--2019-03-10 15:40:12--  https://github.com/roboll/helmfile/releases/download/v0.20.0/helmfile_linux_amd64
Resolving github.com (github.com)... 192.30.253.113, 192.30.253.112
Connecting to github.com (github.com)|192.30.253.113|:443... connected.
HTTP request sent, awaiting response... 302 Found
Location: https://github-production-release-asset-2e65be.s3.amazonaws.com/74499101/57213fac-792e-11e8-8a53-1bc30c2279b7?X-Amz-Algorithm=AWS4-HMAC-SHA256&X-Amz-Credential=AKIAIWNJYAX4CSVEH53A%2F20190310%2Fus-east-1%2Fs3%2Faws4_request&X-Amz-Date=20190310T154013Z&X-Amz-Expires=300&X-Amz-Signature=b9e252911b10faaefd2a65e0d780be2364e7135cd756f3115d1092e7195900c4&X-Amz-SignedHeaders=host&actor_id=0&response-content-disposition=attachment%3B%20filename%3Dhelmfile_linux_amd64&response-content-type=application%2Foctet-stream [following]
--2019-03-10 15:40:13--  https://github-production-release-asset-2e65be.s3.amazonaws.com/74499101/57213fac-792e-11e8-8a53-1bc30c2279b7?X-Amz-Algorithm=AWS4-HMAC-SHA256&X-Amz-Credential=AKIAIWNJYAX4CSVEH53A%2F20190310%2Fus-east-1%2Fs3%2Faws4_request&X-Amz-Date=20190310T154013Z&X-Amz-Expires=300&X-Amz-Signature=b9e252911b10faaefd2a65e0d780be2364e7135cd756f3115d1092e7195900c4&X-Amz-SignedHeaders=host&actor_id=0&response-content-disposition=attachment%3B%20filename%3Dhelmfile_linux_amd64&response-content-type=application%2Foctet-stream
Resolving github-production-release-asset-2e65be.s3.amazonaws.com (github-production-release-asset-2e65be.s3.amazonaws.com)... 52.216.109.155
Connecting to github-production-release-asset-2e65be.s3.amazonaws.com (github-production-release-asset-2e65be.s3.amazonaws.com)|52.216.109.155|:443... connected.
HTTP request sent, awaiting response... 200 OK
Length: 7265096 (6.9M) [application/octet-stream]
Saving to: ‘helmfile_linux_amd64’

helmfile_linux_amd64                                                100%[==================================================================================================================================================================>]   6.93M  11.5MB/s    in 0.6s

2019-03-10 15:40:14 (11.5 MB/s) - ‘helmfile_linux_amd64’ saved [7265096/7265096]


executing: which helmfile
/usr/local/bin/helmfile
root@ubuntu-s-1vcpu-2gb-lon1-01:~/kops_cluster# helmfile
NAME:
   helmfile -

USAGE:
   helmfile [global options] command [command options] [arguments...]

VERSION:
   v0.20.0

COMMANDS:
     repos   sync repositories from state file (helm repo add && helm repo update)
     charts  sync charts from state file (helm upgrade --install)
     diff    diff charts from state file against env (helm diff)
     lint    lint charts from state file (helm lint)
     sync    sync all resources from state file (repos, charts and local chart deps)
     status  retrieve status of releases in state file
     delete  delete releases from state file (helm delete)
     test    test releases from state file (helm test)

GLOBAL OPTIONS:
   --file FILE, -f FILE         load config from FILE (default: "helmfile.yaml")
   --quiet, -q                  silence output
   --kube-context value         Set kubectl context. Uses current context by default
   --namespace value, -n value  Set namespace. Uses the namespace set in the context by default
   --selector value, -l value   Only run using the releases that match labels. Labels can take the form of foo=bar or foo!=bar.
                                A release must match all labels in a group in order to be used. Multiple groups can be specified at once.
                                --selector tier=frontend,tier!=proxy --selector tier=backend. Will match all frontend, non-proxy releases AND all backend releases.
                                The name of a release can be used as a label. --selector name=myrelease
   --help, -h                   show help
   --version, -v                print the version
** Install helmfile on Windows **
- We need to install Scoop: The command-line installer for Windows by executing the following command from a
PowerShellwindow:
Windows PowerShell
Copyright (C) Microsoft Corporation. All rights reserved.

PS C:\Windows\system32> iex (new-object net.webclient).downloadstring('https://get.scoop.sh')
PowerShell requires an execution policy of 'RemoteSigned' to run Scoop.
To make this change please run:
'Set-ExecutionPolicy RemoteSigned -scope CurrentUser'
PS C:\Windows\system32> Set-ExecutionPolicy RemoteSigned -scope CurrentUser

Execution Policy Change
The execution policy helps protect you from scripts that you do not trust. Changing the execution policy might expose
you to the security risks described in the about_Execution_Policies help topic at
https:/go.microsoft.com/fwlink/?LinkID=135170. Do you want to change the execution policy?
[Y] Yes  [A] Yes to All  [N] No  [L] No to All  [S] Suspend  [?] Help (default is "N"): Y
PS C:\Windows\system32> iex (new-object net.webclient).downloadstring('https://get.scoop.sh')
Initializing...
Downloading...
Extracting...
Creating shim...
Adding ~\scoop\shims to your path.
Scoop was installed successfully!
Type 'scoop help' for instructions.
PS C:\Windows\system32>
- Execute the following command to install
helmfile:
PS C:\Windows\system32> scoop install helmfile
Installing 'helmfile' (0.45.3) [64bit]
helmfile_windows_amd64.exe (10.2 MB) [========================================================================] 100%
Checking hash of helmfile_windows_amd64.exe ... ok.
Linking ~\scoop\apps\helmfile\current => ~\scoop\apps\helmfile\0.45.3
Creating shim for 'helmfile'.
'helmfile' (0.45.3) was installed successfully!
- Ensure it is working:
Microsoft Windows [Version 10.0.17763.195]
(c) 2018 Microsoft Corporation. All rights reserved.

C:\Windows\system32>helmfile
NAME:
   helmfile -

USAGE:
   helmfile.exe [global options] command [command options] [arguments...]

VERSION:
   v0.45.3

COMMANDS:
     repos     sync repositories from state file (helm repo add && helm repo update)
     charts    sync releases from state file (helm upgrade --install)
     diff      diff releases from state file against env (helm diff)
     template  template releases from state file against env (helm template)
     lint      lint charts from state file (helm lint)
     sync      sync all resources from state file (repos, releases and chart deps)
     apply     apply all resources from state file only when there are changes
     status    retrieve status of releases in state file
     delete    delete releases from state file (helm delete)
     test      test releases from state file (helm test)

GLOBAL OPTIONS:
   --helm-binary value, -b value           path to helm binary
   --file helmfile.yaml, -f helmfile.yaml  load config from file or directory. defaults to helmfile.yaml or `helmfile.d`(means `helmfile.d/*.yaml`) in this preference
   --environment default, -e default       specify the environment name. defaults to default
   --quiet, -q                             Silence output. Equivalent to log-level warn
   --kube-context value                    Set kubectl context. Uses current context by default
   --log-level value                       Set log level, default info
   --namespace value, -n value             Set namespace. Uses the namespace set in the context by default, and is available in templates as {{ .Namespace }}
   --selector value, -l value              Only run using the releases that match labels. Labels can take the form of foo=bar or foo!=bar.
                                           A release must match all labels in a group in order to be used. Multiple groups can be specified at once.
                                           --selector tier=frontend,tier!=proxy --selector tier=backend. Will match all frontend, non-proxy releases AND all backend releases.
                                           The name of a release can be used as a label. --selector name=myrelease
   --interactive, -i                       Request confirmation before attempting to modify clusters
   --help, -h                              show help
   --version, -v                           print the version


C:\Windows\system32>
37. How to deploy Jenkins by using Helmfile (Part 1)
- We can access Jenkins Helm Chart to see what we are going to install.
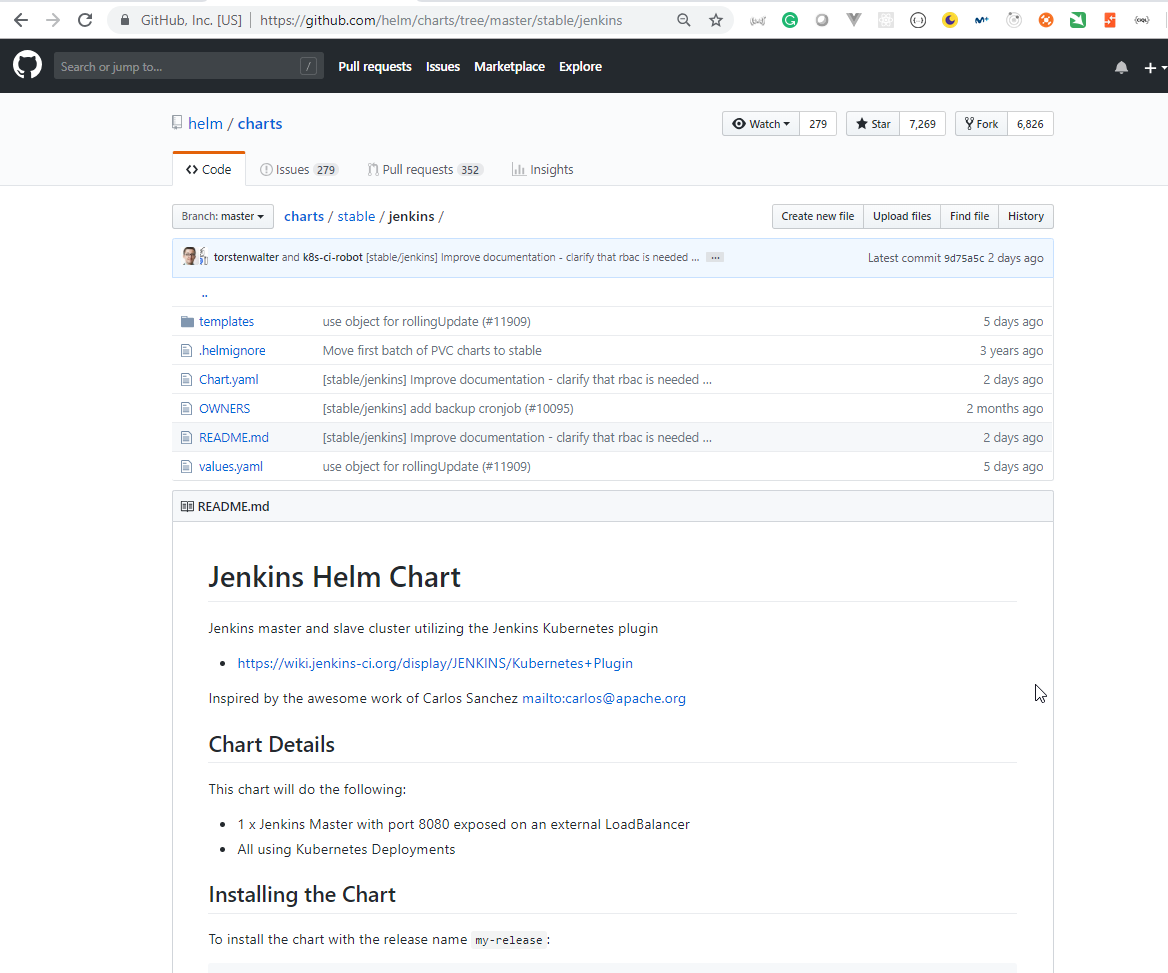
- Create the
jenkins_chartfolder and copy thestable/jenkinsfiles in it.
root@ubuntu-s-1vcpu-2gb-lon1-01:~# mkdir jenkins_chart
root@ubuntu-s-1vcpu-2gb-lon1-01:~# cd jenkins_chart
root@ubuntu-s-1vcpu-2gb-lon1-01:~/jenkins_chart# rsync -avhx ../charts/stable/jenkins .
sending incremental file list
jenkins/
jenkins/.helmignore
jenkins/Chart.yaml
jenkins/OWNERS
jenkins/README.md
jenkins/values.yaml
jenkins/templates/
jenkins/templates/NOTES.txt
jenkins/templates/_helpers.tpl
jenkins/templates/config.yaml
jenkins/templates/home-pvc.yaml
jenkins/templates/jcasc_config.yaml
jenkins/templates/jenkins-agent-svc.yaml
jenkins/templates/jenkins-backup-cronjob.yaml
jenkins/templates/jenkins-backup-rbac.yaml
jenkins/templates/jenkins-master-deployment.yaml
jenkins/templates/jenkins-master-ingress.yaml
jenkins/templates/jenkins-master-networkpolicy.yaml
jenkins/templates/jenkins-master-svc.yaml
jenkins/templates/jobs.yaml
jenkins/templates/rbac.yaml
jenkins/templates/secret.yaml
jenkins/templates/service-account.yaml
jenkins/templates/tests/
jenkins/templates/tests/jenkins-test.yaml
jenkins/templates/tests/test-config.yaml

sent 96.94K bytes  received 469 bytes  194.82K bytes/sec
total size is 95.17K  speedup is 0.98
root@ubuntu-s-1vcpu-2gb-lon1-01:~# mv jenkins_chart local_charts
root@ubuntu-s-1vcpu-2gb-lon1-01:~# cd local_charts/
root@ubuntu-s-1vcpu-2gb-lon1-01:~/local_charts# ls
jenkins
root@ubuntu-s-1vcpu-2gb-lon1-01:~/local_charts# ll jenkins
total 76
drwxr-xr-x 3 root root  4096 Mar 10 06:17 ./
drwxr-xr-x 3 root root  4096 Mar 10 16:04 ../
-rw-r--r-- 1 root root   333 Mar 10 06:17 .helmignore
-rwxr-xr-x 1 root root   712 Mar 10 06:17 Chart.yaml*
-rw-r--r-- 1 root root    90 Mar 10 06:17 OWNERS
-rw-r--r-- 1 root root 29897 Mar 10 06:17 README.md
drwxr-xr-x 3 root root  4096 Mar 10 06:17 templates/
-rw-r--r-- 1 root root 16963 Mar 10 06:17 values.yaml
- Copy the
values.yamltojenkins_custom_values.yaml
root@ubuntu-s-1vcpu-2gb-lon1-01:~/local_charts/jenkins# cp values.yaml jenkins_custom_values.yaml
- Create the
jenkins_udemy_helmfile.yamldocument.
jenkins_udemy_helmfile.yaml
context: kops.peelmicro:.com # kube-context (--kube-context)

releases:
  # Published chart example
  - name: jenkins-course-udemy # name of this release
    namespace: default # target namespace
    chart: stable/jenkins # repository/chart` syntax
    values:
      - ~/local_charts/jenkins/jenkins_custom_values.yaml # value files (--values)
    set: # values (--set)
      - name: Master.ServiceType
        value: NodePort
      - name: Master.NodePort
        value: 30477
      - name: Persistence.Size
        value: 2Gi
      - name: Master.AdminPassword
        value: <some_password>
      - name: rbac.install
        value: true
38. How to deploy Jenkins by using Helmfile (Part 2)
root@ubuntu-s-1vcpu-2gb-lon1-01:~/local_charts/jenkins# ll
total 100
drwxr-xr-x 3 root root  4096 Mar 10 16:54 ./
drwxr-xr-x 3 root root  4096 Mar 10 16:04 ../
-rw-r--r-- 1 root root   333 Mar 10 06:17 .helmignore
-rwxr-xr-x 1 root root   712 Mar 10 06:17 Chart.yaml*
-rw-r--r-- 1 root root    90 Mar 10 06:17 OWNERS
-rw-r--r-- 1 root root 29897 Mar 10 06:17 README.md
-rw-r--r-- 1 root root 16963 Mar 10 16:52 jenkins_custom_values.yaml
drwxr-xr-x 3 root root  4096 Mar 10 06:17 templates/
-rw-r--r-- 1 root root 16963 Mar 10 06:17 values.yaml
root@ubuntu-s-1vcpu-2gb-lon1-01:~/local_charts# ll
total 16
drwxr-xr-x  3 root root 4096 Mar 10 17:06 ./
drwx------ 19 root root 4096 Mar 10 16:54 ../
drwxr-xr-x  3 root root 4096 Mar 10 17:06 jenkins/
-rw-r--r--  1 root root  702 Mar 10 16:54 jenkins_udemy_helmfile.yaml
39. Materials: Create HELMFILE specification for Jenkins deployment
How to create HELMFILE specification for JENKINS deployment by using HELM charts
The context key word can be retrieved by running kubectl config view
Please create this file: jenkins_udemy_helmfile.yaml
context: course.<example>.com   # kube-context (--kube-context)

releases:
  # Published chart example
  - name: jenkins-course-udemy    # name of this release
    namespace: default            # target namespace
    chart: stable/jenkins         # repository/chart` syntax
    values:
      - /path/to/the/jenkins/jenkins_custom_values.yaml   # value files (--values)
    set:                                   # values (--set)
      - name: Master.ServiceType
        value: NodePort
      - name: Master.NodePort
        value: 30477
      - name: Persistence.Size
        value: 2Gi
      - name: Master.AdminPassword
        value: <some_password>
      - name: rbac.install
        value: true
Process HELMFILE deployment:
helmfile -f jenkins_udemy_helmfile.yaml sync
40. How to use helmfile to deploy Jenkins helm chart for the first time (Part 1)
- Check if we have anything deployed
root@ubuntu-s-1vcpu-2gb-lon1-01:~/local_charts# helm list a
root@ubuntu-s-1vcpu-2gb-lon1-01:~/local_charts#
root@ubuntu-s-1vcpu-2gb-lon1-01:~/local_charts# helmfile -f jenkins_udemy_helmfile.yaml sync
exec: helm repo update --kube-context kops.peelmicro:.com
Hang tight while we grab the latest from your chart repositories...
...Skip local chart repository
...Successfully got an update from the "incubator" chart repository
...Successfully got an update from the "stable" chart repository
Update Complete. ? Happy Helming!?
err: stat /root/local_charts/~/local_charts/jenkins/jenkins_custom_values.yaml: no such file or directory
- Modify the
jenkins_udemy_helmfile.yamldocument
jenkins_udemy_helmfile.yaml
context: kops.peelmicro.com # kube-context (--kube-context)

releases:
  # Published chart example
  - name: jenkins-course-udemy # name of this release
    namespace: default # target namespace
    chart: stable/jenkins # repository/chart` syntax
    values:
      - jenkins/jenkins_custom_values.yaml # value files (--values)
    set: # values (--set)
      - name: Master.ServiceType
        value: NodePort
      - name: Master.NodePort
        value: 30477
      - name: Persistence.Size
        value: 2Gi
      - name: Master.AdminPassword
        value: <some_password>
      - name: rbac.install
        value: true
root@ubuntu-s-1vcpu-2gb-lon1-01:~/local_charts# helmfile -f jenkins_udemy_helmfile.yaml sync
exec: helm repo update --kube-context kops.peelmicro.com
Hang tight while we grab the latest from your chart repositories...
...Skip local chart repository
...Successfully got an update from the "incubator" chart repository
...Successfully got an update from the "stable" chart repository
Update Complete. ? Happy Helming!?
exec: helm upgrade --install --reset-values jenkins-course-udemy stable/jenkins --namespace default --values /root/local_charts/jenkins/jenkins_custom_values.yaml --set Master.ServiceType=NodePort,Master.NodePort=30477,Persistence.Size=2Gi,Master.AdminPassword=<some_password>,rbac.install=true --kube-context kops.peelmicro.com
Release "jenkins-course-udemy" does not exist. Installing it now.
NAME:   jenkins-course-udemy
LAST DEPLOYED: Sun Mar 10 17:15:53 2019
NAMESPACE: default
STATUS: DEPLOYED

RESOURCES:
==> v1/ConfigMap
NAME                        DATA  AGE
jenkins-course-udemy        5     0s
jenkins-course-udemy-tests  1     0s

==> v1/PersistentVolumeClaim
NAME                  STATUS   VOLUME  CAPACITY  ACCESS MODES  STORAGECLASS  AGE
jenkins-course-udemy  Pending  gp2     0s

==> v1/ServiceAccount
NAME                  SECRETS  AGE
jenkins-course-udemy  1        0s

==> v1beta1/ClusterRoleBinding
NAME                               AGE
jenkins-course-udemy-role-binding  0s

==> v1/Service
NAME                        TYPE       CLUSTER-IP     EXTERNAL-IP  PORT(S)         AGE
jenkins-course-udemy-agent  ClusterIP  100.71.105.43  <none>       50000/TCP       0s
jenkins-course-udemy        NodePort   100.70.83.132  <none>       8080:30477/TCP  0s

==> v1/Deployment
NAME                  DESIRED  CURRENT  UP-TO-DATE  AVAILABLE  AGE
jenkins-course-udemy  1        1        1           0          0s

==> v1/Pod(related)
NAME                                   READY  STATUS   RESTARTS  AGE
jenkins-course-udemy-7588cc9f49-clztr  0/1    Pending  0         0s

==> v1/Secret
NAME                  TYPE    DATA  AGE
jenkins-course-udemy  Opaque  2     0s


NOTES:
1. Get your 'admin' user password by running:
  printf $(kubectl get secret --namespace default jenkins-course-udemy -o jsonpath="{.data.jenkins-admin-password}" | base64 --decode);echo
2. Get the Jenkins URL to visit by running these commands in the same shell:
  export NODE_PORT=$(kubectl get --namespace default -o jsonpath="{.spec.ports[0].nodePort}" services jenkins-course-udemy)
  export NODE_IP=$(kubectl get nodes --namespace default -o jsonpath="{.items[0].status.addresses[0].address}")
  echo http://$NODE_IP:$NODE_PORT/login

3. Login with the password from step 1 and the username: admin


For more information on running Jenkins on Kubernetes, visit:
https://cloud.google.com/solutions/jenkins-on-container-engine
Configure the Kubernetes plugin in Jenkins to use the following Service Account name jenkins-course-udemy using the following steps:
  Create a Jenkins credential of type Kubernetes service account with service account name jenkins-course-udemy
  Under configure Jenkins -- Update the credentials config in the cloud section to use the service account credential you created in the step above.
root@ubuntu-s-1vcpu-2gb-lon1-01:~# kubectl get pods,svc,pv,pvc
NAME                                        READY   STATUS    RESTARTS   AGE
pod/jenkins-course-udemy-7588cc9f49-clztr   1/1     Running   0          4m
pod/jupyter-k8s-udemy-79f7dd7ffc-kfzb7      1/1     Running   0          1d

NAME                                 TYPE        CLUSTER-IP      EXTERNAL-IP   PORT(S)          AGE
service/jenkins-course-udemy         NodePort    100.70.83.132   <none>        8080:30477/TCP   4m
service/jenkins-course-udemy-agent   ClusterIP   100.71.105.43   <none>        50000/TCP        4m
service/jupyter-k8s-udemy            NodePort    100.64.248.5    <none>        8888:30040/TCP   1d
service/kubernetes                   ClusterIP   100.64.0.1      <none>        443/TCP          1d

NAME                                                        CAPACITY   ACCESS MODES   RECLAIM POLICY   STATUS   CLAIM                          STORAGECLASS   REASON   AGE
persistentvolume/pvc-28d9be7a-4358-11e9-b1ba-023d0745758e   2Gi        RWO            Delete           Bound    default/jenkins-course-udemy   gp2                     4m

NAME                                         STATUS   VOLUME                                     CAPACITY   ACCESS MODES   STORAGECLASS   AGE
persistentvolumeclaim/jenkins-course-udemy   Bound    pvc-28d9be7a-4358-11e9-b1ba-023d0745758e   2Gi        RWO            gp2            4m
41. Materials: Useful commands Jenkins deployment
How to retrieve public IP addresses of our Kubernete cluster from cmd
aws ec2 describe-instances \
  --query "Reservations[*].Instances[*].PublicIpAddress" \
  --output=text
Simple Jenkins job shell script:
HELM_CHARTS=$(ls -al stable | wc -l)
echo -e "You have just cloned ${HELM_CHARTS} number of HELM CHARTS from github.com"
42. How to use helmfile to deploy Jenkins helm chart for the first time (Part 2)
- Open the
30477
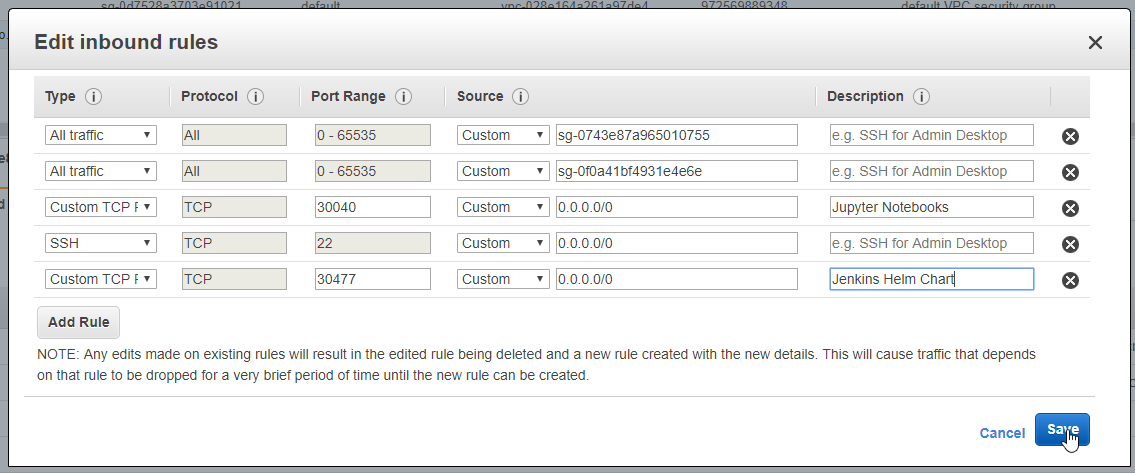
- Browse to http://18.184.104.252:30477
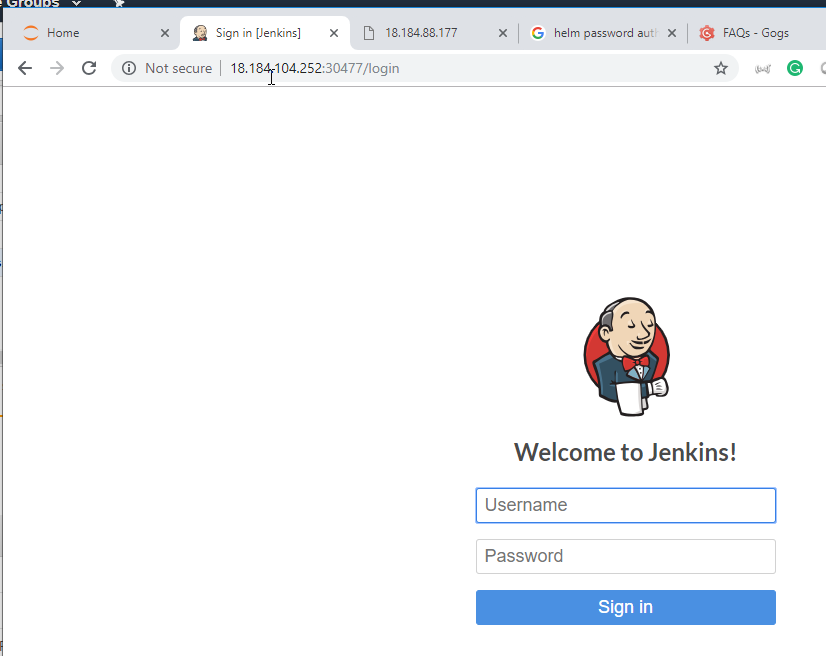
root@ubuntu-s-1vcpu-2gb-lon1-01:~# kubectl get all
NAME                                        READY   STATUS    RESTARTS   AGE
pod/jenkins-course-udemy-7588cc9f49-clztr   1/1     Running   0          8m
pod/jupyter-k8s-udemy-79f7dd7ffc-kfzb7      1/1     Running   0          1d

NAME                                 TYPE        CLUSTER-IP      EXTERNAL-IP   PORT(S)          AGE
service/jenkins-course-udemy         NodePort    100.70.83.132   <none>        8080:30477/TCP   8m
service/jenkins-course-udemy-agent   ClusterIP   100.71.105.43   <none>        50000/TCP        8m
service/jupyter-k8s-udemy            NodePort    100.64.248.5    <none>        8888:30040/TCP   1d
service/kubernetes                   ClusterIP   100.64.0.1      <none>        443/TCP          1d

NAME                                   DESIRED   CURRENT   UP-TO-DATE   AVAILABLE   AGE
deployment.apps/jenkins-course-udemy   1         1         1            1           8m
deployment.apps/jupyter-k8s-udemy      1         1         1            1           1d

NAME                                              DESIRED   CURRENT   READY   AGE
replicaset.apps/jenkins-course-udemy-7588cc9f49   1         1         1       8m
replicaset.apps/jupyter-k8s-udemy-79f7dd7ffc      1         1         1       1d
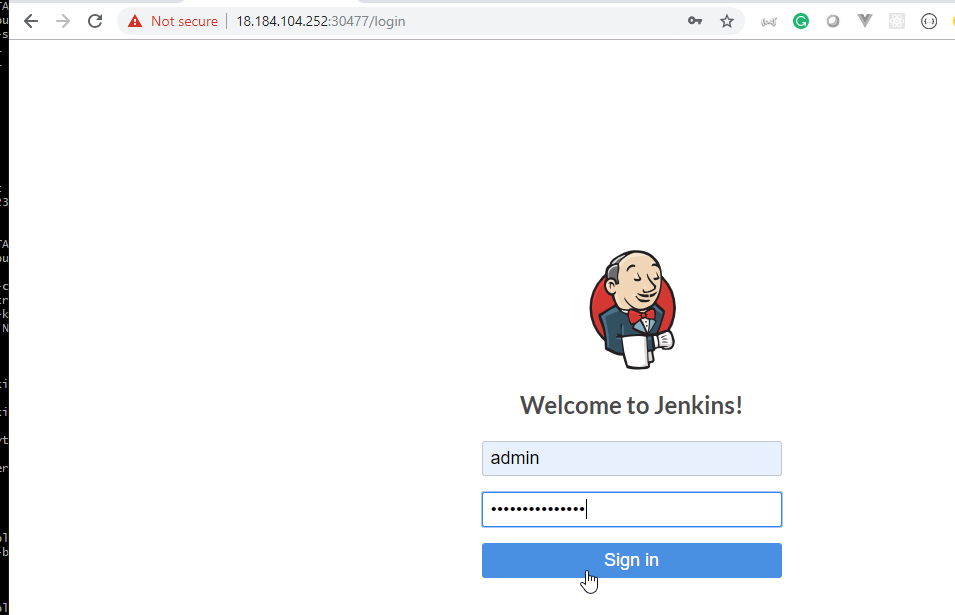
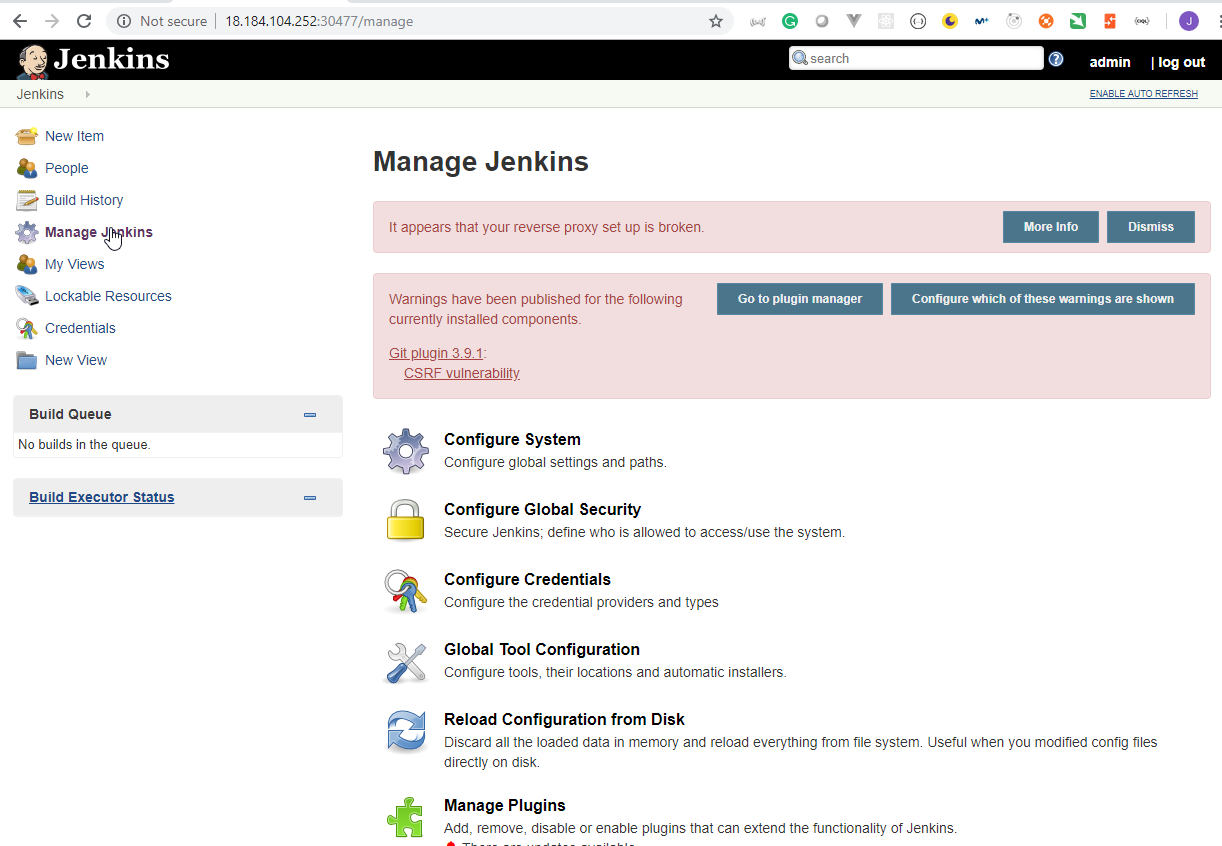

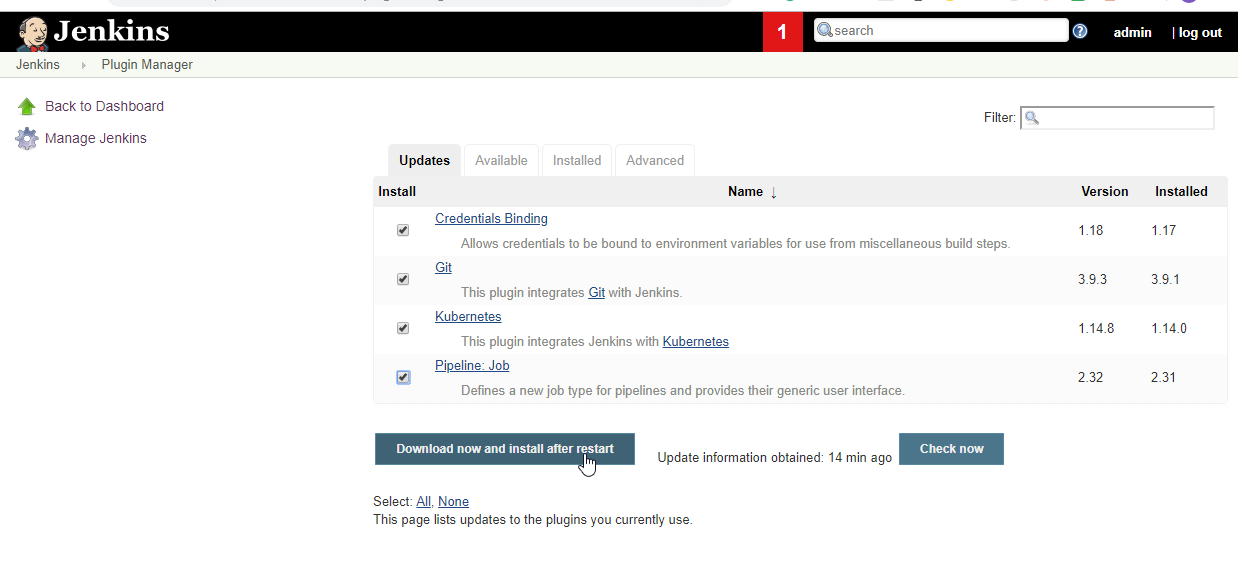
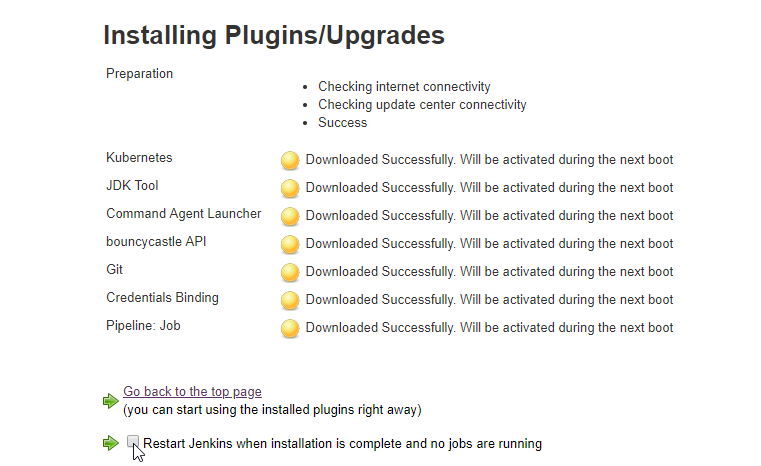
root@ubuntu-s-1vcpu-2gb-lon1-01:~# aws ec2 describe-instances   --query "Reservations[*].Instances[*].PublicIpAddress"   --output=text
root@ubuntu-s-1vcpu-2gb-lon1-01:~#
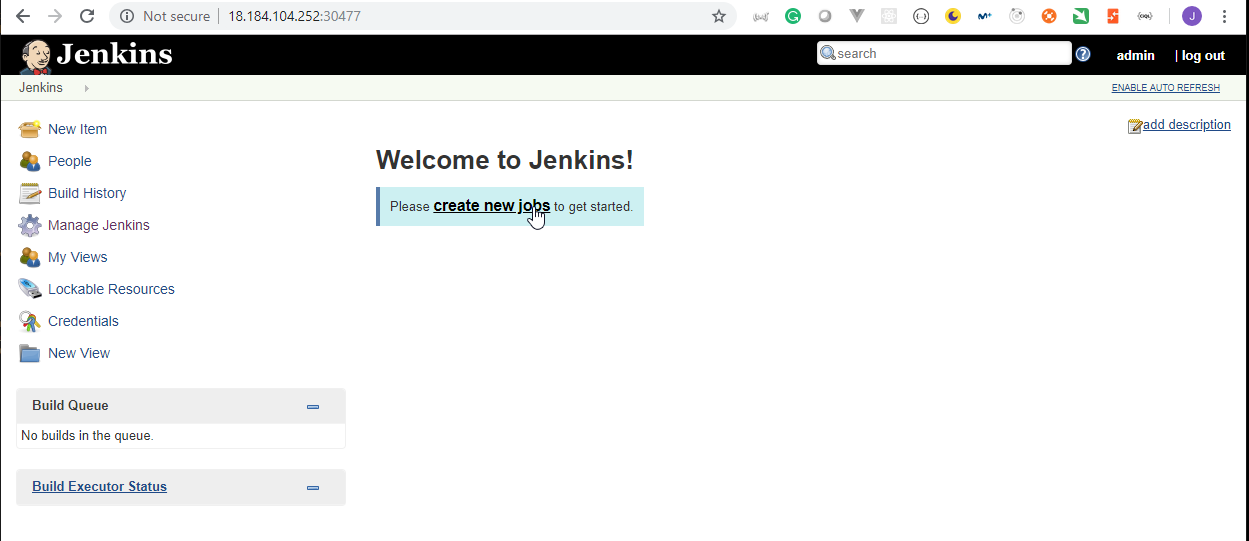
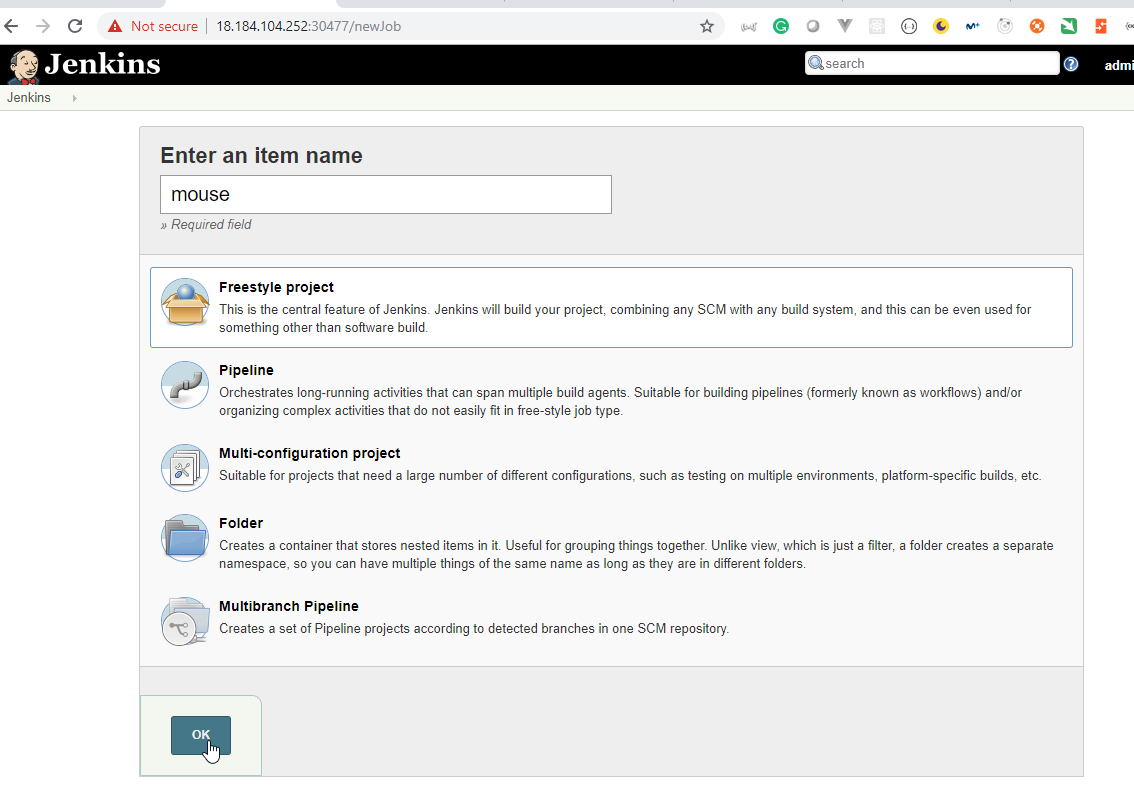
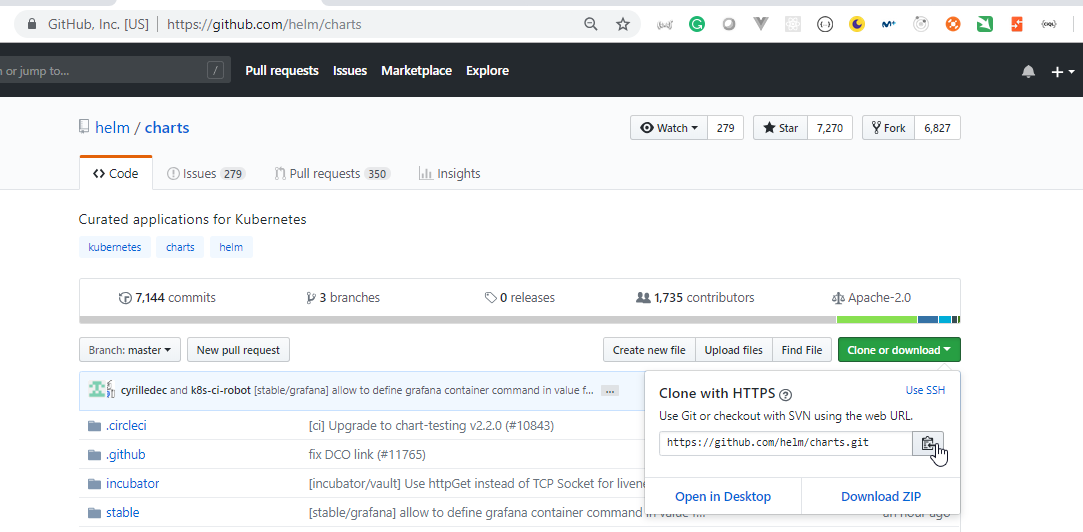
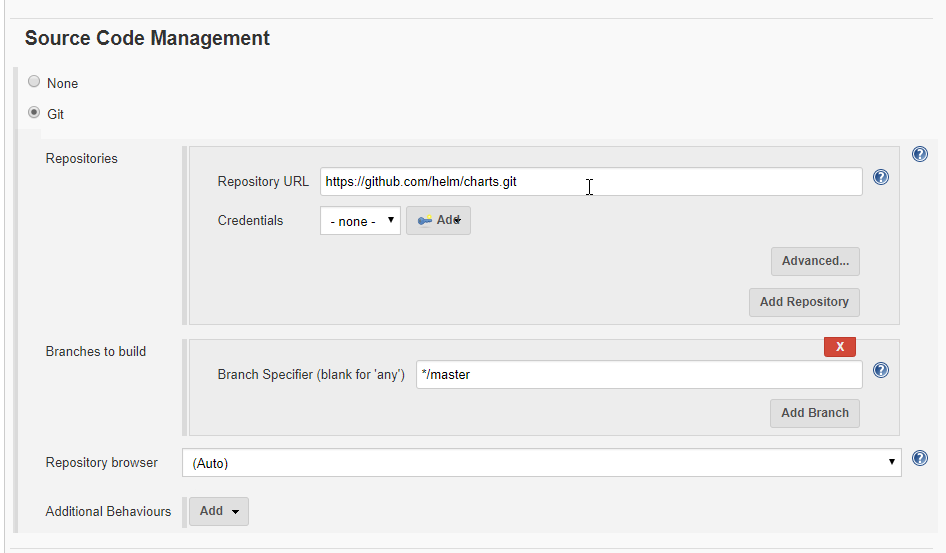
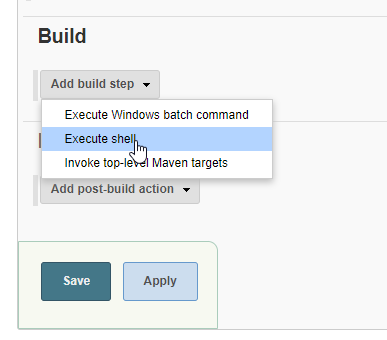
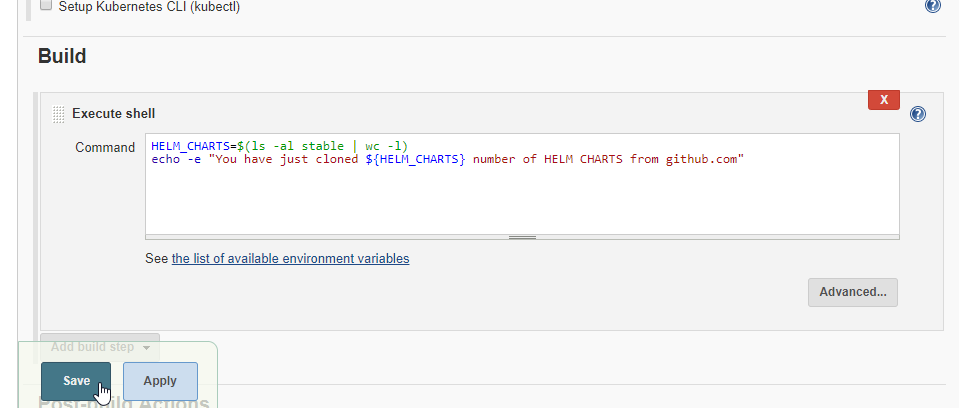
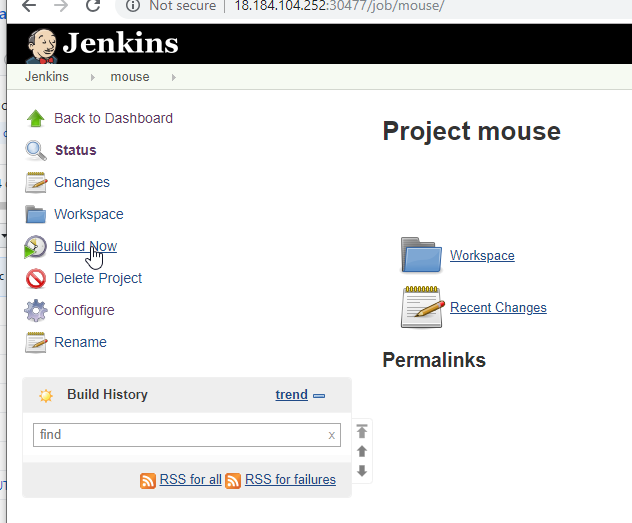
root@ubuntu-s-1vcpu-2gb-lon1-01:~# kubectl get pods
NAME                                    READY   STATUS    RESTARTS   AGE
default-704pg                           1/1     Running   0          40s
jenkins-course-udemy-7588cc9f49-clztr   1/1     Running   0          28m
jupyter-k8s-udemy-79f7dd7ffc-kfzb7      1/1     Running   0          1d
- There is only one pod running
root@ubuntu-s-1vcpu-2gb-lon1-01:~# kubectl get pods
NAME                                    READY   STATUS    RESTARTS   AGE
default-mmm5r                           1/1     Running   0          1m
jenkins-course-udemy-7588cc9f49-clztr   1/1     Running   0          30m
jupyter-k8s-udemy-79f7dd7ffc-kfzb7      1/1     Running   0          1d
root@ubuntu-s-1vcpu-2gb-lon1-01:~# kubectl logs default-mmm5r
Warning: JnlpProtocol3 is disabled by default, use JNLP_PROTOCOL_OPTS to alter the behavior
Warning: SECRET is defined twice in command-line arguments and the environment variable
Warning: AGENT_NAME is defined twice in command-line arguments and the environment variable
Mar 10, 2019 5:45:18 PM hudson.remoting.jnlp.Main createEngine
INFO: Setting up agent: default-mmm5r
Mar 10, 2019 5:45:18 PM hudson.remoting.jnlp.Main$CuiListener <init>
INFO: Jenkins agent is running in headless mode.
Mar 10, 2019 5:45:19 PM hudson.remoting.Engine startEngine
INFO: Using Remoting version: 3.27
Mar 10, 2019 5:45:19 PM hudson.remoting.Engine startEngine
WARNING: No Working Directory. Using the legacy JAR Cache location: /home/jenkins/.jenkins/cache/jars
Mar 10, 2019 5:45:20 PM hudson.remoting.jnlp.Main$CuiListener status
INFO: Locating server among [http://jenkins-course-udemy:8080]
Mar 10, 2019 5:45:20 PM org.jenkinsci.remoting.engine.JnlpAgentEndpointResolver resolve
INFO: Remoting server accepts the following protocols: [JNLP4-connect, Ping]
Mar 10, 2019 5:45:20 PM org.jenkinsci.remoting.engine.JnlpAgentEndpointResolver resolve
INFO: Remoting TCP connection tunneling is enabled. Skipping the TCP Agent Listener Port availability check
Mar 10, 2019 5:45:20 PM hudson.remoting.jnlp.Main$CuiListener status
INFO: Agent discovery successful
  Agent address: jenkins-course-udemy-agent
  Agent port:    50000
  Identity:      79:db:c2:b1:32:c5:ed:e8:9f:e7:76:33:ef:96:cc:2d
Mar 10, 2019 5:45:20 PM hudson.remoting.jnlp.Main$CuiListener status
INFO: Handshaking
Mar 10, 2019 5:45:20 PM hudson.remoting.jnlp.Main$CuiListener status
INFO: Connecting to jenkins-course-udemy-agent:50000
Mar 10, 2019 5:45:20 PM hudson.remoting.jnlp.Main$CuiListener status
INFO: Trying protocol: JNLP4-connect
Mar 10, 2019 5:45:22 PM hudson.remoting.jnlp.Main$CuiListener status
INFO: Remote identity confirmed: 79:db:c2:b1:32:c5:ed:e8:9f:e7:76:33:ef:96:cc:2d
Mar 10, 2019 5:45:27 PM hudson.remoting.jnlp.Main$CuiListener status
INFO: Connected
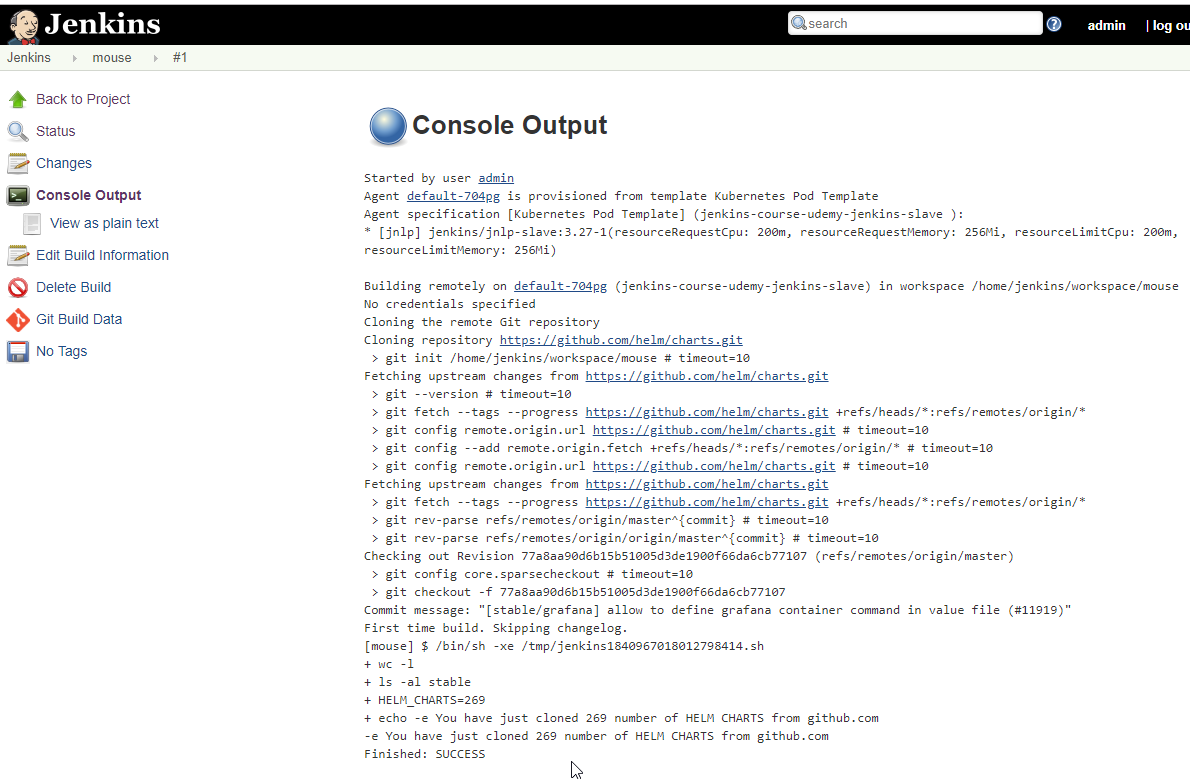
Console Output
Started by user admin
Agent default-704pg is provisioned from template Kubernetes Pod Template
Agent specification [Kubernetes Pod Template] (jenkins-course-udemy-jenkins-slave ):
* [jnlp] jenkins/jnlp-slave:3.27-1(resourceRequestCpu: 200m, resourceRequestMemory: 256Mi, resourceLimitCpu: 200m, resourceLimitMemory: 256Mi)

Building remotely on default-704pg (jenkins-course-udemy-jenkins-slave) in workspace /home/jenkins/workspace/mouse
No credentials specified
Cloning the remote Git repository
Cloning repository https://github.com/helm/charts.git
 > git init /home/jenkins/workspace/mouse # timeout=10
Fetching upstream changes from https://github.com/helm/charts.git
 > git --version # timeout=10
 > git fetch --tags --progress https://github.com/helm/charts.git +refs/heads/*:refs/remotes/origin/*
 > git config remote.origin.url https://github.com/helm/charts.git # timeout=10
 > git config --add remote.origin.fetch +refs/heads/*:refs/remotes/origin/* # timeout=10
 > git config remote.origin.url https://github.com/helm/charts.git # timeout=10
Fetching upstream changes from https://github.com/helm/charts.git
 > git fetch --tags --progress https://github.com/helm/charts.git +refs/heads/*:refs/remotes/origin/*
 > git rev-parse refs/remotes/origin/master^{commit} # timeout=10
 > git rev-parse refs/remotes/origin/origin/master^{commit} # timeout=10
Checking out Revision 77a8aa90d6b15b51005d3de1900f66da6cb77107 (refs/remotes/origin/master)
 > git config core.sparsecheckout # timeout=10
 > git checkout -f 77a8aa90d6b15b51005d3de1900f66da6cb77107
Commit message: "[stable/grafana] allow to define grafana container command in value file (#11919)"
First time build. Skipping changelog.
[mouse] $ /bin/sh -xe /tmp/jenkins1840967018012798414.sh
+ wc -l
+ ls -al stable
+ HELM_CHARTS=269
+ echo -e You have just cloned 269 number of HELM CHARTS from github.com
-e You have just cloned 269 number of HELM CHARTS from github.com
Finished: SUCCESS
Section: 5. Grafana and Prometheus HELMFILE deployment
43. Introduction to Prometheus and Grafana deployment by using helmfile (Grafana)
Grafana is an open source metric analytics & visualization suite. It is most commonly used for visualizing time series data for infrastructure and application analytics but many use it in other domains including industrial sensors, home automation, weather, and process control.
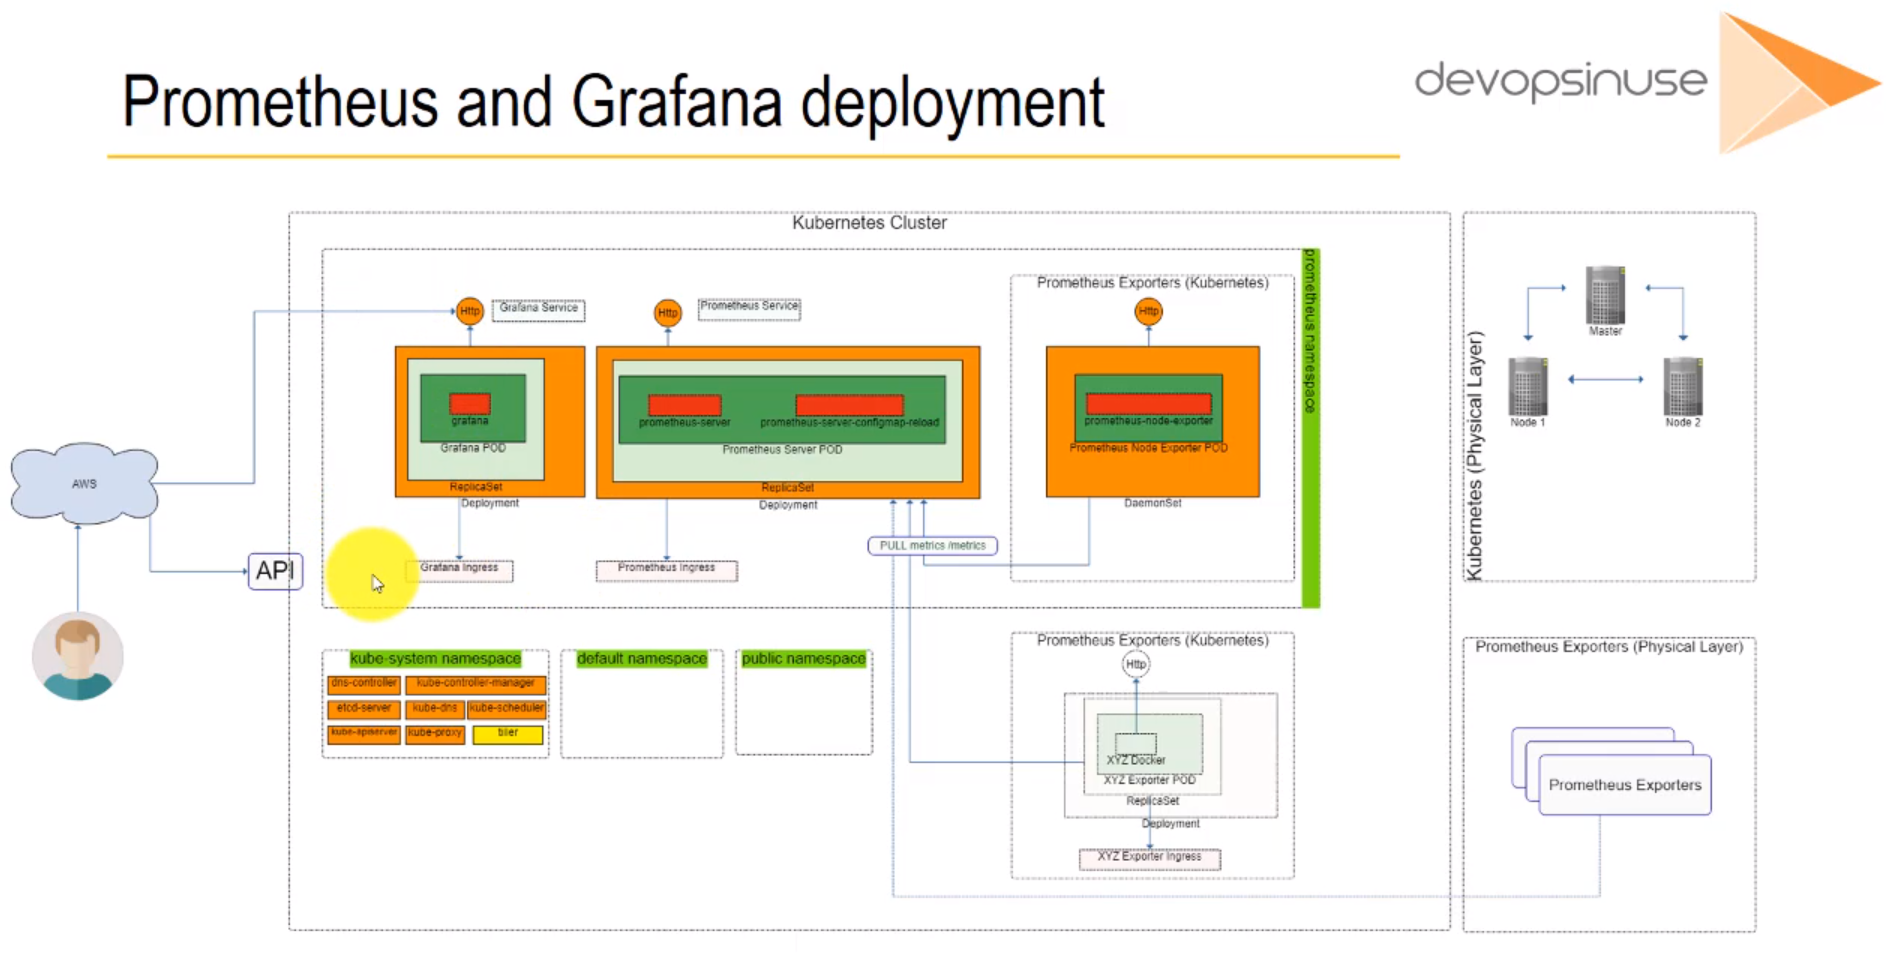
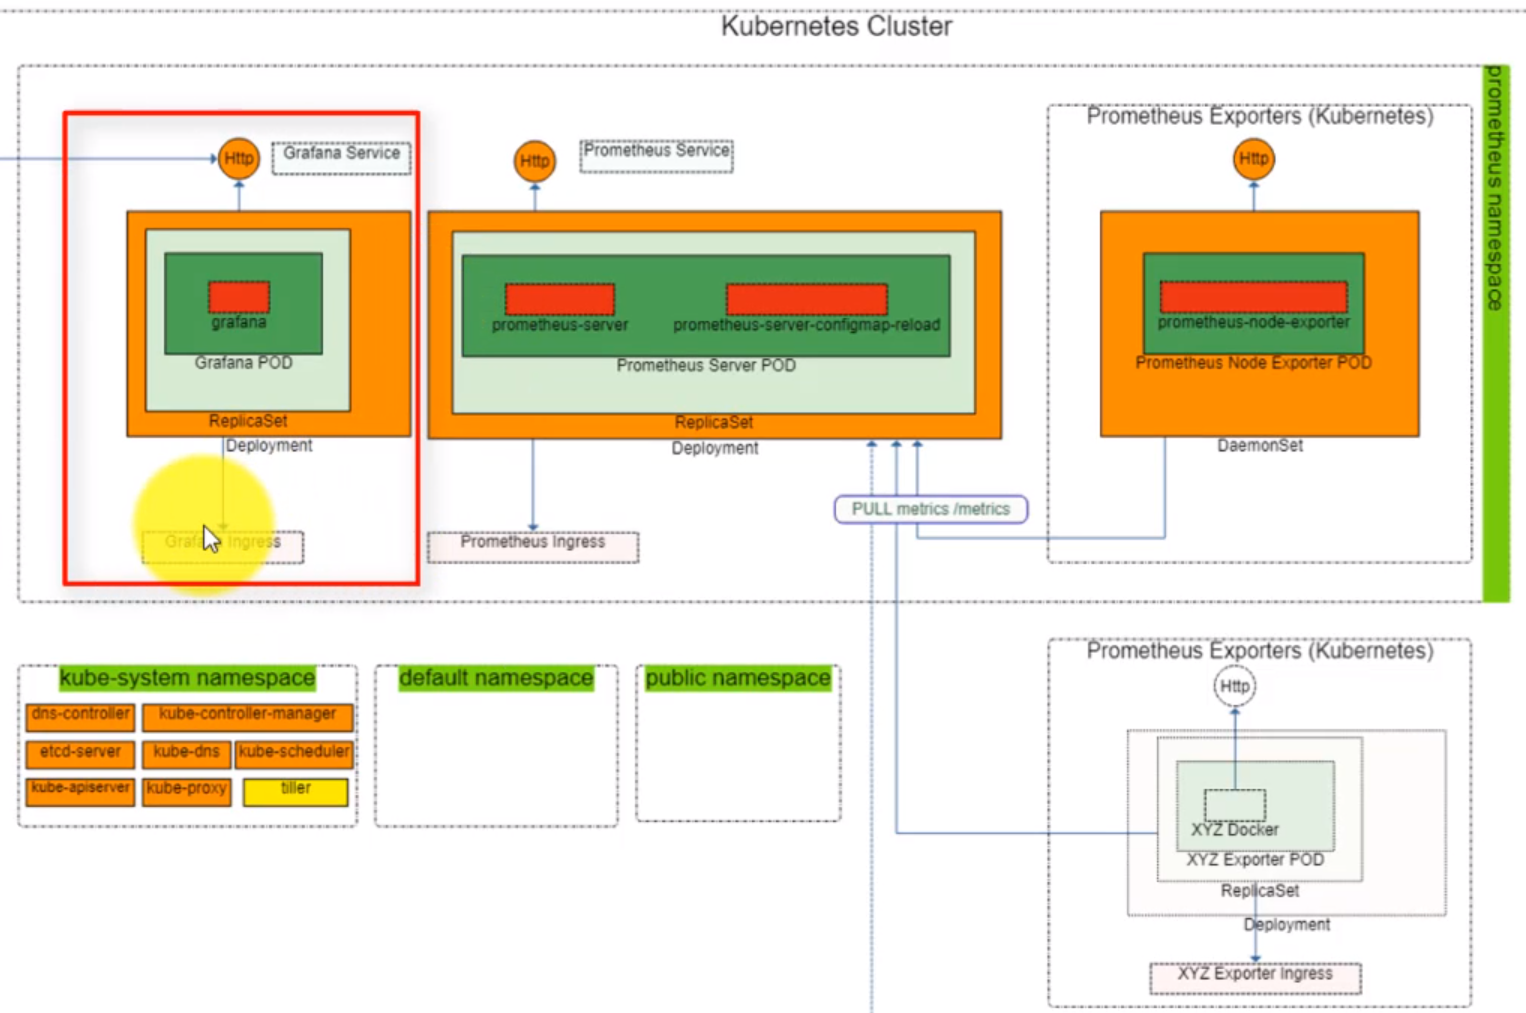
44. Prometheus and Grafana deployment by using helmfile (Prometheus part)
Prometheus is an open-source software project written in Go that is used to record real-time metrics in a time series database (allowing for high dimensionality) built using a HTTP pull model, with flexible queries and real-time alerting. The project is licensed under the Apache 2 License, with source code available on GitHub, and is a graduated project of the Cloud Native Computing Foundation, along with Kubernetes and Envoy.
We can see in Using Prometheus in Grafana that Grafana includes built-in support for Prometheus.
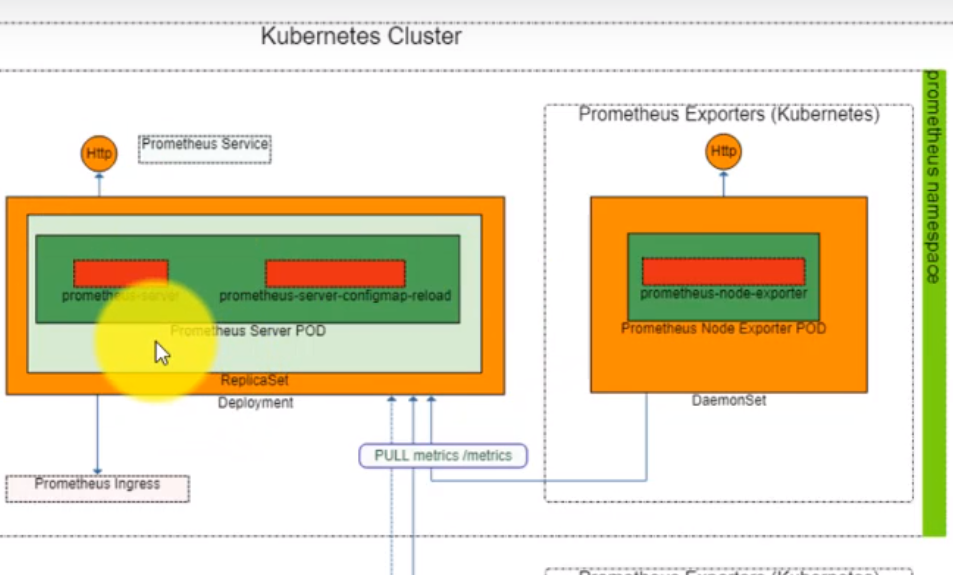
- We can see more information in the Prometheus Repository.
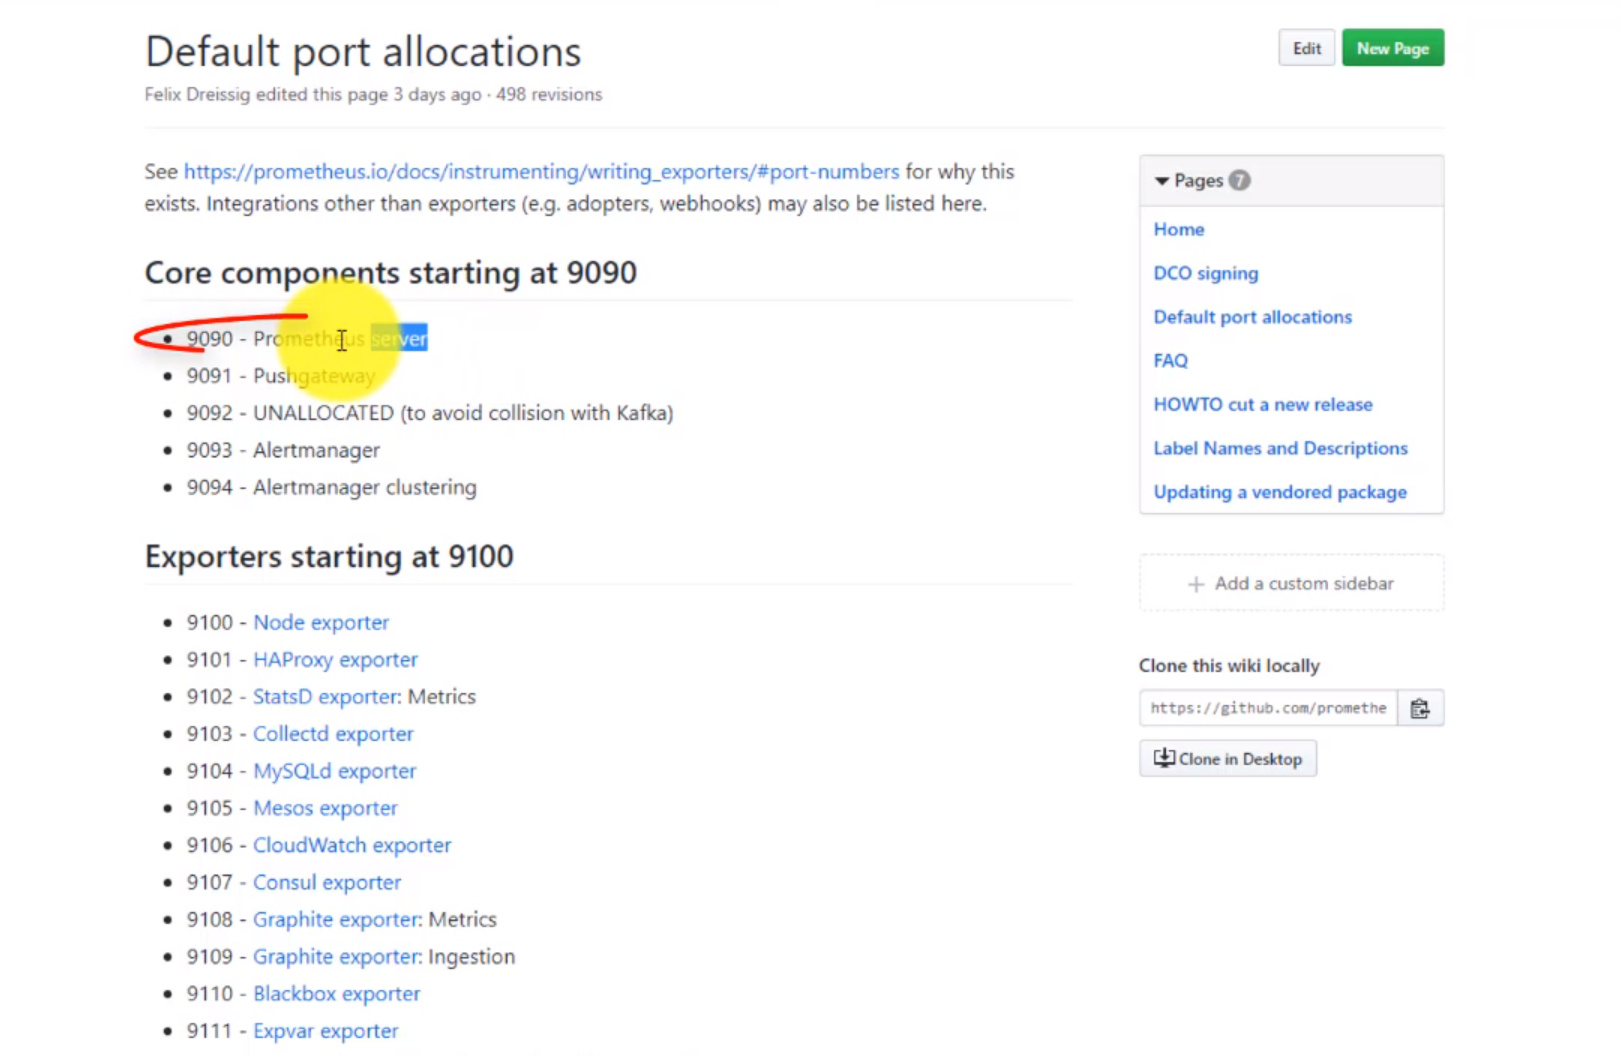
9090is default port forPrometheus serverand the9100is the default port for theNode exporter.
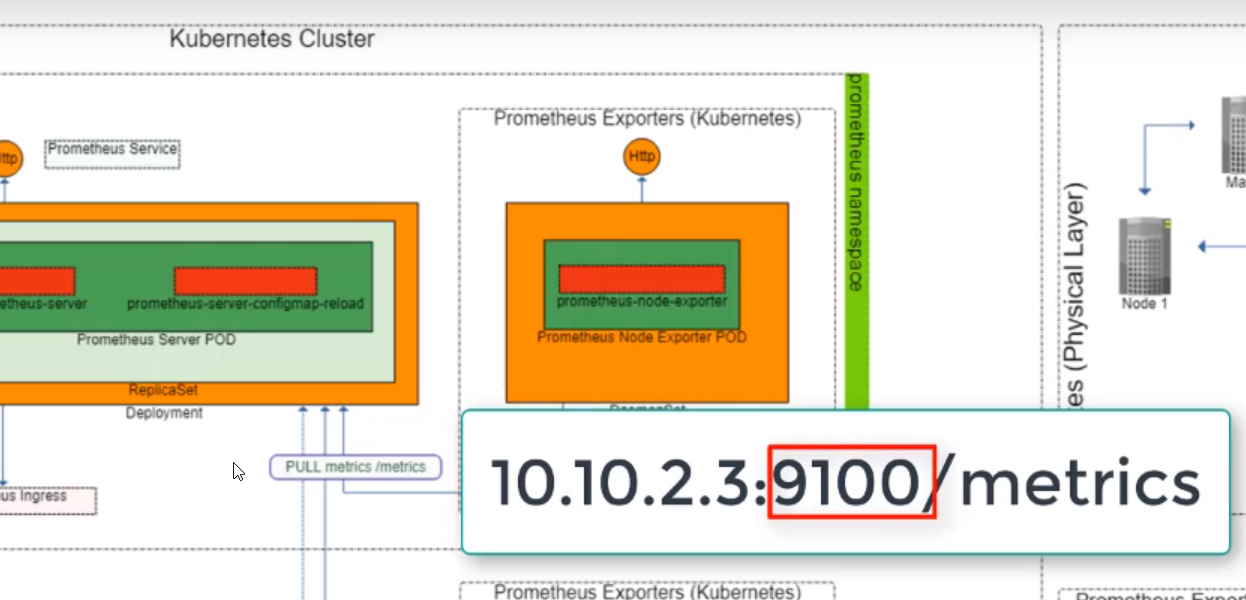
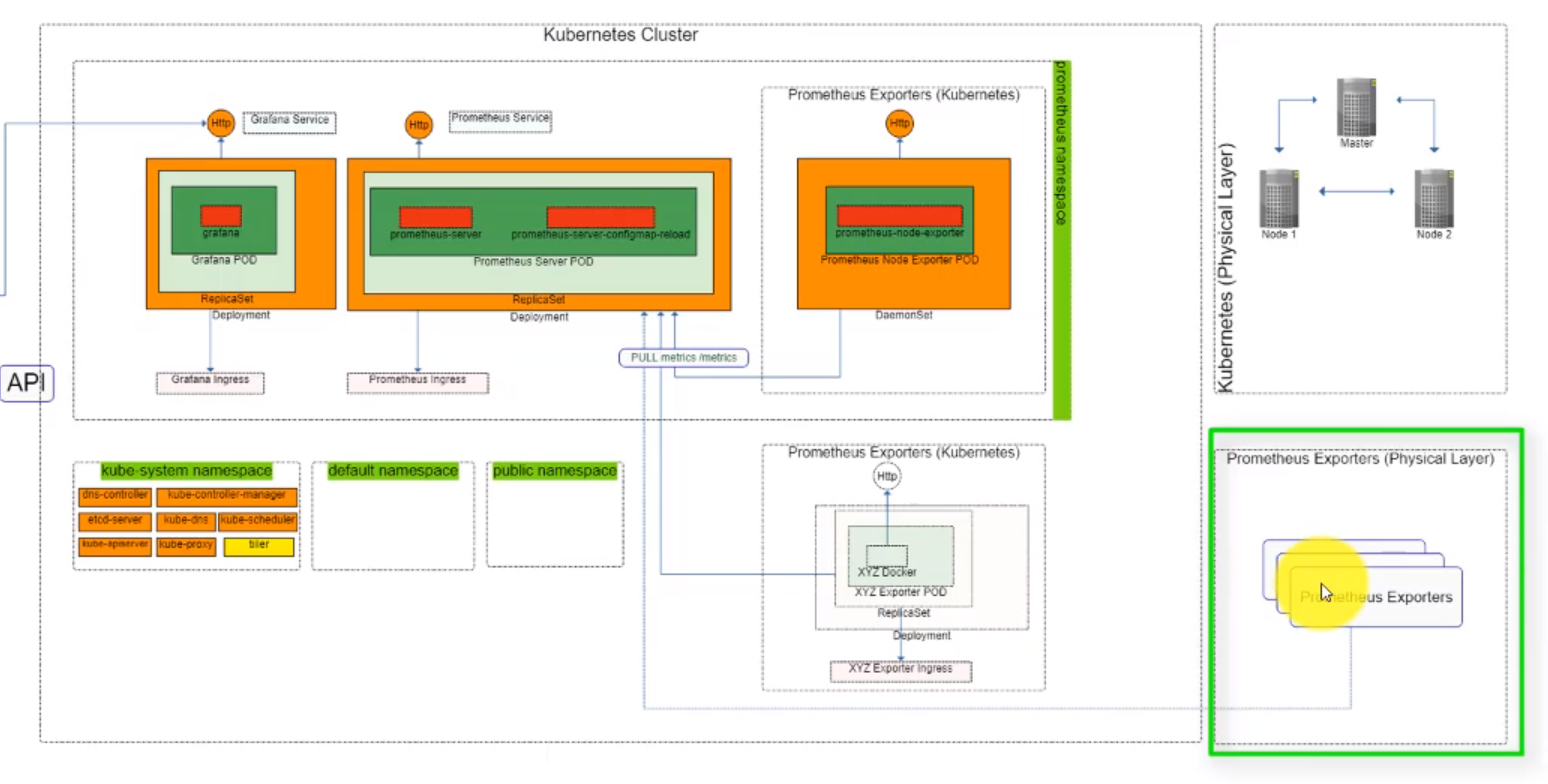
45. Prepare Helm charts for Grafana deployment by using helmfile
We are going to put all our deployments (
Grafana,PrometheusandPrometheus exporters) in alogical kubernetes namespace.If we don't specify any namespace it is assigned to the
default namespace.copy the
stable/grafanafolder to thelocal_chartsfolder.
root@ubuntu-s-1vcpu-2gb-lon1-01:~# cd local_charts/
root@ubuntu-s-1vcpu-2gb-lon1-01:~/local_charts# ls
jenkins  jenkins_udemy_helmfile.yaml
root@ubuntu-s-1vcpu-2gb-lon1-01:~/local_charts# rsync -avhx ../charts/stable/grafana .
sending incremental file list
grafana/
grafana/.helmignore
grafana/Chart.yaml
grafana/OWNERS
grafana/README.md
grafana/values.yaml
grafana/dashboards/
grafana/dashboards/custom-dashboard.json
grafana/templates/
grafana/templates/NOTES.txt
grafana/templates/_helpers.tpl
grafana/templates/clusterrole.yaml
grafana/templates/clusterrolebinding.yaml
grafana/templates/configmap-dashboard-provider.yaml
grafana/templates/configmap.yaml
grafana/templates/dashboards-json-configmap.yaml
grafana/templates/deployment.yaml
grafana/templates/ingress.yaml
grafana/templates/podsecuritypolicy.yaml
grafana/templates/pvc.yaml
grafana/templates/role.yaml
grafana/templates/rolebinding.yaml
grafana/templates/secret.yaml
grafana/templates/service.yaml
grafana/templates/serviceaccount.yaml

sent 56.85K bytes  received 454 bytes  114.60K bytes/sec
total size is 55.14K  speedup is 0.96
root@ubuntu-s-1vcpu-2gb-lon1-01:~/local_charts# ls
grafana  jenkins  jenkins_udemy_helmfile.yaml
root@ubuntu-s-1vcpu-2gb-lon1-01:~/local_charts#
- copy the
stable/prometheusfolder to thelocal_chartsfolder.
root@ubuntu-s-1vcpu-2gb-lon1-01:~/local_charts# rsync -avhx ../charts/stable/prometheus .
sending incremental file list
prometheus/
prometheus/.helmignore
prometheus/Chart.yaml
prometheus/OWNERS
prometheus/README.md
prometheus/values.yaml
prometheus/templates/
prometheus/templates/NOTES.txt
prometheus/templates/_helpers.tpl
prometheus/templates/alertmanager-configmap.yaml
prometheus/templates/alertmanager-deployment.yaml
prometheus/templates/alertmanager-ingress.yaml
prometheus/templates/alertmanager-networkpolicy.yaml
prometheus/templates/alertmanager-pvc.yaml
prometheus/templates/alertmanager-service-headless.yaml
prometheus/templates/alertmanager-service.yaml
prometheus/templates/alertmanager-serviceaccount.yaml
prometheus/templates/alertmanager-statefulset.yaml
prometheus/templates/kube-state-metrics-clusterrole.yaml
prometheus/templates/kube-state-metrics-clusterrolebinding.yaml
prometheus/templates/kube-state-metrics-deployment.yaml
prometheus/templates/kube-state-metrics-networkpolicy.yaml
prometheus/templates/kube-state-metrics-serviceaccount.yaml
prometheus/templates/kube-state-metrics-svc.yaml
prometheus/templates/node-exporter-daemonset.yaml
prometheus/templates/node-exporter-podsecuritypolicy.yaml
prometheus/templates/node-exporter-role.yaml
prometheus/templates/node-exporter-rolebinding.yaml
prometheus/templates/node-exporter-service.yaml
prometheus/templates/node-exporter-serviceaccount.yaml
prometheus/templates/pushgateway-deployment.yaml
prometheus/templates/pushgateway-ingress.yaml
prometheus/templates/pushgateway-pvc.yaml
prometheus/templates/pushgateway-service.yaml
prometheus/templates/pushgateway-serviceaccount.yaml
prometheus/templates/server-clusterrole.yaml
prometheus/templates/server-clusterrolebinding.yaml
prometheus/templates/server-configmap.yaml
prometheus/templates/server-deployment.yaml
prometheus/templates/server-ingress.yaml
prometheus/templates/server-networkpolicy.yaml
prometheus/templates/server-pvc.yaml
prometheus/templates/server-service-headless.yaml
prometheus/templates/server-service.yaml
prometheus/templates/server-serviceaccount.yaml
prometheus/templates/server-statefulset.yaml

sent 147.53K bytes  received 868 bytes  296.80K bytes/sec
total size is 143.93K  speedup is 0.97
root@ubuntu-s-1vcpu-2gb-lon1-01:~/local_charts# ls
grafana  jenkins  jenkins_udemy_helmfile.yaml  prometheus
- Edit the
grafana/values.yamldocument to changeservice: type: ClusterIptoservice: type: NodePortand add thenodePort: 30377. Comment out theadminPassord:setting and assign the valueStart123#to it.
root@ubuntu-s-1vcpu-2gb-lon1-01:~/local_charts# vi grafana/values.yaml
root@ubuntu-s-1vcpu-2gb-lon1-01:~/local_charts#


- Create the
helmfile_specification_pg.yamldocument
helmfile_specification_pg.yaml
# kubectl config view
context: kops.peelmicro.com   # kube-context (--kube-context)

releases:
  # Published chart example
  - name: grafana-course-deploy             # name of this release
    namespace: prometheus                   # target namespace
    chart: stable/grafana                   # repository/chart` syntax
    values:
      - grafana/values.yaml                 # value files (--values)
root@ubuntu-s-1vcpu-2gb-lon1-01:~/local_charts# vi helmfile_specification_pg.yaml
46. Prepare Helm charts for Prometheus deployment by using helmfile
- Complete the
helmfile_specification_pg.yamlto include theprometheusdeployment.
helmfile_specification_pg.yaml
# kubectl config view
context: kops.peelmicro.com   # kube-context (--kube-context)

releases:
  # Published chart example
  - name: grafana-course-deploy             # name of this release
    namespace: prometheus                   # target namespace
    chart: stable/grafana                   # repository/chart` syntax
    values:
      - grafana/values.yaml                 # value files (--values)

  # Published chart example
  - name: prometheus-course-deploy          # name of this release
    namespace: prometheus                   # target namespace
    chart: stable/prometheus                # repository/chart` syntax
    values:
      - prometheus/values.yaml              # value files (--values)
- Edit the
prometheus/values.yamldocument to change:alertmanager: enabled: truetoalertmanager: enabled: false.pushgateway: enabled: truetopushgateway: enabled: false.server: persistentVolume: size: 8Gitoserver: persistentVolume: size: 1Gi.
root@ubuntu-s-1vcpu-2gb-lon1-01:~/local_charts# vi prometheus/values.yaml
root@ubuntu-s-1vcpu-2gb-lon1-01:~/local_charts#
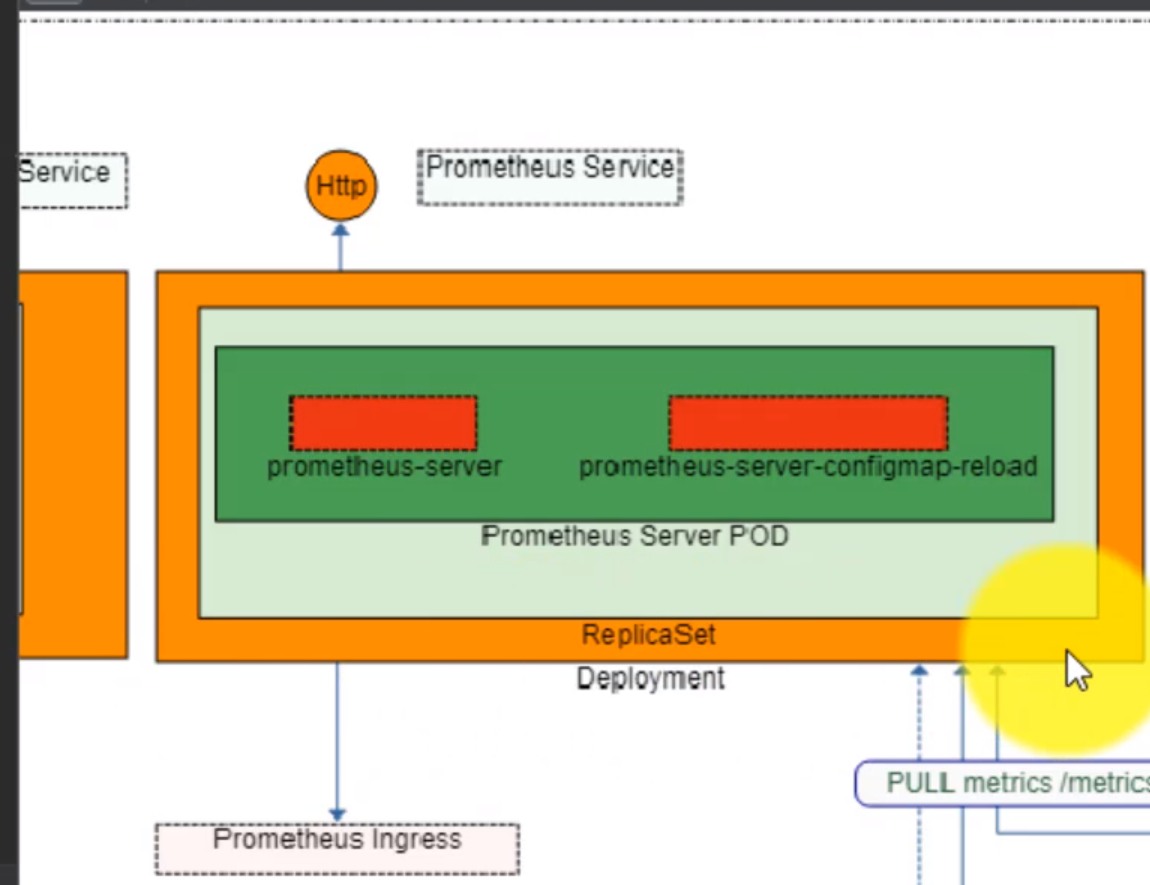
47. Prepare Helm charts for Prometheus Node Exporter deployment by using helmfile
- We can change the
nodeExporter:section of theprometheus/values.yamldocument to configure theNode Exporter
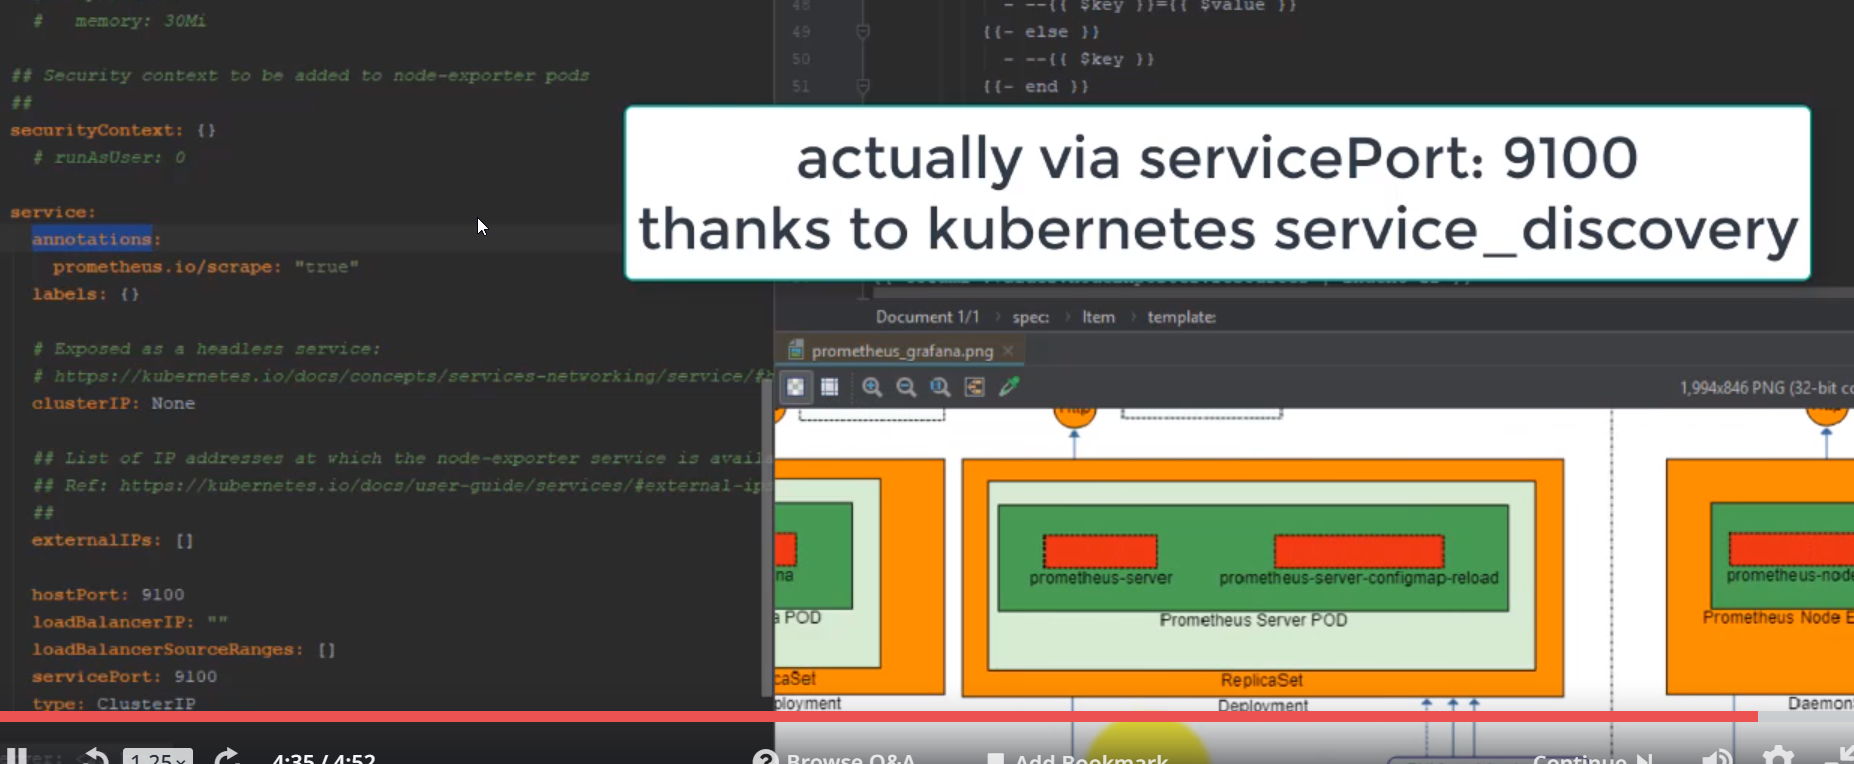
48. Copy Prometheus and Grafana Helm Charts specifications to server
root@ubuntu-s-1vcpu-2gb-lon1-01:~/local_charts# tree -L 2
.
├── grafana
│   ├── Chart.yaml
│   ├── OWNERS
│   ├── README.md
│   ├── dashboards
│   ├── templates
│   └── values.yaml
├── helmfile_specification_pg.yaml
├── jenkins
│   ├── Chart.yaml
│   ├── OWNERS
│   ├── README.md
│   ├── jenkins_custom_values.yaml
│   ├── templates
│   └── values.yaml
├── jenkins_udemy_helmfile.yaml
└── prometheus
    ├── Chart.yaml
    ├── OWNERS
    ├── README.md
    ├── templates
    └── values.yaml

7 directories, 15 files
root@ubuntu-s-1vcpu-2gb-lon1-01:~/local_charts# mkdir prometheus_grafana
root@ubuntu-s-1vcpu-2gb-lon1-01:~/local_charts# mv prometheus prometheus_grafana/
root@ubuntu-s-1vcpu-2gb-lon1-01:~/local_charts# ls
grafana  helmfile_specification_pg.yaml  jenkins  jenkins_udemy_helmfile.yaml  prometheus_grafana
root@ubuntu-s-1vcpu-2gb-lon1-01:~/local_charts# ls prometheus_grafana/
prometheus
root@ubuntu-s-1vcpu-2gb-lon1-01:~/local_charts# mv grafana/ prometheus_grafana/
root@ubuntu-s-1vcpu-2gb-lon1-01:~/local_charts# ls prometheus_grafana/
grafana  prometheus
root@ubuntu-s-1vcpu-2gb-lon1-01:~/local_charts# mv helmfile_specification_pg.yaml prometheus_grafana/
root@ubuntu-s-1vcpu-2gb-lon1-01:~/local_charts# ls prometheus_grafana/
grafana  helmfile_specification_pg.yaml  prometheus
root@ubuntu-s-1vcpu-2gb-lon1-01:~/local_charts#
root@ubuntu-s-1vcpu-2gb-lon1-01:~/local_charts# cd prometheus_grafana/
root@ubuntu-s-1vcpu-2gb-lon1-01:~/local_charts/prometheus_grafana# tree -L 2
.
+-- grafana
¦   +-- Chart.yaml
¦   +-- OWNERS
¦   +-- README.md
¦   +-- dashboards
¦   +-- templates
¦   +-- values.yaml
+-- helmfile_specification_pg.yaml
+-- prometheus
    +-- Chart.yaml
    +-- OWNERS
    +-- README.md
    +-- templates
    +-- values.yaml

5 directories, 9 files
root@ubuntu-s-1vcpu-2gb-lon1-01:~/local_charts/prometheus_grafana#
49. Materials: Helmfile specification for Grafana and Prometheus deployment
Helmfile specification for Grafana and Prometheus deployment
Process deployment:
navigate to a location with all these folders (grafana/, prometheus/ ) created with corresponding
values.yamlfiles.Create this file:
helmfile_specification_pg.yaml
# kubectl config view
context: course.<your_domain>.com   # kube-context (--kube-context)

releases:
  # Published chart example
  - name: grafana-course-deploy             # name of this release
    namespace: prometheus                   # target namespace
    chart: stable/grafana                   # repository/chart` syntax
    values:
      - grafana/values.yaml                 # value files (--values)

  # Published chart example
  - name: prometheus-course-deploy          # name of this release
    namespace: prometheus                   # target namespace
    chart: stable/prometheus                # repository/chart` syntax
    values:
      - prometheus/values.yaml              # value files (--values)
Process desired changes in
grafana/values.yamlandprometheus/values.yamlfiles.Run:
helmfile -f helmfile_specification_pg.yaml sync
Note: I assume that if you are going through this course during several days - You always destroy all resources in AWS. It means that you stop you Kubernetes cluster every time you are not working on it. The easiest way is to do it via terraform cd /.../.../.../terraform_code ; terraform destroy # hit yes
destroy/delete manually if terraform can't do that:
- VOLUMES
- LoadBalancer/s (if exists)
- RecordSet/s (custom RecordSet/s)
- EC2 instances
- network resources
- ...
except:
- S3 bucket (delete once you do not want to use this free 1 YEAR account anymore, or you are done with this course.)
- Hosted Zone (delete once you do not want to use this free 1 YEAR account anymore, or you are done with this course.)
Please do not forget redeploy tiller pod by using of this commands every time you are starting your Kubernetes cluster.
# Start your Kubernetes cluster
cd /.../.../.../terraform_code
terraform apply

# Crete service account && initiate tiller pod in your Kubernetes cluster
kubectl create serviceaccount --namespace kube-system tiller
kubectl create clusterrolebinding tiller-cluster-rule --clusterrole=cluster-admin --serviceaccount=kube-system:tiller
# kubectl patch deploy --namespace kube-system tiller-deploy -p '{"spec":{"template":{"spec":{"serviceAccount":"tiller"}}}}'
helm init --service-account tiller --upgrade
50. Process Grafana and Prometheus helmfile deployment
root@ubuntu-s-1vcpu-2gb-lon1-01:~/local_charts/prometheus_grafana# tree -L 2
.
+-- grafana
¦   +-- Chart.yaml
¦   +-- OWNERS
¦   +-- README.md
¦   +-- dashboards
¦   +-- templates
¦   +-- values.yaml
+-- helmfile_specification_pg.yaml
+-- prometheus
    +-- Chart.yaml
    +-- OWNERS
    +-- README.md
    +-- templates
    +-- values.yaml

5 directories, 9 files
root@ubuntu-s-1vcpu-2gb-lon1-01:~/local_charts/prometheus_grafana#
- Check what is running now.
root@ubuntu-s-1vcpu-2gb-lon1-01:~/local_charts/prometheus_grafana# kubectl get pods,svc,pv,pvc
NAME                                        READY   STATUS    RESTARTS   AGE
pod/jenkins-course-udemy-7588cc9f49-clztr   1/1     Running   0          1d
pod/jupyter-k8s-udemy-79f7dd7ffc-kfzb7      1/1     Running   0          2d

NAME                                 TYPE        CLUSTER-IP      EXTERNAL-IP   PORT(S)          AGE
service/jenkins-course-udemy         NodePort    100.70.83.132   <none>        8080:30477/TCP   1d
service/jenkins-course-udemy-agent   ClusterIP   100.71.105.43   <none>        50000/TCP        1d
service/jupyter-k8s-udemy            NodePort    100.64.248.5    <none>        8888:30040/TCP   2d
service/kubernetes                   ClusterIP   100.64.0.1      <none>        443/TCP          2d

NAME                                                        CAPACITY   ACCESS MODES   RECLAIM POLICY   STATUS   CLAIM                          STORAGECLASS   REASON   AGE
persistentvolume/pvc-28d9be7a-4358-11e9-b1ba-023d0745758e   2Gi        RWO            Delete           Bound    default/jenkins-course-udemy   gp2                     1d

NAME                                         STATUS   VOLUME                                     CAPACITY   ACCESS MODES   STORAGECLASS   AGE
persistentvolumeclaim/jenkins-course-udemy   Bound    pvc-28d9be7a-4358-11e9-b1ba-023d0745758e   2Gi        RWO            gp2            1d
- Execute the
helmfile_specification_pg.yamlhelmfile.
root@ubuntu-s-1vcpu-2gb-lon1-01:~/local_charts/prometheus_grafana# helmfile -f helmfile_specification_pg.yaml sync
exec: helm repo update --kube-context kops.peelmicro.com
Hang tight while we grab the latest from your chart repositories...
...Skip local chart repository
...Successfully got an update from the "incubator" chart repository
...Successfully got an update from the "stable" chart repository
Update Complete. ? Happy Helming!?
exec: helm upgrade --install --reset-values grafana-course-deploy stable/grafana --namespace prometheus --values /root/local_charts/prometheus_grafana/grafana/values.yaml --kube-context kops.peelmicro.com
exec: helm upgrade --install --reset-values prometheus-course-deploy stable/prometheus --namespace prometheus --values /root/local_charts/prometheus_grafana/prometheus/values.yaml --kube-context kops.peelmicro.com
Release "grafana-course-deploy" does not exist. Installing it now.
Error: release grafana-course-deploy failed: namespaces "prometheus" already exists
Release "prometheus-course-deploy" does not exist. Installing it now.
NAME:   prometheus-course-deploy
LAST DEPLOYED: Tue Mar 12 05:00:08 2019
NAMESPACE: prometheus
STATUS: DEPLOYED

RESOURCES:
==> v1beta1/ClusterRole
NAME                                         AGE
prometheus-course-deploy-kube-state-metrics  1s
prometheus-course-deploy-server              1s

==> v1beta1/ClusterRoleBinding
NAME                                         AGE
prometheus-course-deploy-kube-state-metrics  1s
prometheus-course-deploy-server              1s

==> v1/Service
NAME                                         TYPE       CLUSTER-IP      EXTERNAL-IP  PORT(S)   AGE
prometheus-course-deploy-kube-state-metrics  ClusterIP  None            <none>       80/TCP    1s
prometheus-course-deploy-node-exporter       ClusterIP  None            <none>       9100/TCP  1s
prometheus-course-deploy-server              ClusterIP  100.68.154.139  <none>       80/TCP    1s

==> v1/ConfigMap
NAME                             DATA  AGE
prometheus-course-deploy-server  3     1s

==> v1/PersistentVolumeClaim
NAME                             STATUS   VOLUME  CAPACITY  ACCESS MODES  STORAGECLASS  AGE
prometheus-course-deploy-server  Pending  gp2     1s

==> v1/ServiceAccount
NAME                                         SECRETS  AGE
prometheus-course-deploy-kube-state-metrics  1        1s
prometheus-course-deploy-node-exporter       1        1s
prometheus-course-deploy-server              1        1s

==> v1beta1/DaemonSet
NAME                                    DESIRED  CURRENT  READY  UP-TO-DATE  AVAILABLE  NODE SELECTOR  AGE
prometheus-course-deploy-node-exporter  2        2        0      2           0          <none>         1s

==> v1beta1/Deployment
NAME                                         DESIRED  CURRENT  UP-TO-DATE  AVAILABLE  AGE
prometheus-course-deploy-kube-state-metrics  1        1        1           0          1s
prometheus-course-deploy-server              1        1        1           0          1s

==> v1/Pod(related)
NAME                                                          READY  STATUS             RESTARTS  AGE
prometheus-course-deploy-node-exporter-4c28s                  0/1    ContainerCreating  0         1s
prometheus-course-deploy-node-exporter-x4zbf                  0/1    ContainerCreating  0         1s
prometheus-course-deploy-kube-state-metrics-5b676d5d87-bp54l  0/1    ContainerCreating  0         1s
prometheus-course-deploy-server-5748f5f975-rlrl7              0/2    Pending            0         1s


NOTES:
The Prometheus server can be accessed via port 80 on the following DNS name from within your cluster:
prometheus-course-deploy-server.prometheus.svc.cluster.local


Get the Prometheus server URL by running these commands in the same shell:
  export POD_NAME=$(kubectl get pods --namespace prometheus -l "app=prometheus,component=server" -o jsonpath="{.items[0].metadata.name}")
  kubectl --namespace prometheus port-forward $POD_NAME 9090


For more information on running Prometheus, visit:
https://prometheus.io/

err: exit status 1
root@ubuntu-s-1vcpu-2gb-lon1-01:~/local_charts/prometheus_grafana#
root@ubuntu-s-1vcpu-2gb-lon1-01:~/local_charts/prometheus_grafana# kubectl get pods,svc,pv,pvc
NAME                                        READY   STATUS    RESTARTS   AGE
pod/jenkins-course-udemy-7588cc9f49-clztr   1/1     Running   0          1d
pod/jupyter-k8s-udemy-79f7dd7ffc-kfzb7      1/1     Running   0          2d

NAME                                 TYPE        CLUSTER-IP      EXTERNAL-IP   PORT(S)          AGE
service/jenkins-course-udemy         NodePort    100.70.83.132   <none>        8080:30477/TCP   1d
service/jenkins-course-udemy-agent   ClusterIP   100.71.105.43   <none>        50000/TCP        1d
service/jupyter-k8s-udemy            NodePort    100.64.248.5    <none>        8888:30040/TCP   2d
service/kubernetes                   ClusterIP   100.64.0.1      <none>        443/TCP          2d

NAME                                                        CAPACITY   ACCESS MODES   RECLAIM POLICY   STATUS   CLAIM                                        STORAGECLASS   REASON   AGE
persistentvolume/pvc-28d9be7a-4358-11e9-b1ba-023d0745758e   2Gi        RWO            Delete           Bound    default/jenkins-course-udemy                 gp2                     1d
persistentvolume/pvc-b543875c-4483-11e9-b1ba-023d0745758e   1Gi        RWO            Delete           Bound    prometheus/prometheus-course-deploy-server   gp2                     3m

NAME                                         STATUS   VOLUME                                     CAPACITY   ACCESS MODES   STORAGECLASS   AGE
persistentvolumeclaim/jenkins-course-udemy   Bound    pvc-28d9be7a-4358-11e9-b1ba-023d0745758e   2Gi        RWO            gp2            1d
- the following error happens:
Error: release grafana-course-deploy failed: namespaces "prometheus" already exists
root@ubuntu-s-1vcpu-2gb-lon1-01:~/local_charts/prometheus_grafana# kubectl get ns
NAME          STATUS   AGE
default       Active   2d
kube-public   Active   2d
kube-system   Active   2d
prometheus    Active   8m
root@ubuntu-s-1vcpu-2gb-lon1-01:~/local_charts/prometheus_grafana#
- Remove the deployment
root@ubuntu-s-1vcpu-2gb-lon1-01:~/local_charts/prometheus_grafana# helmfile -f helmfile_specification_pg.yaml delete
exec: helm delete prometheus-course-deploy --kube-context kops.peelmicro.com
exec: helm delete grafana-course-deploy --kube-context kops.peelmicro.com
release "grafana-course-deploy" deleted
release "prometheus-course-deploy" deleted
root@ubuntu-s-1vcpu-2gb-lon1-01:~/local_charts/prometheus_grafana#
root@ubuntu-s-1vcpu-2gb-lon1-01:~/local_charts/prometheus_grafana# kubectl get pods,svc,pv,pvc,ns
NAME                                        READY   STATUS    RESTARTS   AGE
pod/jenkins-course-udemy-7588cc9f49-clztr   1/1     Running   0          1d
pod/jupyter-k8s-udemy-79f7dd7ffc-kfzb7      1/1     Running   0          2d

NAME                                 TYPE        CLUSTER-IP      EXTERNAL-IP   PORT(S)          AGE
service/jenkins-course-udemy         NodePort    100.70.83.132   <none>        8080:30477/TCP   1d
service/jenkins-course-udemy-agent   ClusterIP   100.71.105.43   <none>        50000/TCP        1d
service/jupyter-k8s-udemy            NodePort    100.64.248.5    <none>        8888:30040/TCP   2d
service/kubernetes                   ClusterIP   100.64.0.1      <none>        443/TCP          2d

NAME                                                        CAPACITY   ACCESS MODES   RECLAIM POLICY   STATUS   CLAIM                          STORAGECLASS   REASON   AGE
persistentvolume/pvc-28d9be7a-4358-11e9-b1ba-023d0745758e   2Gi        RWO            Delete           Bound    default/jenkins-course-udemy   gp2                     1d

NAME                                         STATUS   VOLUME                                     CAPACITY   ACCESS MODES   STORAGECLASS   AGE
persistentvolumeclaim/jenkins-course-udemy   Bound    pvc-28d9be7a-4358-11e9-b1ba-023d0745758e   2Gi        RWO            gp2            1d

NAME                    STATUS   AGE
namespace/default       Active   2d
namespace/kube-public   Active   2d
namespace/kube-system   Active   2d
- To purge the deployment we have to execute:
root@ubuntu-s-1vcpu-2gb-lon1-01:~/local_charts/prometheus_grafana# helmfile -f helmfile_specification_pg.yaml delete --purge
exec: helm delete prometheus-course-deploy --purge --kube-context kops.peelmicro.com
exec: helm delete grafana-course-deploy --purge --kube-context kops.peelmicro.com
release "grafana-course-deploy" deleted
release "prometheus-course-deploy" deleted
root@ubuntu-s-1vcpu-2gb-lon1-01:~/local_charts/prometheus_grafana# helmfile -f helmfile_specification_pg.yaml status
exec: helm status grafana-course-deploy --kube-context kops.peelmicro.com
exec: helm status prometheus-course-deploy --kube-context kops.peelmicro.com
Error: getting deployed release "prometheus-course-deploy": release: "prometheus-course-deploy" not found
Error: getting deployed release "grafana-course-deploy": release: "grafana-course-deploy" not found
err: exit status 1
err: exit status 1
root@ubuntu-s-1vcpu-2gb-lon1-01:~/local_charts/prometheus_grafana# helmfile -f helmfile_specification_pg.yaml sync
exec: helm repo update --kube-context kops.peelmicro.com
Hang tight while we grab the latest from your chart repositories...
...Skip local chart repository
...Successfully got an update from the "incubator" chart repository
...Successfully got an update from the "stable" chart repository
Update Complete. ? Happy Helming!?
exec: helm upgrade --install --reset-values grafana-course-deploy stable/grafana --namespace prometheus --values /root/local_charts/prometheus_grafana/grafana/values.yaml --kube-context kops.peelmicro.com
exec: helm upgrade --install --reset-values prometheus-course-deploy stable/prometheus --namespace prometheus --values /root/local_charts/prometheus_grafana/prometheus/values.yaml --kube-context kops.peelmicro.com
Release "prometheus-course-deploy" does not exist. Installing it now.
NAME:   prometheus-course-deploy
LAST DEPLOYED: Tue Mar 12 05:41:25 2019
NAMESPACE: prometheus
STATUS: DEPLOYED

RESOURCES:
==> v1/ConfigMap
NAME                             DATA  AGE
prometheus-course-deploy-server  3     1s

==> v1beta1/ClusterRole
NAME                                         AGE
prometheus-course-deploy-kube-state-metrics  1s
prometheus-course-deploy-server              1s

==> v1beta1/ClusterRoleBinding
NAME                                         AGE
prometheus-course-deploy-kube-state-metrics  1s
prometheus-course-deploy-server              1s

==> v1/Service
NAME                                         TYPE       CLUSTER-IP     EXTERNAL-IP  PORT(S)   AGE
prometheus-course-deploy-kube-state-metrics  ClusterIP  None           <none>       80/TCP    1s
prometheus-course-deploy-node-exporter       ClusterIP  None           <none>       9100/TCP  1s
prometheus-course-deploy-server              ClusterIP  100.68.41.209  <none>       80/TCP    1s

==> v1beta1/DaemonSet
NAME                                    DESIRED  CURRENT  READY  UP-TO-DATE  AVAILABLE  NODE SELECTOR  AGE
prometheus-course-deploy-node-exporter  2        2        0      2           0          <none>         1s

==> v1/Pod(related)
NAME                                                          READY  STATUS             RESTARTS  AGE
prometheus-course-deploy-node-exporter-2shl2                  0/1    ContainerCreating  0         1s
prometheus-course-deploy-node-exporter-fm6w8                  0/1    ContainerCreating  0         1s
prometheus-course-deploy-kube-state-metrics-5b676d5d87-9c2tw  0/1    ContainerCreating  0         1s
prometheus-course-deploy-server-5748f5f975-dp52k              0/2    Pending            0         1s

==> v1/PersistentVolumeClaim
NAME                             STATUS   VOLUME  CAPACITY  ACCESS MODES  STORAGECLASS  AGE
prometheus-course-deploy-server  Pending  gp2     1s

==> v1/ServiceAccount
NAME                                         SECRETS  AGE
prometheus-course-deploy-kube-state-metrics  1        1s
prometheus-course-deploy-node-exporter       1        1s
prometheus-course-deploy-server              1        1s

==> v1beta1/Deployment
NAME                                         DESIRED  CURRENT  UP-TO-DATE  AVAILABLE  AGE
prometheus-course-deploy-kube-state-metrics  1        1        1           0          1s
prometheus-course-deploy-server              1        1        1           0          1s


NOTES:
The Prometheus server can be accessed via port 80 on the following DNS name from within your cluster:
prometheus-course-deploy-server.prometheus.svc.cluster.local


Get the Prometheus server URL by running these commands in the same shell:
  export POD_NAME=$(kubectl get pods --namespace prometheus -l "app=prometheus,component=server" -o jsonpath="{.items[0].metadata.name}")
  kubectl --namespace prometheus port-forward $POD_NAME 9090


For more information on running Prometheus, visit:
https://prometheus.io/

Release "grafana-course-deploy" does not exist. Installing it now.
NAME:   grafana-course-deploy
LAST DEPLOYED: Tue Mar 12 05:41:25 2019
NAMESPACE: prometheus
STATUS: DEPLOYED

RESOURCES:
==> v1beta1/Role
NAME                   AGE
grafana-course-deploy  0s

==> v1/Service
NAME                   TYPE      CLUSTER-IP     EXTERNAL-IP  PORT(S)       AGE
grafana-course-deploy  NodePort  100.69.248.75  <none>       80:30377/TCP  0s

==> v1beta2/Deployment
NAME                   DESIRED  CURRENT  UP-TO-DATE  AVAILABLE  AGE
grafana-course-deploy  1        1        1           0          0s

==> v1beta1/PodSecurityPolicy
NAME                   DATA   CAPS      SELINUX   RUNASUSER  FSGROUP   SUPGROUP  READONLYROOTFS  VOLUMES
grafana-course-deploy  false  RunAsAny  RunAsAny  RunAsAny   RunAsAny  false     configMap,emptyDir,projected,secret,downwardAPI,persistentVolumeClaim

==> v1/Secret
NAME                   TYPE    DATA  AGE
grafana-course-deploy  Opaque  3     1s

==> v1/ConfigMap
NAME                   DATA  AGE
grafana-course-deploy  1     1s

==> v1/ClusterRoleBinding
NAME                                      AGE
grafana-course-deploy-clusterrolebinding  0s

==> v1beta1/RoleBinding
NAME                   AGE
grafana-course-deploy  0s

==> v1/Pod(related)
NAME                                    READY  STATUS             RESTARTS  AGE
grafana-course-deploy-68c8968f9f-np9b9  0/1    ContainerCreating  0         0s

==> v1/ServiceAccount
NAME                   SECRETS  AGE
grafana-course-deploy  1        1s

==> v1/ClusterRole
NAME                               AGE
grafana-course-deploy-clusterrole  0s


NOTES:
1. Get your 'admin' user password by running:

   kubectl get secret --namespace prometheus grafana-course-deploy -o jsonpath="{.data.admin-password}" | base64 --decode ; echo

2. The Grafana server can be accessed via port 80 on the following DNS name from within your cluster:

   grafana-course-deploy.prometheus.svc.cluster.local

   Get the Grafana URL to visit by running these commands in the same shell:
export NODE_PORT=$(kubectl get --namespace prometheus -o jsonpath="{.spec.ports[0].nodePort}" services grafana-course-deploy)
     export NODE_IP=$(kubectl get nodes --namespace prometheus -o jsonpath="{.items[0].status.addresses[0].address}")
     echo http://$NODE_IP:$NODE_PORT


3. Login with the password from step 1 and the username: admin
#################################################################################
######   WARNING: Persistence is disabled!!! You will lose your data when   #####
######            the Grafana pod is terminated.                            #####
#################################################################################

root@ubuntu-s-1vcpu-2gb-lon1-01:~/local_charts/prometheus_grafana#
root@ubuntu-s-1vcpu-2gb-lon1-01:~/local_charts/prometheus_grafana# kubectl get pods,svc,pv,pvc,ns
NAME                                        READY   STATUS    RESTARTS   AGE
pod/jenkins-course-udemy-7588cc9f49-clztr   1/1     Running   0          1d
pod/jupyter-k8s-udemy-79f7dd7ffc-kfzb7      1/1     Running   0          2d

NAME                                 TYPE        CLUSTER-IP      EXTERNAL-IP   PORT(S)          AGE
service/jenkins-course-udemy         NodePort    100.70.83.132   <none>        8080:30477/TCP   1d
service/jenkins-course-udemy-agent   ClusterIP   100.71.105.43   <none>        50000/TCP        1d
service/jupyter-k8s-udemy            NodePort    100.64.248.5    <none>        8888:30040/TCP   2d
service/kubernetes                   ClusterIP   100.64.0.1      <none>        443/TCP          2d

NAME                                                        CAPACITY   ACCESS MODES   RECLAIM POLICY   STATUS   CLAIM                                        STORAGECLASS   REASON   AGE
persistentvolume/pvc-28d9be7a-4358-11e9-b1ba-023d0745758e   2Gi        RWO            Delete           Bound    default/jenkins-course-udemy                 gp2                     1d
persistentvolume/pvc-79c6764f-4489-11e9-b1ba-023d0745758e   1Gi        RWO            Delete           Bound    prometheus/prometheus-course-deploy-server   gp2                     55s

NAME                                         STATUS   VOLUME                                     CAPACITY   ACCESS MODES   STORAGECLASS   AGE
persistentvolumeclaim/jenkins-course-udemy   Bound    pvc-28d9be7a-4358-11e9-b1ba-023d0745758e   2Gi        RWO            gp2            1d

NAME                    STATUS   AGE
namespace/default       Active   2d
namespace/kube-public   Active   2d
namespace/kube-system   Active   2d
namespace/prometheus    Active   56s
root@ubuntu-s-1vcpu-2gb-lon1-01:~/local_charts/prometheus_grafana#
- The previous information is showing the pods from the
defaultnamespace
root@ubuntu-s-1vcpu-2gb-lon1-01:~/local_charts/prometheus_grafana# kubectl get pods,svc,pv,pvc -n prometheus
NAME                                                               READY   STATUS    RESTARTS   AGE
pod/grafana-course-deploy-68c8968f9f-np9b9                         1/1     Running   0          3m
pod/prometheus-course-deploy-kube-state-metrics-5b676d5d87-9c2tw   1/1     Running   0          3m
pod/prometheus-course-deploy-node-exporter-2shl2                   1/1     Running   0          3m
pod/prometheus-course-deploy-node-exporter-fm6w8                   1/1     Running   0          3m
pod/prometheus-course-deploy-server-5748f5f975-dp52k               2/2     Running   0          3m

NAME                                                  TYPE        CLUSTER-IP      EXTERNAL-IP   PORT(S)        AGE
service/grafana-course-deploy                         NodePort    100.69.248.75   <none>        80:30377/TCP   3m
service/prometheus-course-deploy-kube-state-metrics   ClusterIP   None            <none>        80/TCP         3m
service/prometheus-course-deploy-node-exporter        ClusterIP   None            <none>        9100/TCP       3m
service/prometheus-course-deploy-server               ClusterIP   100.68.41.209   <none>        80/TCP         3m

NAME                                                        CAPACITY   ACCESS MODES   RECLAIM POLICY   STATUS   CLAIM                                        STORAGECLASS   REASON   AGE
persistentvolume/pvc-28d9be7a-4358-11e9-b1ba-023d0745758e   2Gi        RWO            Delete           Bound    default/jenkins-course-udemy                 gp2                     1d
persistentvolume/pvc-79c6764f-4489-11e9-b1ba-023d0745758e   1Gi        RWO            Delete           Bound    prometheus/prometheus-course-deploy-server   gp2                     3m

NAME                                                    STATUS   VOLUME                                     CAPACITY   ACCESS MODES   STORAGECLASS   AGE
persistentvolumeclaim/prometheus-course-deploy-server   Bound    pvc-79c6764f-4489-11e9-b1ba-023d0745758e   1Gi        RWO            gp2            3m
root@ubuntu-s-1vcpu-2gb-lon1-01:~# kubectl describe pod prometheus-course-deploy-server-5748f5f975-dp52k -n prometheus
Name:           prometheus-course-deploy-server-5748f5f975-dp52k
Namespace:      prometheus
Node:           ip-172-20-56-4.eu-central-1.compute.internal/172.20.56.4
Start Time:     Tue, 12 Mar 2019 05:41:27 +0000
Labels:         app=prometheus
                chart=prometheus-8.8.1
                component=server
                heritage=Tiller
                pod-template-hash=1304919531
                release=prometheus-course-deploy
Annotations:    <none>
Status:         Running
IP:             100.96.2.16
Controlled By:  ReplicaSet/prometheus-course-deploy-server-5748f5f975
Init Containers:
  init-chown-data:
    Container ID:  docker://550c36a63a8e556b8993506e6921c614d2922c7af4d03c26b4eff3ba5038c167
    Image:         busybox:latest
    Image ID:      docker-pullable://busybox@sha256:061ca9704a714ee3e8b80523ec720c64f6209ad3f97c0ff7cb9ec7d19f15149f
    Port:          <none>
    Host Port:     <none>
    Command:
      chown
      -R
      65534:65534
      /data
    State:          Terminated
      Reason:       Completed
      Exit Code:    0
      Started:      Tue, 12 Mar 2019 05:41:46 +0000
      Finished:     Tue, 12 Mar 2019 05:41:46 +0000
    Ready:          True
    Restart Count:  0
    Environment:    <none>
    Mounts:
      /data from storage-volume (rw)
      /var/run/secrets/kubernetes.io/serviceaccount from prometheus-course-deploy-server-token-jhrvj (ro)
Containers:
  prometheus-server-configmap-reload:
    Container ID:  docker://9fd313aff8996459e037676aa3d94531868ce10fd93e3d5a33b5fc0111344d76
    Image:         jimmidyson/configmap-reload:v0.2.2
    Image ID:      docker-pullable://jimmidyson/configmap-reload@sha256:befec9f23d2a9da86a298d448cc9140f56a457362a7d9eecddba192db1ab489e
    Port:          <none>
    Host Port:     <none>
    Args:
      --volume-dir=/etc/config
      --webhook-url=http://127.0.0.1:9090/-/reload
    State:          Running
      Started:      Tue, 12 Mar 2019 05:41:47 +0000
    Ready:          True
    Restart Count:  0
    Environment:    <none>
    Mounts:
      /etc/config from config-volume (ro)
      /var/run/secrets/kubernetes.io/serviceaccount from prometheus-course-deploy-server-token-jhrvj (ro)
  prometheus-server:
    Container ID:  docker://19e5bf60f17b893b90c6f4f790d30d6b7553ea901f06a615621d46e81a40171c
    Image:         prom/prometheus:v2.7.2
    Image ID:      docker-pullable://prom/prometheus@sha256:33ff3dcfbae0454ceb403fd6a6e38583f5a5df271a14fea1defbbb6d699ef14e
    Port:          9090/TCP
    Host Port:     0/TCP
    Args:
      --config.file=/etc/config/prometheus.yml
      --storage.tsdb.path=/data
      --web.console.libraries=/etc/prometheus/console_libraries
      --web.console.templates=/etc/prometheus/consoles
      --web.enable-lifecycle
    State:          Running
      Started:      Tue, 12 Mar 2019 05:41:47 +0000
    Ready:          True
    Restart Count:  0
    Liveness:       http-get http://:9090/-/healthy delay=30s timeout=30s period=10s #success=1 #failure=3
    Readiness:      http-get http://:9090/-/ready delay=30s timeout=30s period=10s #success=1 #failure=3
    Environment:    <none>
    Mounts:
      /data from storage-volume (rw)
      /etc/config from config-volume (rw)
      /var/run/secrets/kubernetes.io/serviceaccount from prometheus-course-deploy-server-token-jhrvj (ro)
Conditions:
  Type           Status
  Initialized    True
  Ready          True
  PodScheduled   True
Volumes:
  config-volume:
    Type:      ConfigMap (a volume populated by a ConfigMap)
    Name:      prometheus-course-deploy-server
    Optional:  false
  storage-volume:
    Type:       PersistentVolumeClaim (a reference to a PersistentVolumeClaim in the same namespace)
    ClaimName:  prometheus-course-deploy-server
    ReadOnly:   false
  prometheus-course-deploy-server-token-jhrvj:
    Type:        Secret (a volume populated by a Secret)
    SecretName:  prometheus-course-deploy-server-token-jhrvj
    Optional:    false
QoS Class:       BestEffort
Node-Selectors:  <none>
Tolerations:     node.kubernetes.io/not-ready:NoExecute for 300s
                 node.kubernetes.io/unreachable:NoExecute for 300s
Events:          <none>
root@ubuntu-s-1vcpu-2gb-lon1-01:~#  kubectl get pods,svc,pv,pvc -n prometheus
NAME                                                               READY   STATUS    RESTARTS   AGE
pod/grafana-course-deploy-68c8968f9f-np9b9                         1/1     Running   0          1h
pod/prometheus-course-deploy-kube-state-metrics-5b676d5d87-9c2tw   1/1     Running   0          1h
pod/prometheus-course-deploy-node-exporter-2shl2                   1/1     Running   0          1h
pod/prometheus-course-deploy-node-exporter-fm6w8                   1/1     Running   0          1h
pod/prometheus-course-deploy-server-5748f5f975-dp52k               2/2     Running   0          1h

NAME                                                  TYPE        CLUSTER-IP      EXTERNAL-IP   PORT(S)        AGE
service/grafana-course-deploy                         NodePort    100.69.248.75   <none>        80:30377/TCP   1h
service/prometheus-course-deploy-kube-state-metrics   ClusterIP   None            <none>        80/TCP         1h
service/prometheus-course-deploy-node-exporter        ClusterIP   None            <none>        9100/TCP       1h
service/prometheus-course-deploy-server               ClusterIP   100.68.41.209   <none>        80/TCP         1h

NAME                                                        CAPACITY   ACCESS MODES   RECLAIM POLICY   STATUS   CLAIM                                        STORAGECLASS   REASON   AGE
persistentvolume/pvc-28d9be7a-4358-11e9-b1ba-023d0745758e   2Gi        RWO            Delete           Bound    default/jenkins-course-udemy                 gp2                     1d
persistentvolume/pvc-79c6764f-4489-11e9-b1ba-023d0745758e   1Gi        RWO            Delete           Bound    prometheus/prometheus-course-deploy-server   gp2                     1h

NAME                                                    STATUS   VOLUME                                     CAPACITY   ACCESS MODES   STORAGECLASS   AGE
persistentvolumeclaim/prometheus-course-deploy-server   Bound    pvc-79c6764f-4489-11e9-b1ba-023d0745758e   1Gi        RWO            gp2            1h
root@ubuntu-s-1vcpu-2gb-lon1-01:~# kubectl describe pod grafana-course-deploy-68c8968f9f-np9b9 -n prometheus
Name:           grafana-course-deploy-68c8968f9f-np9b9
Namespace:      prometheus
Node:           ip-172-20-56-4.eu-central-1.compute.internal/172.20.56.4
Start Time:     Tue, 12 Mar 2019 05:41:26 +0000
Labels:         app=grafana
                pod-template-hash=2474524959
                release=grafana-course-deploy
Annotations:    <none>
Status:         Running
IP:             100.96.2.15
Controlled By:  ReplicaSet/grafana-course-deploy-68c8968f9f
Containers:
  grafana:
    Container ID:   docker://9209f516f921e438cbfce27ad75b55233169323b2c7daa358be5f01bb6c3cf3f
    Image:          grafana/grafana:6.0.0
    Image ID:       docker-pullable://grafana/grafana@sha256:b5098a06dc59d28b11120eab01d8d0147b526a175aa606f9978934b6b2224138
    Ports:          80/TCP, 3000/TCP
    Host Ports:     0/TCP, 0/TCP
    State:          Running
      Started:      Tue, 12 Mar 2019 05:41:38 +0000
    Ready:          True
    Restart Count:  0
    Liveness:       http-get http://:3000/api/health delay=60s timeout=30s period=10s #success=1 #failure=10
    Readiness:      http-get http://:3000/api/health delay=0s timeout=1s period=10s #success=1 #failure=3
    Environment:
      GF_SECURITY_ADMIN_USER:      <set to the key 'admin-user' in secret 'grafana-course-deploy'>      Optional: false
      GF_SECURITY_ADMIN_PASSWORD:  <set to the key 'admin-password' in secret 'grafana-course-deploy'>  Optional: false
    Mounts:
      /etc/grafana/grafana.ini from config (rw)
      /etc/grafana/ldap.toml from ldap (rw)
      /var/lib/grafana from storage (rw)
      /var/run/secrets/kubernetes.io/serviceaccount from grafana-course-deploy-token-v58zc (ro)
Conditions:
  Type           Status
  Initialized    True
  Ready          True
  PodScheduled   True
Volumes:
  config:
    Type:      ConfigMap (a volume populated by a ConfigMap)
    Name:      grafana-course-deploy
    Optional:  false
  ldap:
    Type:        Secret (a volume populated by a Secret)
    SecretName:  grafana-course-deploy
    Optional:    false
  storage:
    Type:    EmptyDir (a temporary directory that shares a pod's lifetime)
    Medium:
  grafana-course-deploy-token-v58zc:
    Type:        Secret (a volume populated by a Secret)
    SecretName:  grafana-course-deploy-token-v58zc
    Optional:    false
QoS Class:       BestEffort
Node-Selectors:  <none>
Tolerations:     node.kubernetes.io/not-ready:NoExecute for 300s
                 node.kubernetes.io/unreachable:NoExecute for 300s
Events:          <none>
root@ubuntu-s-1vcpu-2gb-lon1-01:~#
51. Exploring Prometheus Node Exporter
- We can see there are two different
node exporterpods created and running
root@ubuntu-s-1vcpu-2gb-lon1-01:~# kubectl get pods,svc,pv,pvc -n prometheus
NAME                                                               READY   STATUS    RESTARTS   AGE
pod/grafana-course-deploy-68c8968f9f-np9b9                         1/1     Running   0          10h
pod/prometheus-course-deploy-kube-state-metrics-5b676d5d87-9c2tw   1/1     Running   0          10h
pod/prometheus-course-deploy-node-exporter-2shl2                   1/1     Running   0          10h
pod/prometheus-course-deploy-node-exporter-fm6w8                   1/1     Running   0          10h
pod/prometheus-course-deploy-server-5748f5f975-dp52k               2/2     Running   0          10h

NAME                                                  TYPE        CLUSTER-IP      EXTERNAL-IP   PORT(S)        AGE
service/grafana-course-deploy                         NodePort    100.69.248.75   <none>        80:30377/TCP   10h
service/prometheus-course-deploy-kube-state-metrics   ClusterIP   None            <none>        80/TCP         10h
service/prometheus-course-deploy-node-exporter        ClusterIP   None            <none>        9100/TCP       10h
service/prometheus-course-deploy-server               ClusterIP   100.68.41.209   <none>        80/TCP         10h

NAME                                                        CAPACITY   ACCESS MODES   RECLAIM POLICY   STATUS   CLAIM                                        STORAGECLASS   REASON   AGE
persistentvolume/pvc-28d9be7a-4358-11e9-b1ba-023d0745758e   2Gi        RWO            Delete           Bound    default/jenkins-course-udemy                 gp2                     1d
persistentvolume/pvc-79c6764f-4489-11e9-b1ba-023d0745758e   1Gi        RWO            Delete           Bound    prometheus/prometheus-course-deploy-server   gp2                     10h

NAME                                                    STATUS   VOLUME                                     CAPACITY   ACCESS MODES   STORAGECLASS   AGE
persistentvolumeclaim/prometheus-course-deploy-server   Bound    pvc-79c6764f-4489-11e9-b1ba-023d0745758e   1Gi        RWO            gp2            10h
- Each of them is running in a different node
root@ubuntu-s-1vcpu-2gb-lon1-01:~# kubectl describe pod prometheus-course-deploy-node-exporter-2shl2 -n prometheus
Name:           prometheus-course-deploy-node-exporter-2shl2
Namespace:      prometheus
Node:           ip-172-20-50-246.eu-central-1.compute.internal/172.20.50.246
Start Time:     Tue, 12 Mar 2019 05:41:25 +0000
Labels:         app=prometheus
                chart=prometheus-8.8.1
                component=node-exporter
                controller-revision-hash=917977665
                heritage=Tiller
                pod-template-generation=1
                release=prometheus-course-deploy
Annotations:    <none>
Status:         Running
IP:             172.20.50.246
Controlled By:  DaemonSet/prometheus-course-deploy-node-exporter
Containers:
  prometheus-node-exporter:
    Container ID:  docker://dfa256b9ab9a7862907568d46c40f02b92bff5d8cb15ac481e889f1a475e5d36
    Image:         prom/node-exporter:v0.17.0
    Image ID:      docker-pullable://prom/node-exporter@sha256:c390c8fea4cd362a28ad5070aedd6515aacdfdffd21de6db42ead05e332be5a9
    Port:          9100/TCP
    Host Port:     9100/TCP
    Args:
      --path.procfs=/host/proc
      --path.sysfs=/host/sys
    State:          Running
      Started:      Tue, 12 Mar 2019 05:41:26 +0000
    Ready:          True
    Restart Count:  0
    Environment:    <none>
    Mounts:
      /host/proc from proc (ro)
      /host/sys from sys (ro)
      /var/run/secrets/kubernetes.io/serviceaccount from prometheus-course-deploy-node-exporter-token-hhqh9 (ro)
Conditions:
  Type           Status
  Initialized    True
  Ready          True
  PodScheduled   True
Volumes:
  proc:
    Type:          HostPath (bare host directory volume)
    Path:          /proc
    HostPathType:
  sys:
    Type:          HostPath (bare host directory volume)
    Path:          /sys
    HostPathType:
  prometheus-course-deploy-node-exporter-token-hhqh9:
    Type:        Secret (a volume populated by a Secret)
    SecretName:  prometheus-course-deploy-node-exporter-token-hhqh9
    Optional:    false
QoS Class:       BestEffort
Node-Selectors:  <none>
Tolerations:     node.kubernetes.io/disk-pressure:NoSchedule
                 node.kubernetes.io/memory-pressure:NoSchedule
                 node.kubernetes.io/not-ready:NoExecute
                 node.kubernetes.io/unreachable:NoExecute
Events:          <none>
root@ubuntu-s-1vcpu-2gb-lon1-01:~# kubectl describe pod prometheus-course-deploy-node-exporter-fm6w8 -n prometheus
Name:           prometheus-course-deploy-node-exporter-fm6w8
Namespace:      prometheus
Node:           ip-172-20-56-4.eu-central-1.compute.internal/172.20.56.4
Start Time:     Tue, 12 Mar 2019 05:41:25 +0000
Labels:         app=prometheus
                chart=prometheus-8.8.1
                component=node-exporter
                controller-revision-hash=917977665
                heritage=Tiller
                pod-template-generation=1
                release=prometheus-course-deploy
Annotations:    <none>
Status:         Running
IP:             172.20.56.4
Controlled By:  DaemonSet/prometheus-course-deploy-node-exporter
Containers:
  prometheus-node-exporter:
    Container ID:  docker://46c6e8a9045c1e5c7cfe12bca8653d6abd22828395cd8b3f8cbd912afb6f665d
    Image:         prom/node-exporter:v0.17.0
    Image ID:      docker-pullable://prom/node-exporter@sha256:c390c8fea4cd362a28ad5070aedd6515aacdfdffd21de6db42ead05e332be5a9
    Port:          9100/TCP
    Host Port:     9100/TCP
    Args:
      --path.procfs=/host/proc
      --path.sysfs=/host/sys
    State:          Running
      Started:      Tue, 12 Mar 2019 05:41:26 +0000
    Ready:          True
    Restart Count:  0
    Environment:    <none>
    Mounts:
      /host/proc from proc (ro)
      /host/sys from sys (ro)
      /var/run/secrets/kubernetes.io/serviceaccount from prometheus-course-deploy-node-exporter-token-hhqh9 (ro)
Conditions:
  Type           Status
  Initialized    True
  Ready          True
  PodScheduled   True
Volumes:
  proc:
    Type:          HostPath (bare host directory volume)
    Path:          /proc
    HostPathType:
  sys:
    Type:          HostPath (bare host directory volume)
    Path:          /sys
    HostPathType:
  prometheus-course-deploy-node-exporter-token-hhqh9:
    Type:        Secret (a volume populated by a Secret)
    SecretName:  prometheus-course-deploy-node-exporter-token-hhqh9
    Optional:    false
QoS Class:       BestEffort
Node-Selectors:  <none>
Tolerations:     node.kubernetes.io/disk-pressure:NoSchedule
                 node.kubernetes.io/memory-pressure:NoSchedule
                 node.kubernetes.io/not-ready:NoExecute
                 node.kubernetes.io/unreachable:NoExecute
Events:          <none>
root@ubuntu-s-1vcpu-2gb-lon1-01:~# for i in pod/prometheus-course-deploy-node-exporter-fm6w8 pod/prometheus-course-deploy-node-exporter-2shl2; do kubectl describe $i -n prometheus | grep "Node:"; done
Node:           ip-172-20-56-4.eu-central-1.compute.internal/172.20.56.4
Node:           ip-172-20-50-246.eu-central-1.compute.internal/172.20.50.246
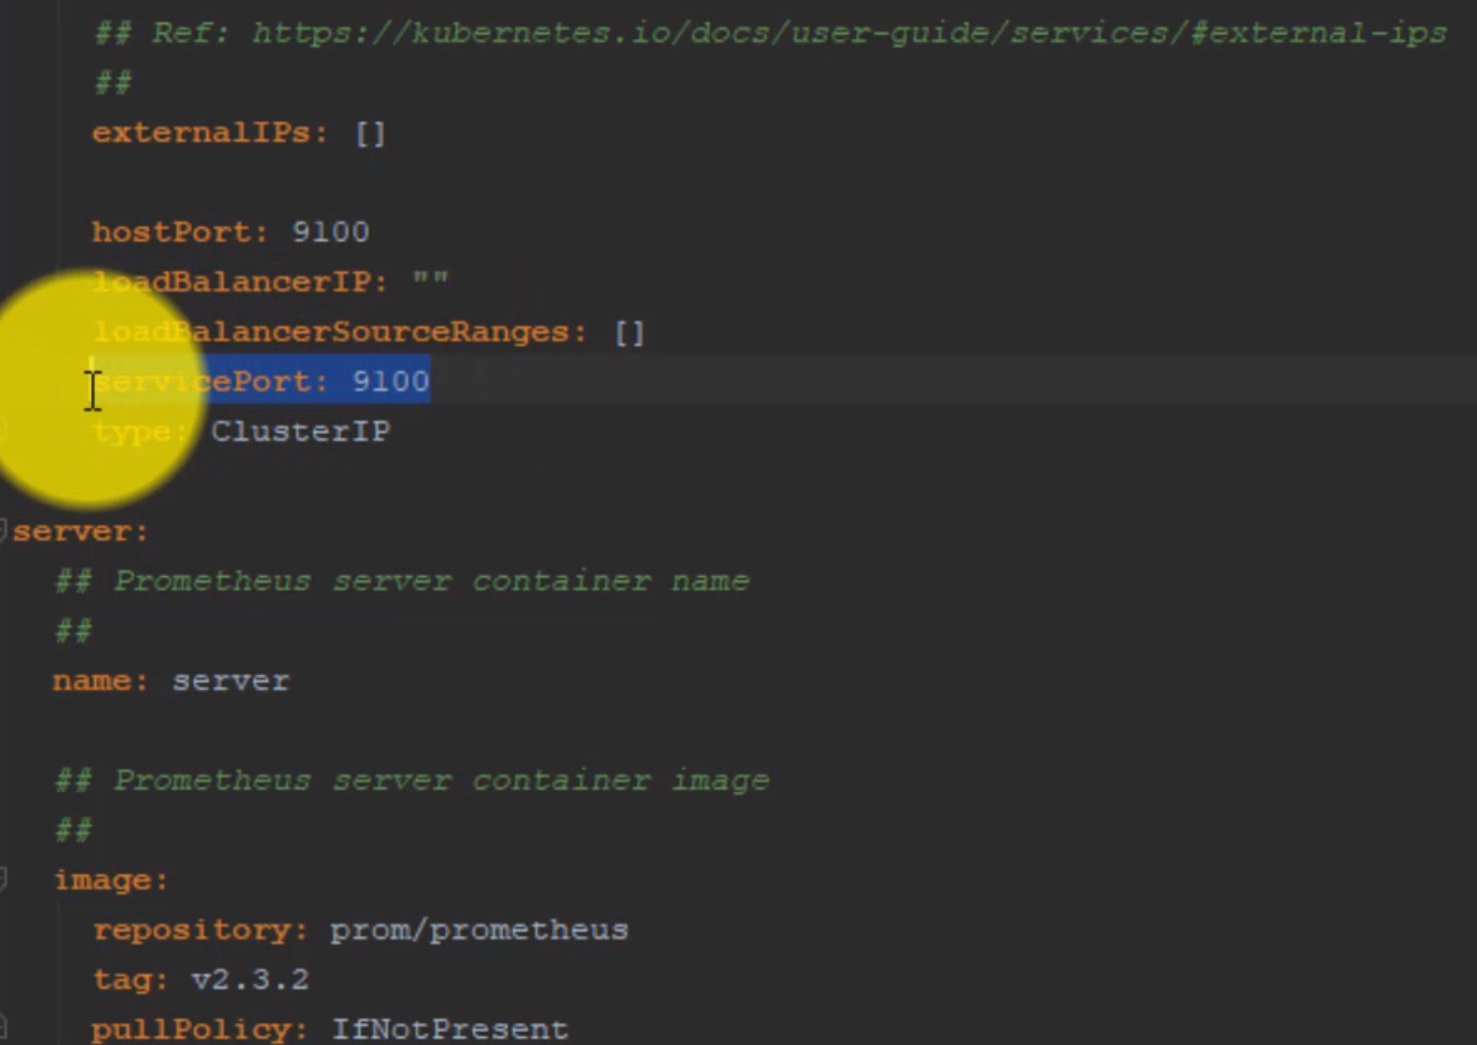
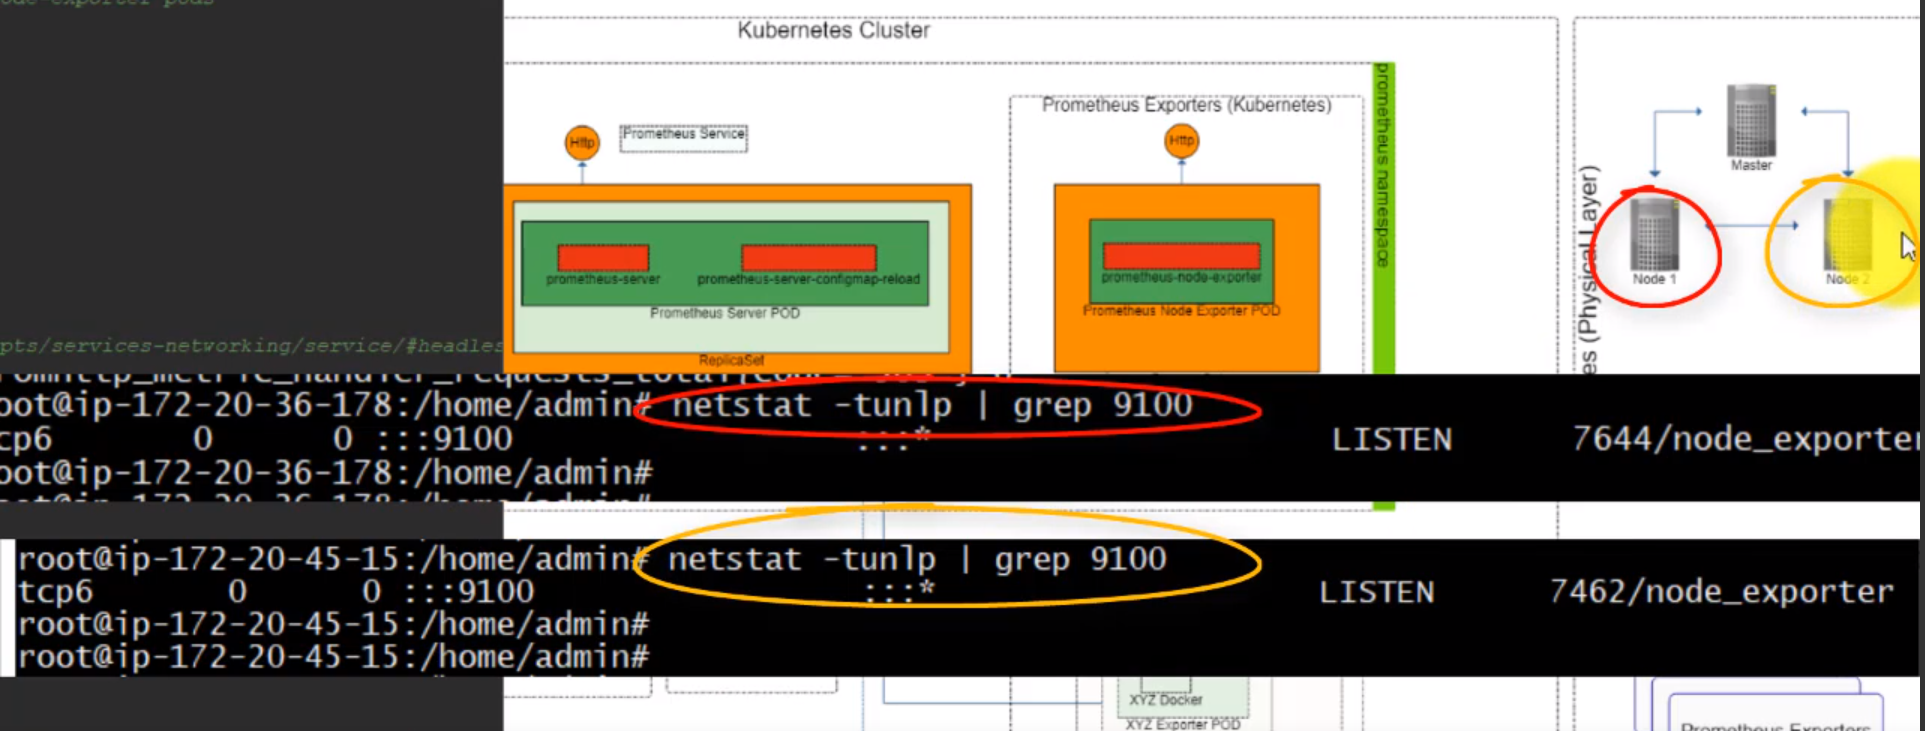
- The
node portis the same for themasterand thenodes.
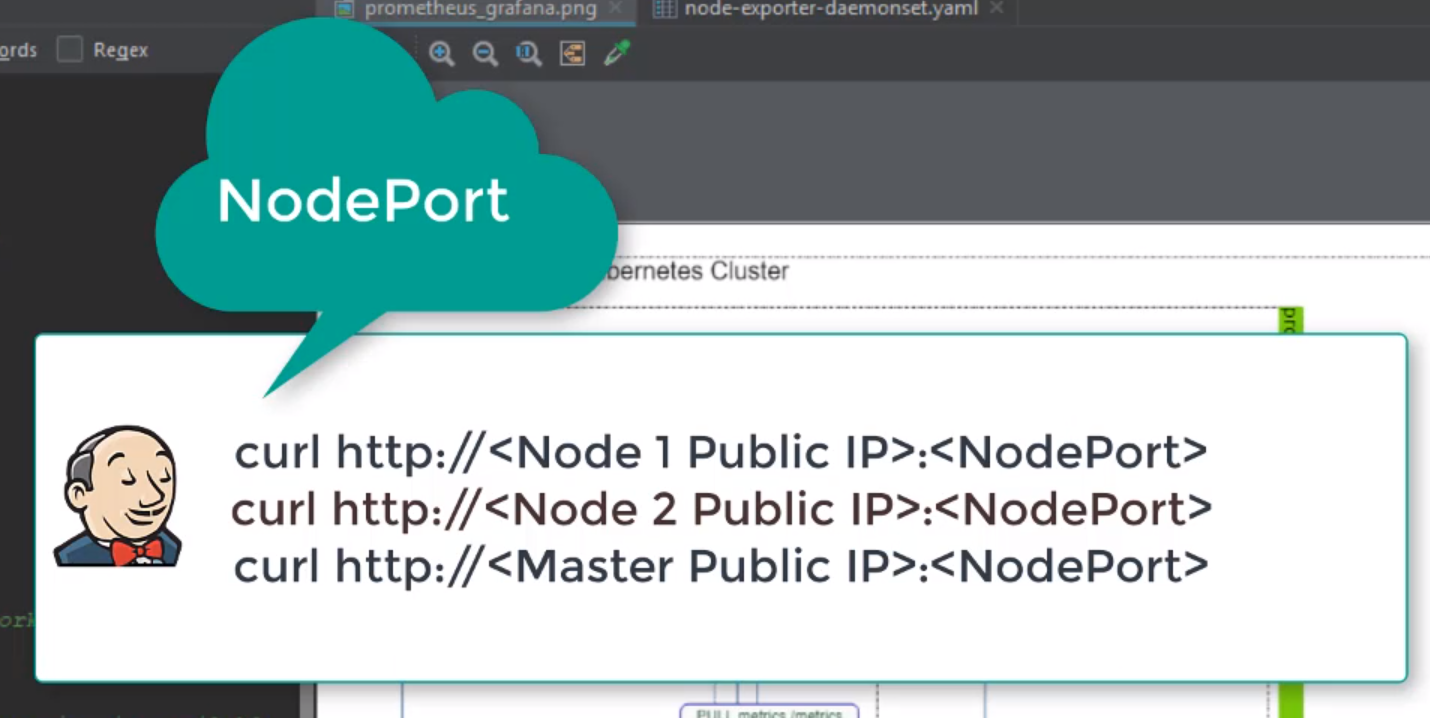
- Connect to one node:
root@ubuntu-s-1vcpu-2gb-lon1-01:~# ssh -i ~/.ssh/udemy_devopsinuse admin@ec2-18-184-104-252.eu-central-1.compute.amazonaws.com

The programs included with the Debian GNU/Linux system are free software;
the exact distribution terms for each program are described in the
individual files in /usr/share/doc/*/copyright.

Debian GNU/Linux comes with ABSOLUTELY NO WARRANTY, to the extent
permitted by applicable law.
Last login: Sat Mar  9 11:01:30 2019 from 68.183.44.204
admin@ip-172-20-50-246:~$ sudo bash
root@ip-172-20-50-246:/home/admin# netstat -tunlp | grep 9100
tcp6       0      0 :::9100                 :::*                    LISTEN      29309/node_exporter
- And to the other node in another terminal:
root@ubuntu-s-1vcpu-2gb-lon1-01:~# ssh -i ~/.ssh/udemy_devopsinuse admin@ec2-18-184-88-177.eu-central-1.compute.amazonaws.com

The programs included with the Debian GNU/Linux system are free software;
the exact distribution terms for each program are described in the
individual files in /usr/share/doc/*/copyright.

Debian GNU/Linux comes with ABSOLUTELY NO WARRANTY, to the extent
permitted by applicable law.
Last login: Sat Mar  9 11:06:53 2019 from 68.183.44.204
admin@ip-172-20-56-4:~$ sudo bash
root@ip-172-20-56-4:/home/admin# netstat -tunlp | grep 9100
tcp6       0      0 :::9100                 :::*                    LISTEN      3769/node_exporter
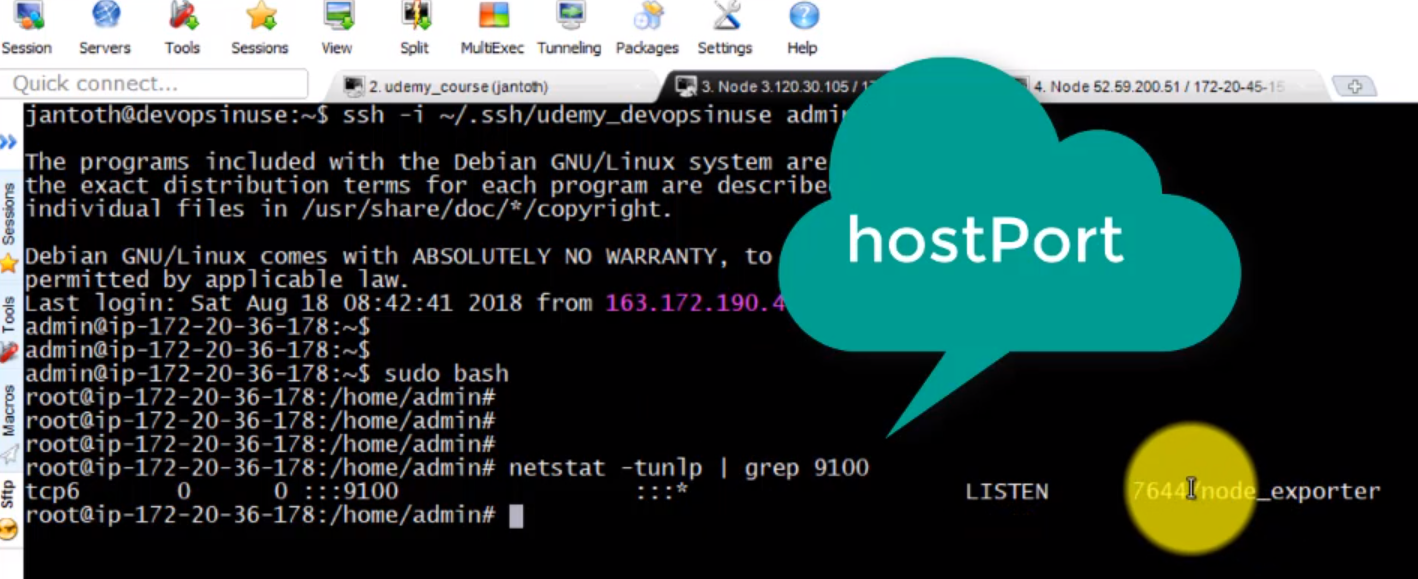
`bash root@ip-172-20-50-246:/home/admin# curl localhost:9100/metrics
HELP go_gc_duration_seconds A summary of the GC invocation durations.
TYPE go_gc_duration_seconds summary
go_gc_duration_seconds{quantile="0"} 1.2539e-05 go_gc_duration_seconds{quantile="0.25"} 1.5765e-05 go_gc_duration_seconds{quantile="0.5"} 1.7678e-05 . . . promhttp_metric_handler_requests_in_flight 1
HELP promhttp_metric_handler_requests_total Total number of scrapes by HTTP status code.
TYPE promhttp_metric_handler_requests_total counter
promhttp_metric_handler_requests_total{code="200"} 0 promhttp_metric_handler_requests_total{code="500"} 0 promhttp_metric_handler_requests_total{code="503"} 0 ``
root@ip-172-20-56-4:/home/admin# curl localhost:9100/metrics
# HELP go_gc_duration_seconds A summary of the GC invocation durations.
# TYPE go_gc_duration_seconds summary
go_gc_duration_seconds{quantile="0"} 1.3978e-05
go_gc_duration_seconds{quantile="0.25"} 1.547e-05
go_gc_duration_seconds{quantile="0.5"} 1.6704e-05
.
.
.
# HELP promhttp_metric_handler_requests_total Total number of scrapes by HTTP status code.
# TYPE promhttp_metric_handler_requests_total counter
promhttp_metric_handler_requests_total{code="200"} 0
promhttp_metric_handler_requests_total{code="500"} 0
promhttp_metric_handler_requests_total{code="503"} 0
- Go to https://eu-central-1.console.aws.amazon.com/ec2
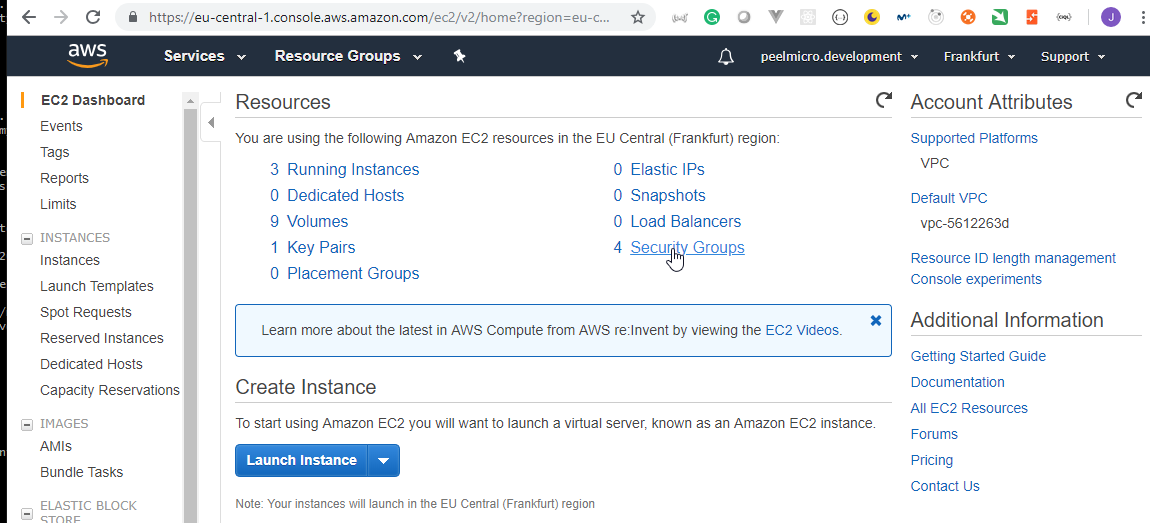
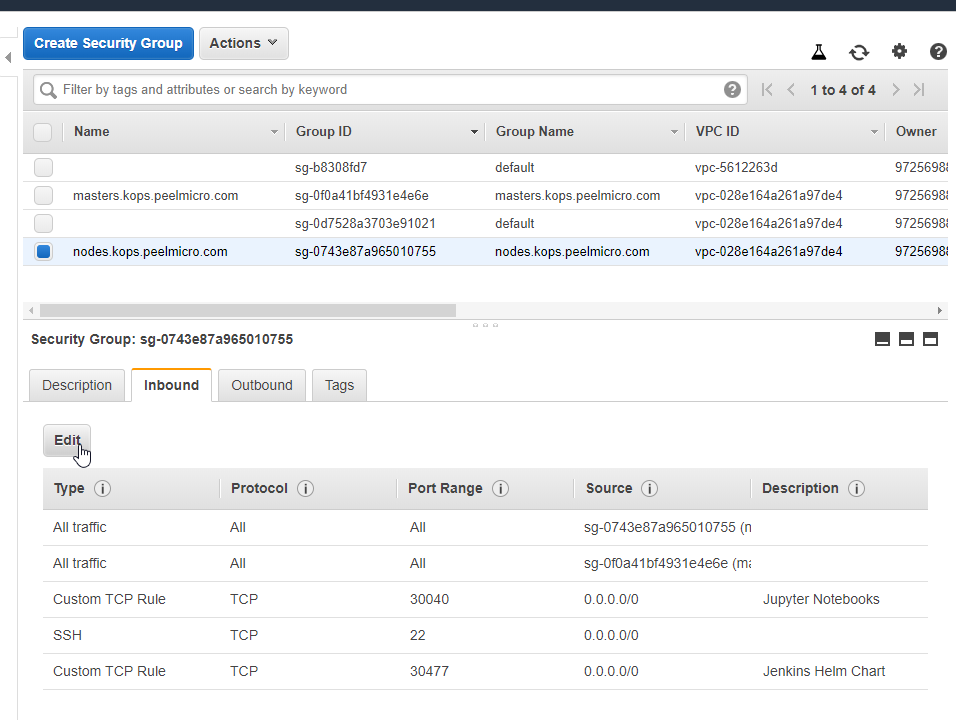
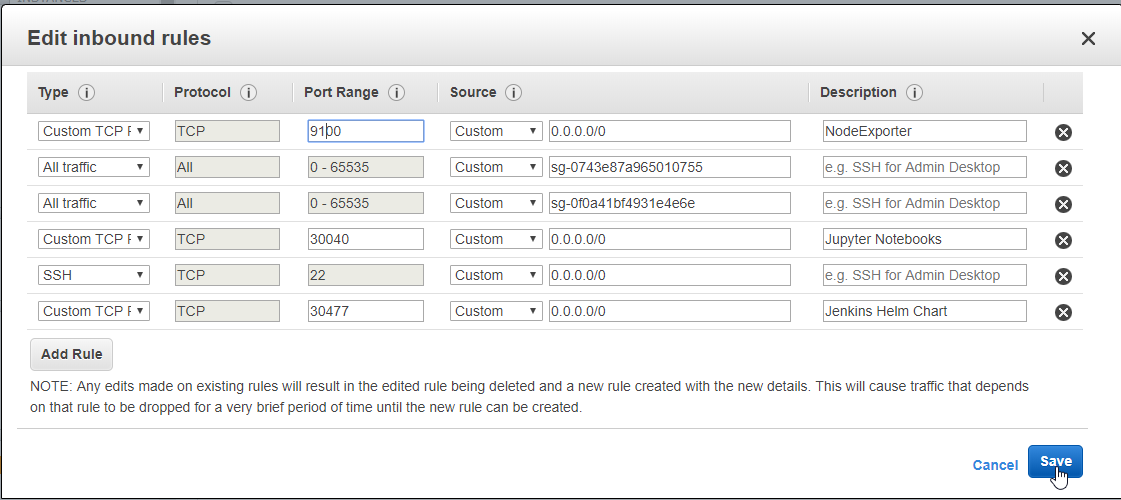

- Go to http://18.184.104.252:9100/

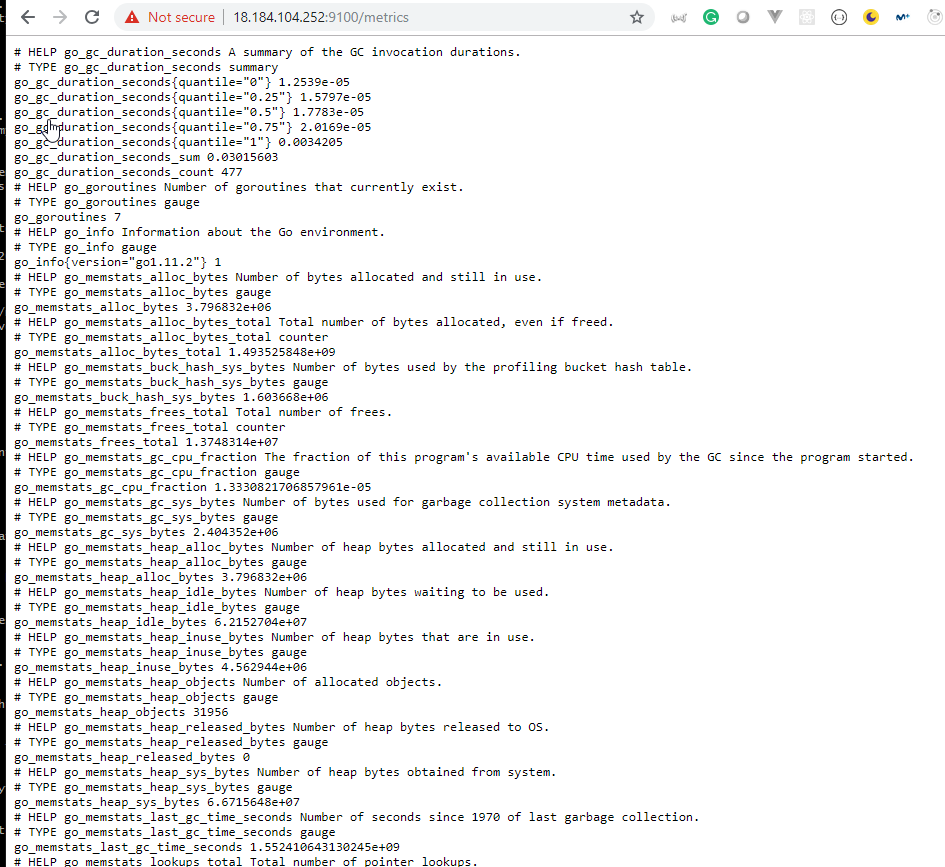
- Go to http://18.184.88.177:9100/

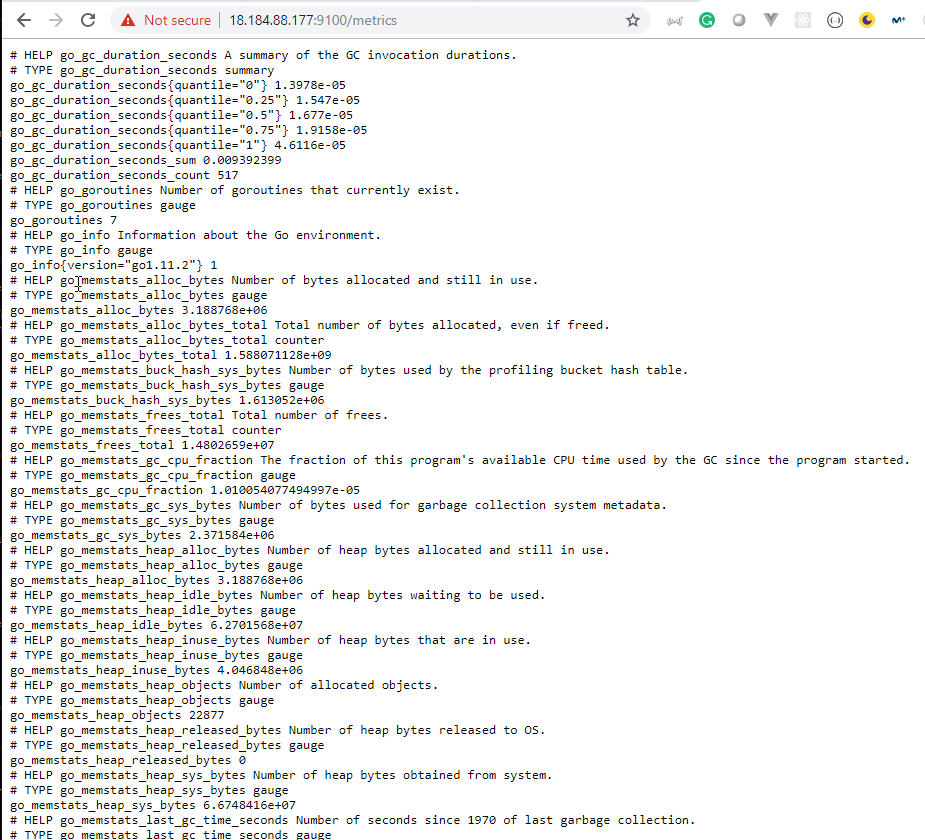
52. Explore Prometheus Web User Interface
- We need to modify the current service type of the Prometheus server to NodePort in order to be able to access it. We are going to use grafana to see the information generated by Prometheus, but Prometheus has its own Web Interface that we can access to.
root@ubuntu-s-1vcpu-2gb-lon1-01:~# kubectl get pods,svc -n prometheus
NAME                                                               READY   STATUS    RESTARTS   AGE
pod/grafana-course-deploy-68c8968f9f-np9b9                         1/1     Running   0          11h
pod/prometheus-course-deploy-kube-state-metrics-5b676d5d87-9c2tw   1/1     Running   0          11h
pod/prometheus-course-deploy-node-exporter-2shl2                   1/1     Running   0          11h
pod/prometheus-course-deploy-node-exporter-fm6w8                   1/1     Running   0          11h
pod/prometheus-course-deploy-server-5748f5f975-dp52k               2/2     Running   0          11h

NAME                                                  TYPE        CLUSTER-IP      EXTERNAL-IP   PORT(S)        AGE
service/grafana-course-deploy                         NodePort    100.69.248.75   <none>        80:30377/TCP   11h
service/prometheus-course-deploy-kube-state-metrics   ClusterIP   None            <none>        80/TCP         11h
service/prometheus-course-deploy-node-exporter        ClusterIP   None            <none>        9100/TCP       11h
service/prometheus-course-deploy-server               ClusterIP   100.68.41.209   <none>        80/TCP         11h
As we can see, right now the
service/prometheus-course-deploy-serverservice os aClusterIPtype, so, we are not able to access from outside the cluster.We need to modify the
prometheus/values.yamldocument to changeserver: service: type: ClusterIPtoserver: service: type: NodePort
root@ubuntu-s-1vcpu-2gb-lon1-01:~/local_charts/prometheus_grafana# vi prometheus/values.yaml
root@ubuntu-s-1vcpu-2gb-lon1-01:~/local_charts/prometheus_grafana#
- Execute the following command again to update the deployment
root@ubuntu-s-1vcpu-2gb-lon1-01:~/local_charts/prometheus_grafana# helmfile -f helmfile_specification_pg.yaml sync
exec: helm repo update --kube-context kops.peelmicro.com
Hang tight while we grab the latest from your chart repositories...
...Skip local chart repository
...Successfully got an update from the "incubator" chart repository
...Successfully got an update from the "stable" chart repository
Update Complete. ? Happy Helming!?
exec: helm upgrade --install --reset-values grafana-course-deploy stable/grafana --namespace prometheus --values /root/local_charts/prometheus_grafana/grafana/values.yaml --kube-context kops.peelmicro.com
exec: helm upgrade --install --reset-values prometheus-course-deploy stable/prometheus --namespace prometheus --values /root/local_charts/prometheus_grafana/prometheus/values.yaml --kube-context kops.peelmicro.com
Release "grafana-course-deploy" has been upgraded. Happy Helming!
LAST DEPLOYED: Tue Mar 12 17:26:35 2019
NAMESPACE: prometheus
STATUS: DEPLOYED

RESOURCES:
==> v1/ServiceAccount
NAME                   SECRETS  AGE
grafana-course-deploy  1        11h

==> v1/ClusterRole
NAME                               AGE
grafana-course-deploy-clusterrole  11h

==> v1/ClusterRoleBinding
NAME                                      AGE
grafana-course-deploy-clusterrolebinding  11h

==> v1beta1/Role
NAME                   AGE
grafana-course-deploy  11h

==> v1beta1/RoleBinding
NAME                   AGE
grafana-course-deploy  11h

==> v1/Service
NAME                   TYPE      CLUSTER-IP     EXTERNAL-IP  PORT(S)       AGE
grafana-course-deploy  NodePort  100.69.248.75  <none>       80:30377/TCP  11h

==> v1beta2/Deployment
NAME                   DESIRED  CURRENT  UP-TO-DATE  AVAILABLE  AGE
grafana-course-deploy  1        1        1           1          11h

==> v1/ConfigMap
NAME                   DATA  AGE
grafana-course-deploy  1     11h

==> v1beta1/PodSecurityPolicy
NAME                   DATA   CAPS      SELINUX   RUNASUSER  FSGROUP   SUPGROUP  READONLYROOTFS  VOLUMES
grafana-course-deploy  false  RunAsAny  RunAsAny  RunAsAny   RunAsAny  false     configMap,emptyDir,projected,secret,downwardAPI,persistentVolumeClaim

==> v1/Pod(related)
NAME                                    READY  STATUS   RESTARTS  AGE
grafana-course-deploy-68c8968f9f-np9b9  1/1    Running  0         11h

==> v1/Secret
NAME                   TYPE    DATA  AGE
grafana-course-deploy  Opaque  3     11h


NOTES:
1. Get your 'admin' user password by running:

   kubectl get secret --namespace prometheus grafana-course-deploy -o jsonpath="{.data.admin-password}" | base64 --decode ; echo

2. The Grafana server can be accessed via port 80 on the following DNS name from within your cluster:

   grafana-course-deploy.prometheus.svc.cluster.local

   Get the Grafana URL to visit by running these commands in the same shell:
export NODE_PORT=$(kubectl get --namespace prometheus -o jsonpath="{.spec.ports[0].nodePort}" services grafana-course-deploy)
     export NODE_IP=$(kubectl get nodes --namespace prometheus -o jsonpath="{.items[0].status.addresses[0].address}")
     echo http://$NODE_IP:$NODE_PORT


3. Login with the password from step 1 and the username: admin
#################################################################################
######   WARNING: Persistence is disabled!!! You will lose your data when   #####
######            the Grafana pod is terminated.                            #####
#################################################################################

Release "prometheus-course-deploy" has been upgraded. Happy Helming!
LAST DEPLOYED: Tue Mar 12 17:26:35 2019
NAMESPACE: prometheus
STATUS: DEPLOYED

RESOURCES:
==> v1/ServiceAccount
NAME                                         SECRETS  AGE
prometheus-course-deploy-kube-state-metrics  1        11h
prometheus-course-deploy-node-exporter       1        11h
prometheus-course-deploy-server              1        11h

==> v1beta1/ClusterRole
NAME                                         AGE
prometheus-course-deploy-kube-state-metrics  11h
prometheus-course-deploy-server              11h

==> v1beta1/ClusterRoleBinding
NAME                                         AGE
prometheus-course-deploy-kube-state-metrics  11h
prometheus-course-deploy-server              11h

==> v1beta1/Deployment
NAME                                         DESIRED  CURRENT  UP-TO-DATE  AVAILABLE  AGE
prometheus-course-deploy-kube-state-metrics  1        1        1           1          11h
prometheus-course-deploy-server              1        1        1           1          11h

==> v1/Pod(related)
NAME                                                          READY  STATUS   RESTARTS  AGE
prometheus-course-deploy-node-exporter-2shl2                  1/1    Running  0         11h
prometheus-course-deploy-node-exporter-fm6w8                  1/1    Running  0         11h
prometheus-course-deploy-kube-state-metrics-5b676d5d87-9c2tw  1/1    Running  0         11h
prometheus-course-deploy-server-5748f5f975-dp52k              2/2    Running  0         11h

==> v1/PersistentVolumeClaim
NAME                             STATUS  VOLUME                                    CAPACITY  ACCESS MODES  STORAGECLASS  AGE
prometheus-course-deploy-server  Bound   pvc-79c6764f-4489-11e9-b1ba-023d0745758e  1Gi       RWO           gp2           11h

==> v1/Service
NAME                                         TYPE       CLUSTER-IP     EXTERNAL-IP  PORT(S)       AGE
prometheus-course-deploy-kube-state-metrics  ClusterIP  None           <none>       80/TCP        11h
prometheus-course-deploy-node-exporter       ClusterIP  None           <none>       9100/TCP      11h
prometheus-course-deploy-server              NodePort   100.68.41.209  <none>       80:30186/TCP  11h

==> v1beta1/DaemonSet
NAME                                    DESIRED  CURRENT  READY  UP-TO-DATE  AVAILABLE  NODE SELECTOR  AGE
prometheus-course-deploy-node-exporter  2        2        2      2           2          <none>         11h

==> v1/ConfigMap
NAME                             DATA  AGE
prometheus-course-deploy-server  3     11h


NOTES:
The Prometheus server can be accessed via port 80 on the following DNS name from within your cluster:
prometheus-course-deploy-server.prometheus.svc.cluster.local


Get the Prometheus server URL by running these commands in the same shell:
  export NODE_PORT=$(kubectl get --namespace prometheus -o jsonpath="{.spec.ports[0].nodePort}" services prometheus-course-deploy-server)
  export NODE_IP=$(kubectl get nodes --namespace prometheus -o jsonpath="{.items[0].status.addresses[0].address}")
  echo http://$NODE_IP:$NODE_PORT


```bash
root@ubuntu-s-1vcpu-2gb-lon1-01:~/local_charts/prometheus_grafana# kubectl get pods,svc -n prometheus
NAME                                                               READY   STATUS    RESTARTS   AGE
pod/grafana-course-deploy-68c8968f9f-np9b9                         1/1     Running   0          11h
pod/prometheus-course-deploy-kube-state-metrics-5b676d5d87-9c2tw   1/1     Running   0          11h
pod/prometheus-course-deploy-node-exporter-2shl2                   1/1     Running   0          11h
pod/prometheus-course-deploy-node-exporter-fm6w8                   1/1     Running   0          11h
pod/prometheus-course-deploy-server-5748f5f975-dp52k               2/2     Running   0          11h

NAME                                                  TYPE        CLUSTER-IP      EXTERNAL-IP   PORT(S)        AGE
service/grafana-course-deploy                         NodePort    100.69.248.75   <none>        80:30377/TCP   11h
service/prometheus-course-deploy-kube-state-metrics   ClusterIP   None            <none>        80/TCP         11h
service/prometheus-course-deploy-node-exporter        ClusterIP   None            <none>        9100/TCP       11h
service/prometheus-course-deploy-server               NodePort    100.68.41.209   <none>        80:30186/TCP   11h
root@ubuntu-s-1vcpu-2gb-lon1-01:~/local_charts/prometheus_grafana#

For more information on running Prometheus, visit:
https://prometheus.io/
- We need to open the
30186port.
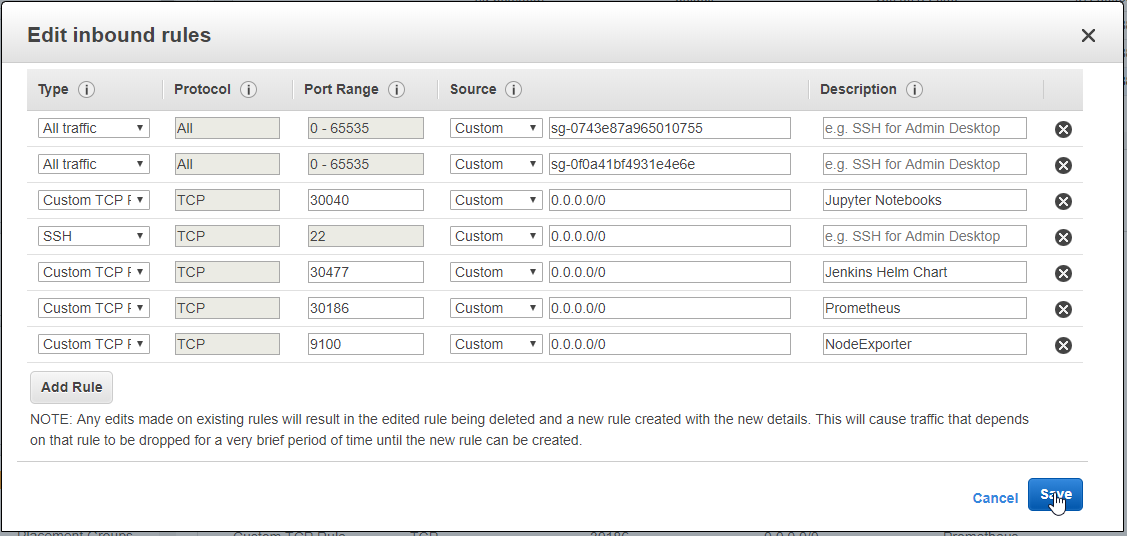
- Go to http://18.184.104.252:3018
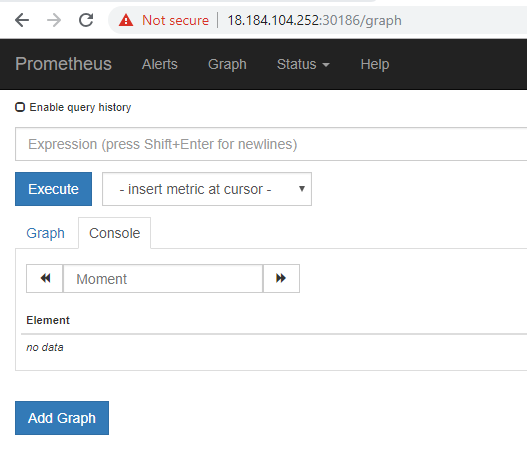
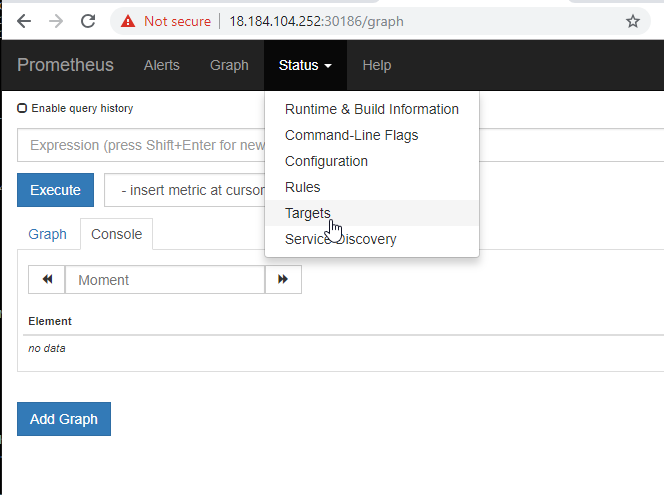
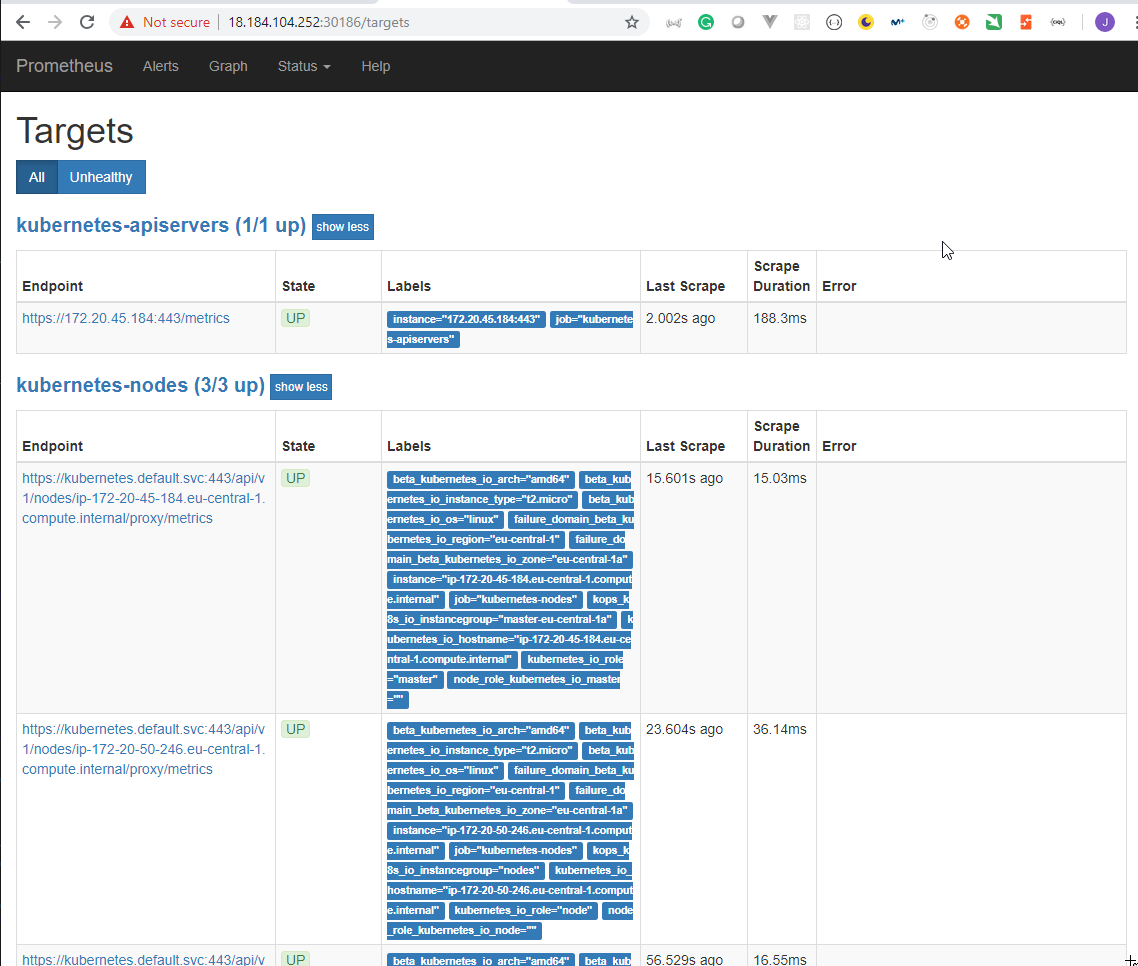
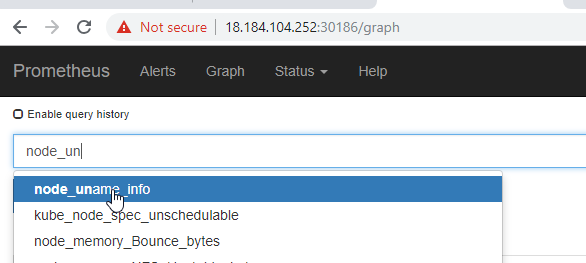
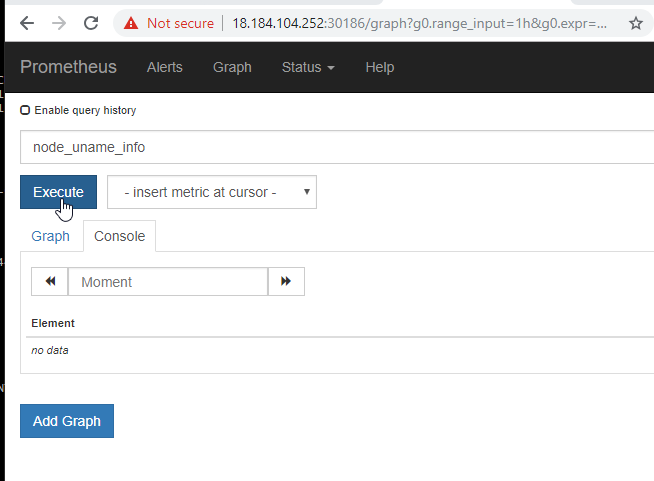
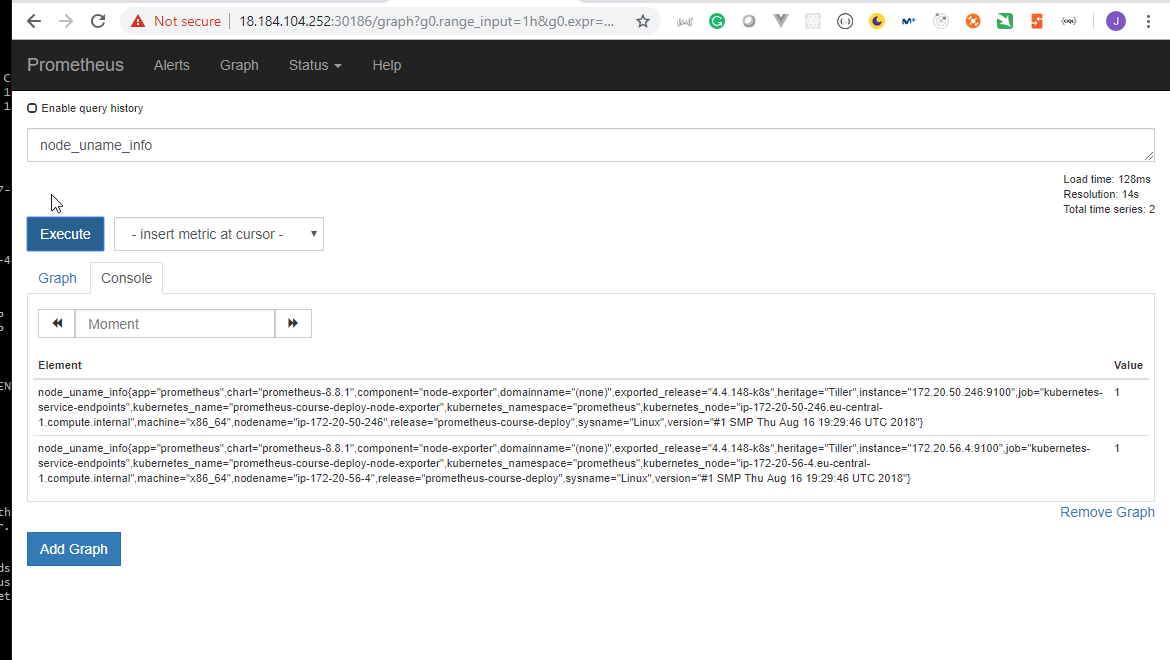
53. Explore Grafana Web User Interface
root@ubuntu-s-1vcpu-2gb-lon1-01:~# kubectl get pods,svc -n prometheus
NAME                                                               READY   STATUS    RESTARTS   AGE
pod/grafana-course-deploy-68c8968f9f-np9b9                         1/1     Running   0          11h
pod/prometheus-course-deploy-kube-state-metrics-5b676d5d87-9c2tw   1/1     Running   0          11h
pod/prometheus-course-deploy-node-exporter-2shl2                   1/1     Running   0          11h
pod/prometheus-course-deploy-node-exporter-fm6w8                   1/1     Running   0          11h
pod/prometheus-course-deploy-server-5748f5f975-dp52k               2/2     Running   0          11h

NAME                                                  TYPE        CLUSTER-IP      EXTERNAL-IP   PORT(S)        AGE
service/grafana-course-deploy                         NodePort    100.69.248.75   <none>        80:30377/TCP   11h
service/prometheus-course-deploy-kube-state-metrics   ClusterIP   None            <none>        80/TCP         11h
service/prometheus-course-deploy-node-exporter        ClusterIP   None            <none>        9100/TCP       11h
service/prometheus-course-deploy-server               NodePort    100.68.41.209   <none>        80:30186/TCP   11h
root@ubuntu-s-1vcpu-2gb-lon1-01:~#
The
grafanaservice is already aNodePorttype, so we can access it from outside the cluster.We need to open the
30377port.
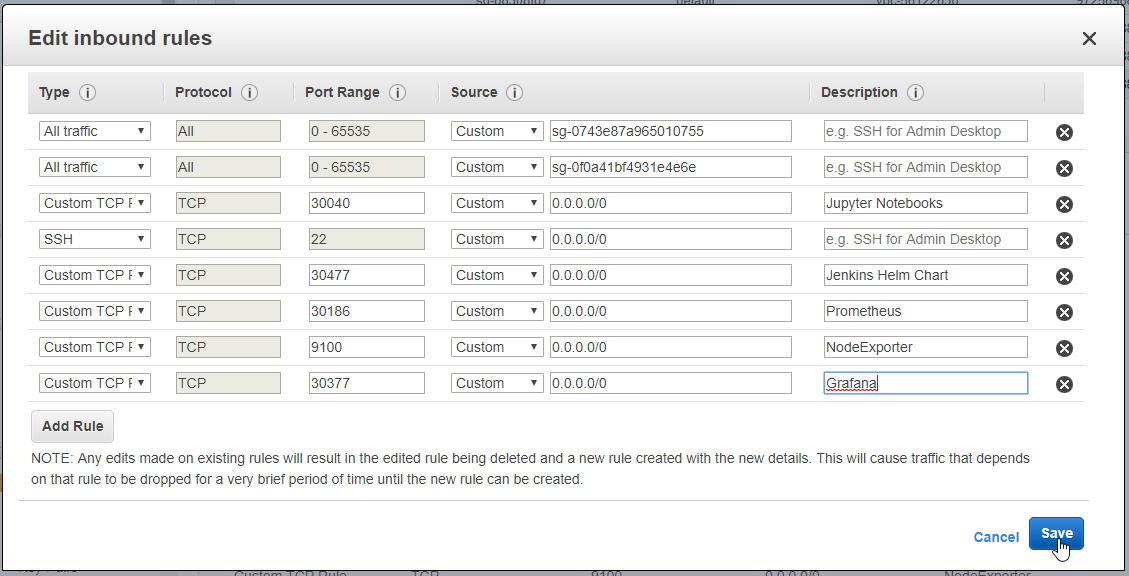
- Go to http://18.184.88.177:30377
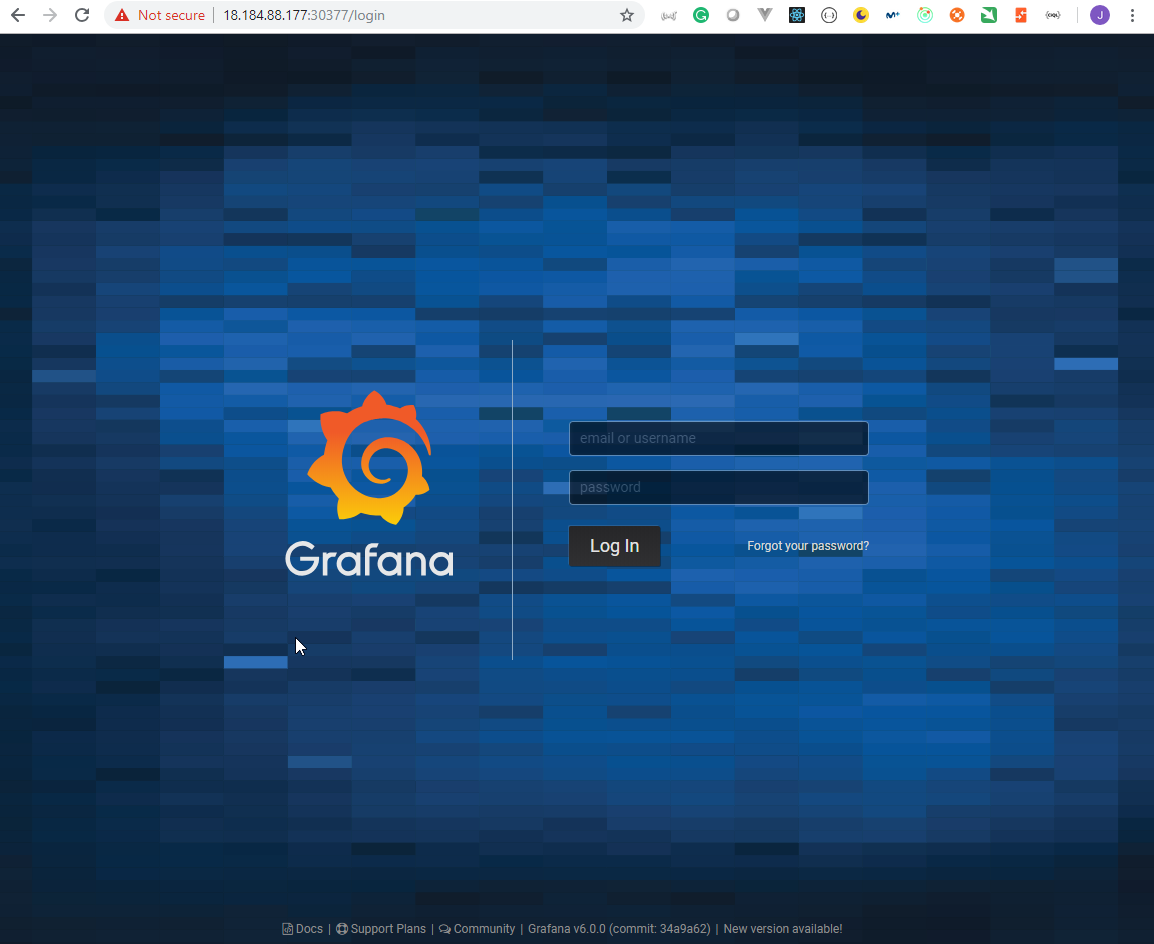
- Enter the
adminuser with theStart123#password.
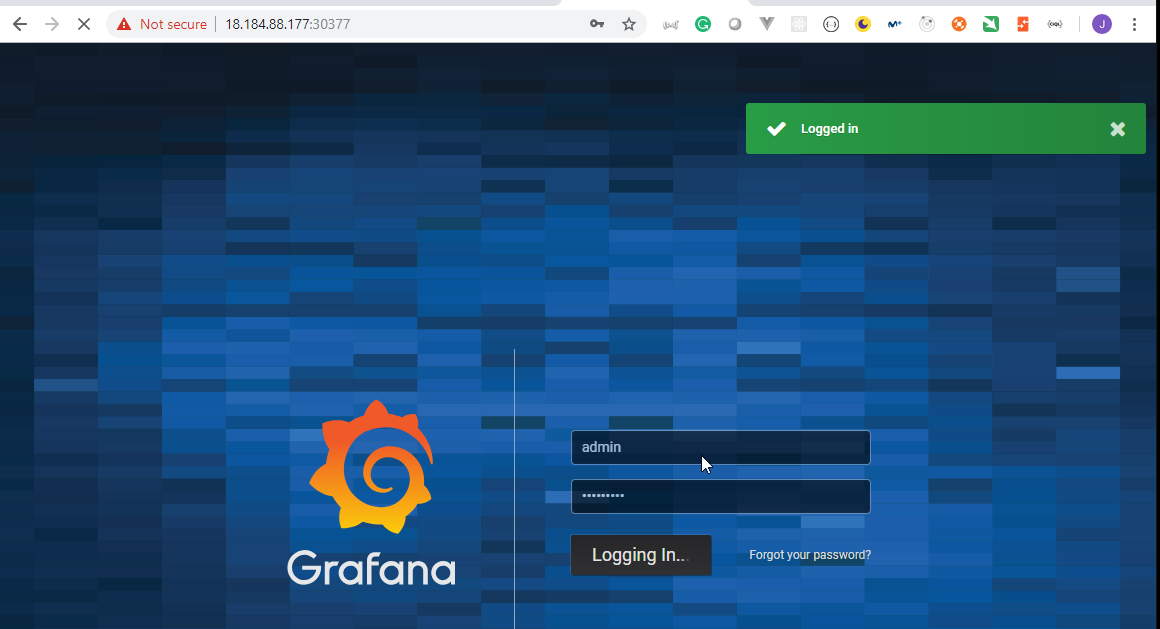
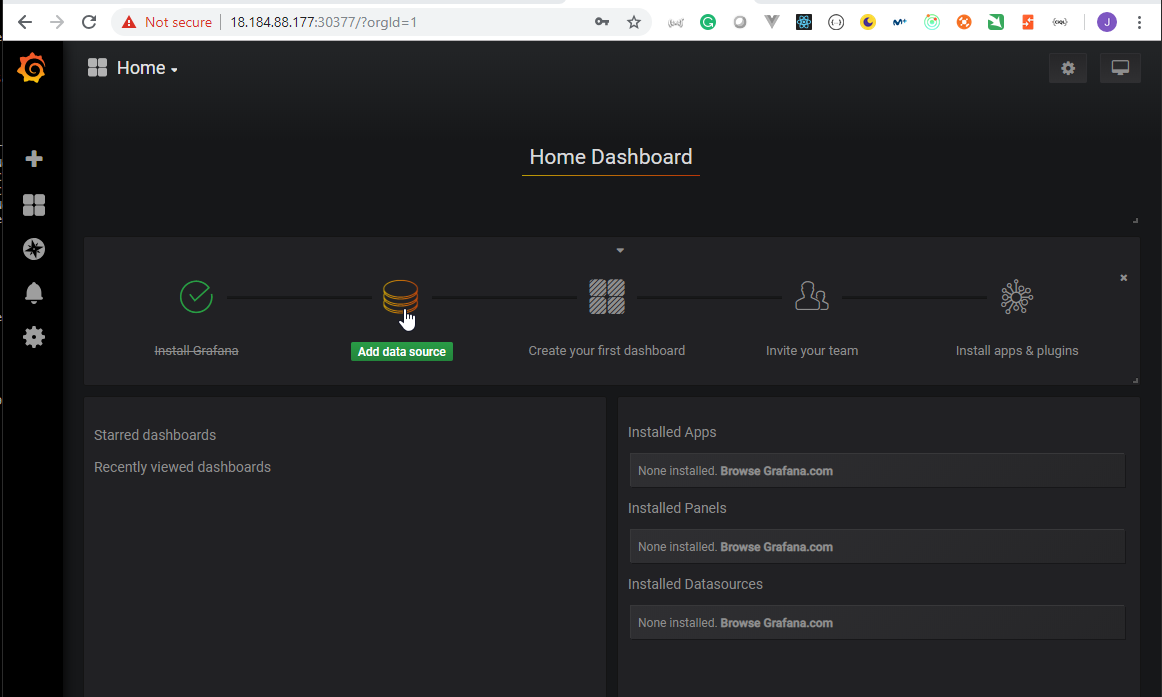
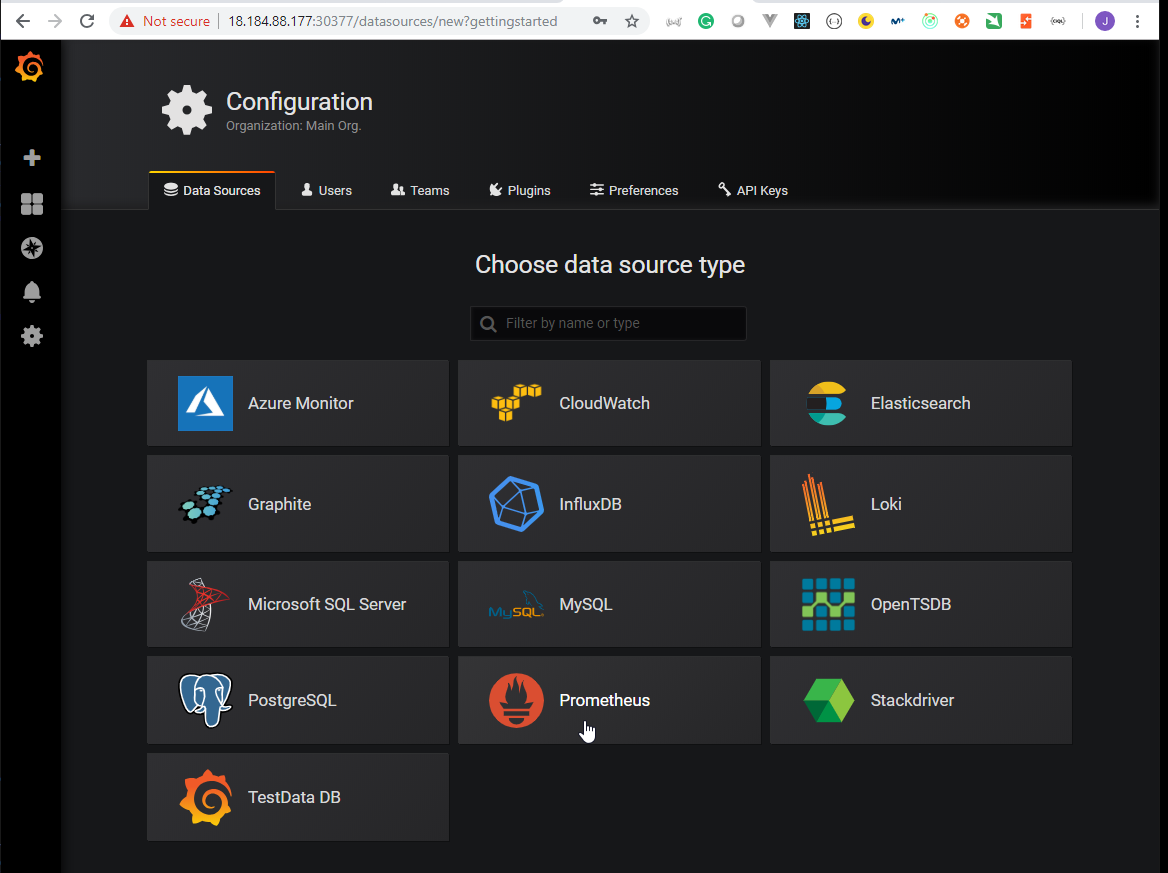
httpserver can be taken from theprometheusservice:
root@ubuntu-s-1vcpu-2gb-lon1-01:~# kubectl get pods,svc -n prometheus
NAME                                                               READY   STATUS    RESTARTS   AGE
pod/grafana-course-deploy-68c8968f9f-np9b9                         1/1     Running   0          11h
pod/prometheus-course-deploy-kube-state-metrics-5b676d5d87-9c2tw   1/1     Running   0          11h
pod/prometheus-course-deploy-node-exporter-2shl2                   1/1     Running   0          11h
pod/prometheus-course-deploy-node-exporter-fm6w8                   1/1     Running   0          11h
pod/prometheus-course-deploy-server-5748f5f975-dp52k               2/2     Running   0          11h

NAME                                                  TYPE        CLUSTER-IP      EXTERNAL-IP   PORT(S)        AGE
service/grafana-course-deploy                         NodePort    100.69.248.75   <none>        80:30377/TCP   11h
service/prometheus-course-deploy-kube-state-metrics   ClusterIP   None            <none>        80/TCP         11h
service/prometheus-course-deploy-node-exporter        ClusterIP   None            <none>        9100/TCP       11h
service/prometheus-course-deploy-server               NodePort    100.68.41.209   <none>        80:30186/TCP   11h
http://prometheus-course-deploy-server:80in our case.
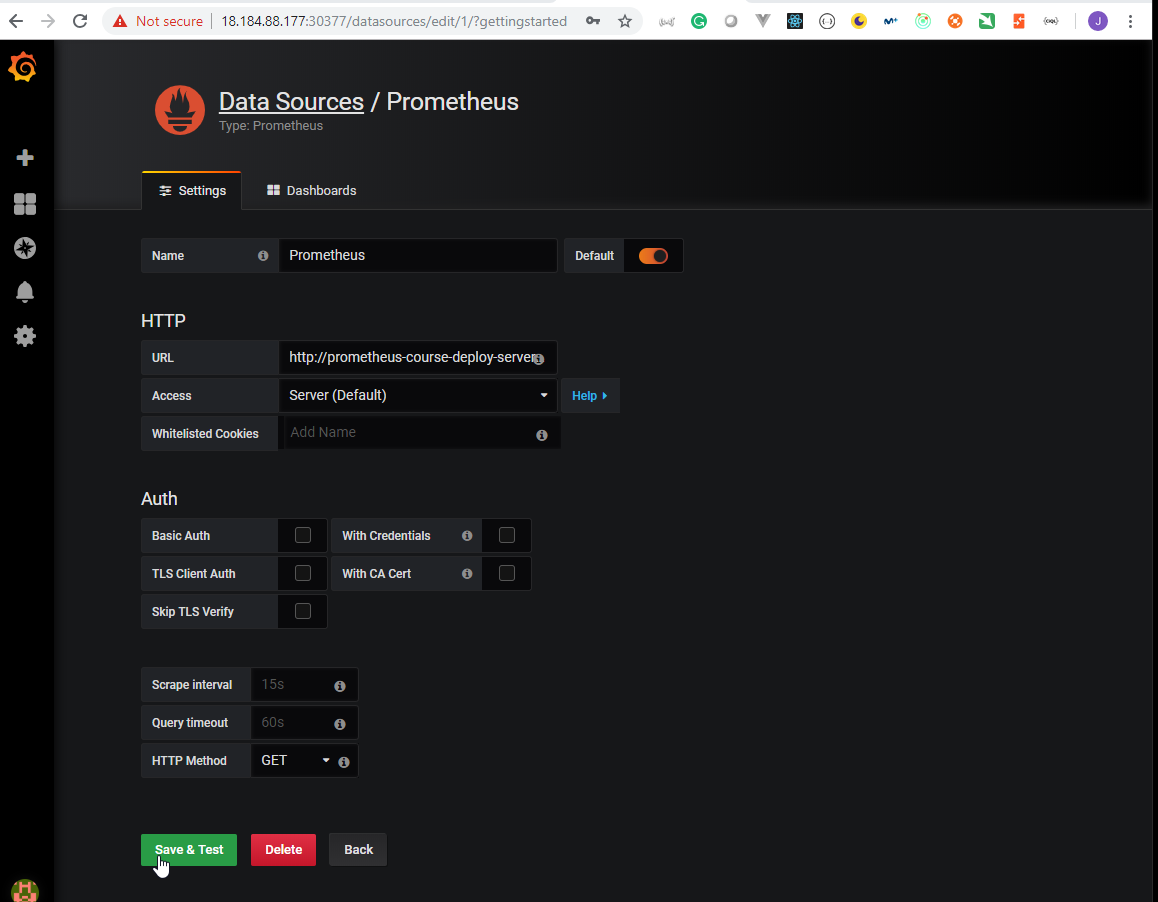
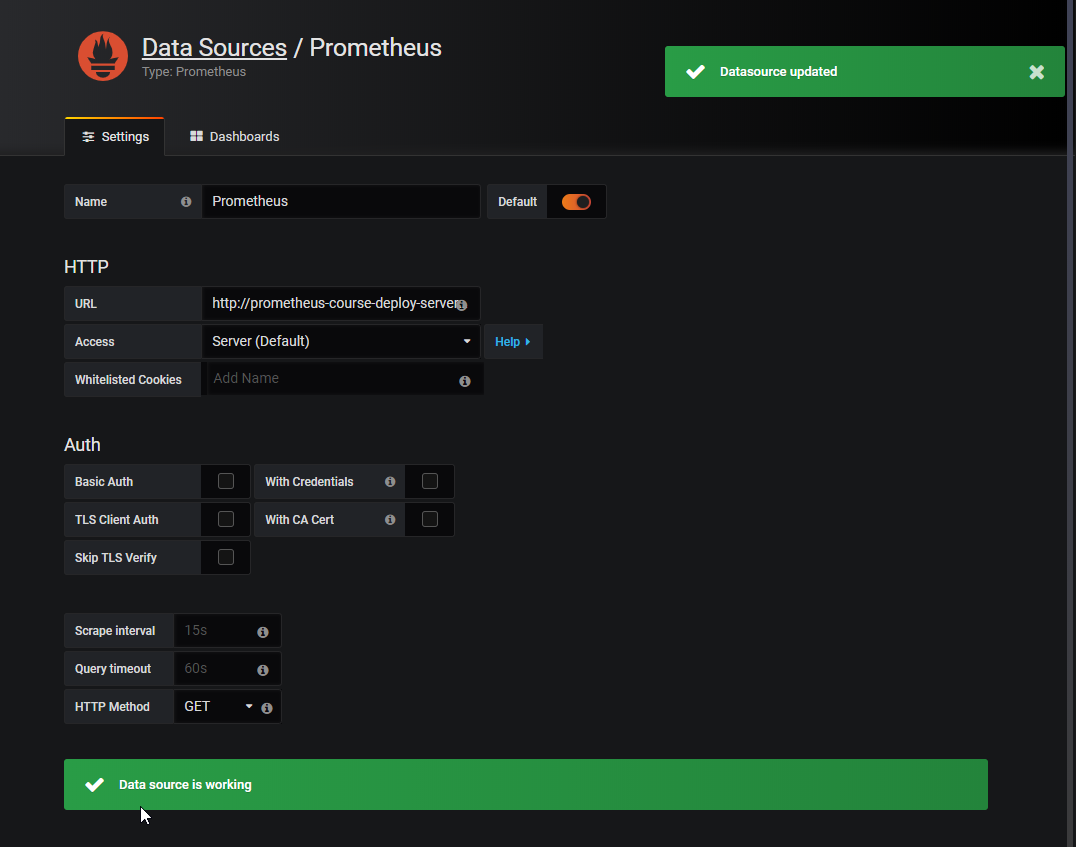
- We are going to chose the https://grafana.com/dashboards/1860 exporter

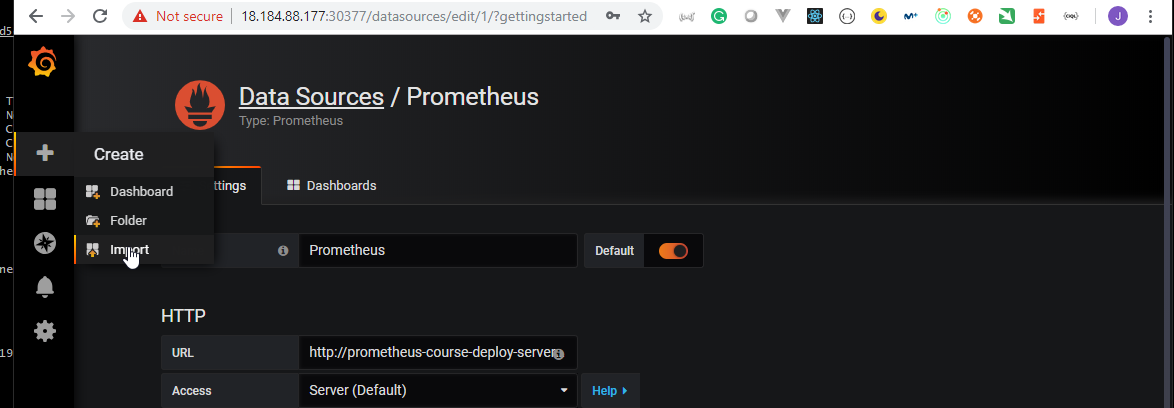
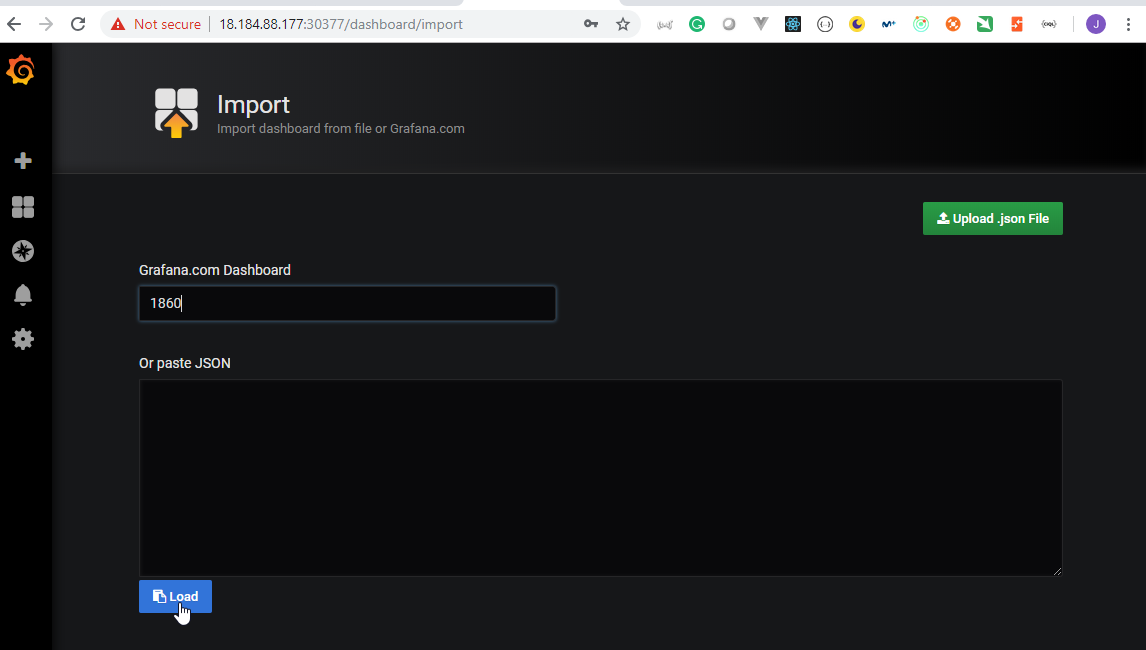
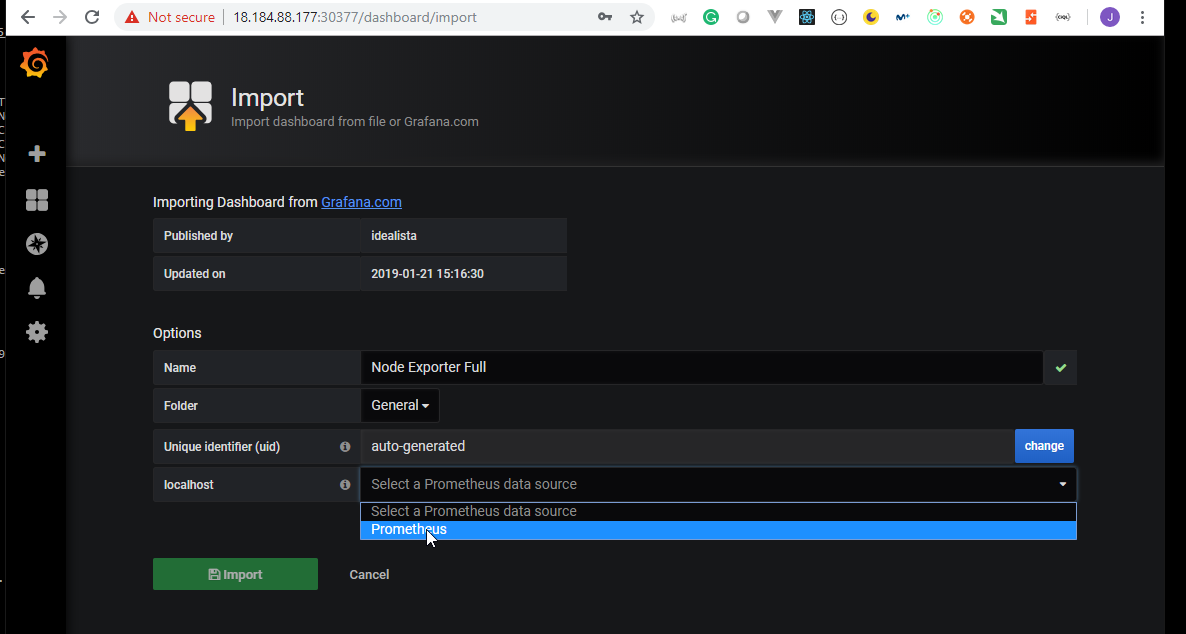
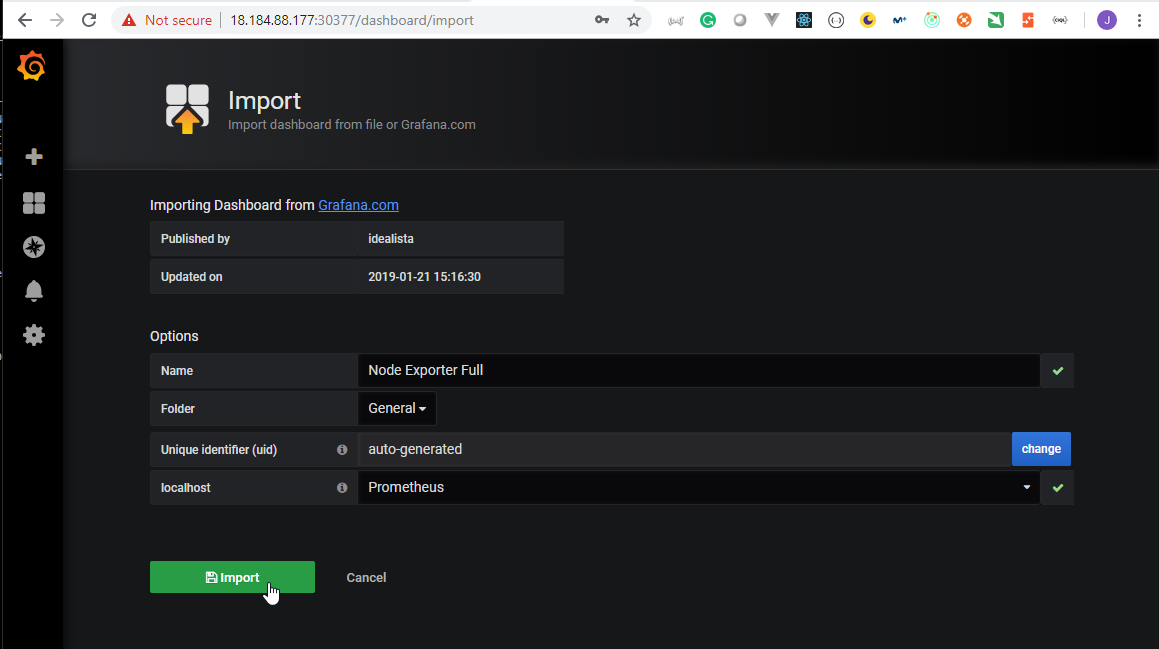
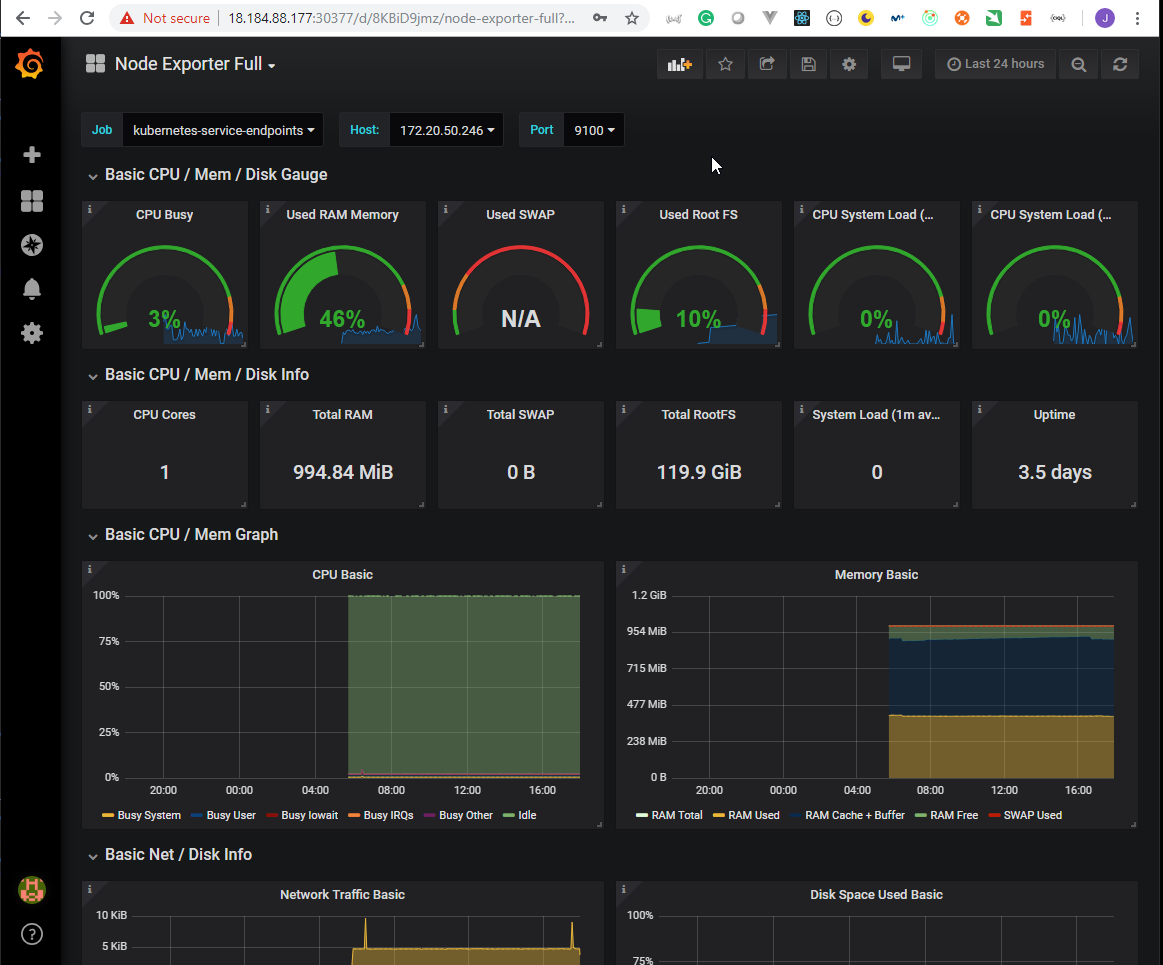

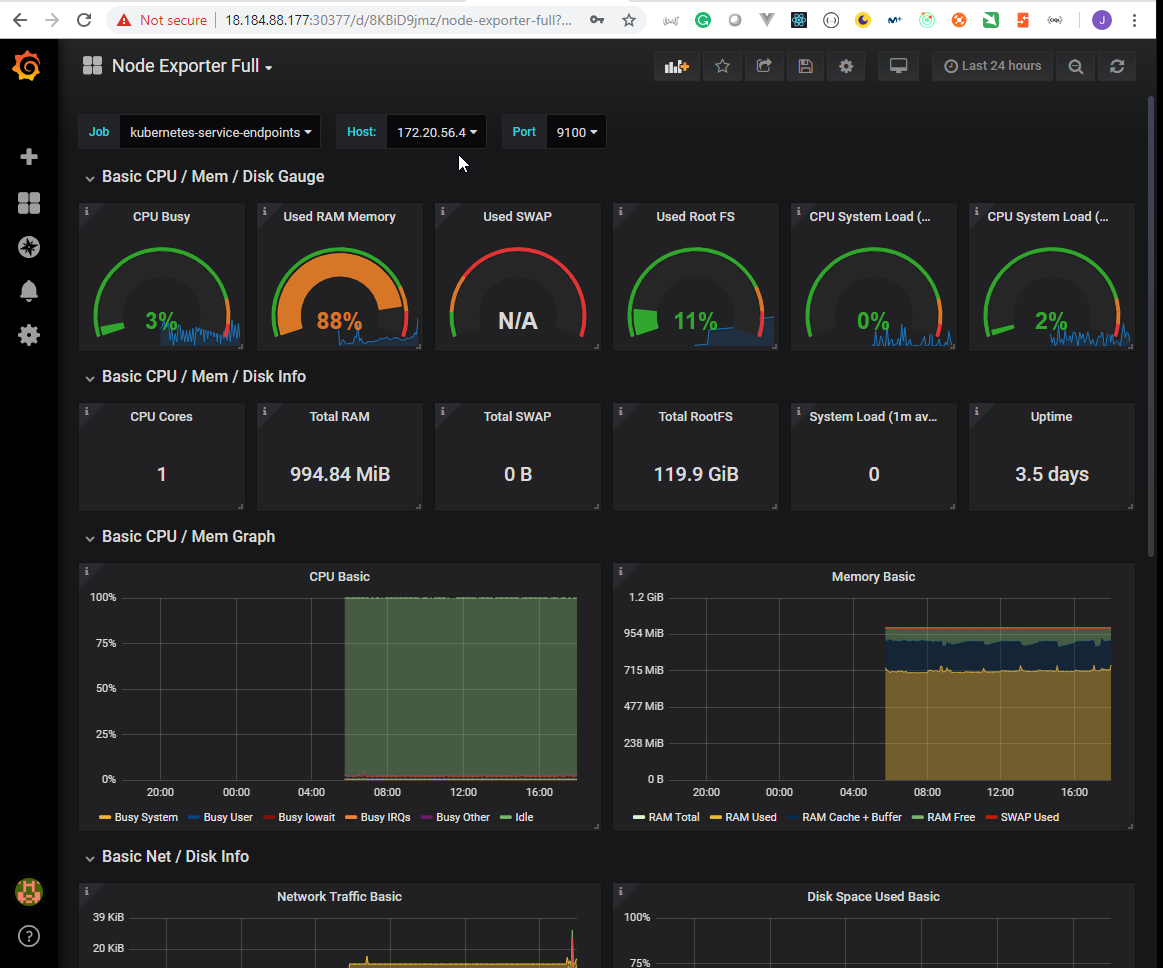
Section: 6. Ingress and LoadBalancer type of service for your Kubernetes cluster
54. LoadBalancer Grafana Service
- In Real World we will never use the NodePort service to expose our services, we will always use the
LoadBalancertype.
root@ubuntu-s-1vcpu-2gb-lon1-01:~# kubectl get pods,svc -n prometheus
NAME                                                               READY   STATUS    RESTARTS   AGE
pod/grafana-course-deploy-68c8968f9f-np9b9                         1/1     Running   0          12h
pod/prometheus-course-deploy-kube-state-metrics-5b676d5d87-9c2tw   1/1     Running   0          12h
pod/prometheus-course-deploy-node-exporter-2shl2                   1/1     Running   0          12h
pod/prometheus-course-deploy-node-exporter-fm6w8                   1/1     Running   0          12h
pod/prometheus-course-deploy-server-5748f5f975-dp52k               2/2     Running   0          12h

NAME                                                  TYPE        CLUSTER-IP      EXTERNAL-IP   PORT(S)        AGE
service/grafana-course-deploy                         NodePort    100.69.248.75   <none>        80:30377/TCP   12h
service/prometheus-course-deploy-kube-state-metrics   ClusterIP   None            <none>        80/TCP         12h
service/prometheus-course-deploy-node-exporter        ClusterIP   None            <none>        9100/TCP       12h
service/prometheus-course-deploy-server               NodePort    100.68.41.209   <none>        80:30186/TCP   12h
root@ubuntu-s-1vcpu-2gb-lon1-01:~#
- We need to modify the
grafana/values.yalmdocument to change fromservice: type: NodePorttoservice: type: LoadBalancerand comment out thenodePort:section
.
.
.
## Expose the grafana service to be accessed from outside the cluster (LoadBalancer service).
## or access it from within the cluster (ClusterIP service). Set the service type and the port to serve it.
## ref: http://kubernetes.io/docs/user-guide/services/
##
service:
  type: LoadBalancer
  #nodePort: 30377
  port: 80
  targetPort:
    3000
    # targetPort: 4181 To be used with a proxy extraContainer
  annotations: {}
  labels: {}
.
.
.
root@ubuntu-s-1vcpu-2gb-lon1-01:~/local_charts/prometheus_grafana# vi grafana/values.yaml
root@ubuntu-s-1vcpu-2gb-lon1-01:~/local_charts/prometheus_grafana#
root@ubuntu-s-1vcpu-2gb-lon1-01:~/local_charts/prometheus_grafana# helmfile -f helmfile_specification_pg.yaml sync
exec: helm repo update --kube-context kops.peelmicro.com
Hang tight while we grab the latest from your chart repositories...
...Skip local chart repository
...Successfully got an update from the "incubator" chart repository
...Successfully got an update from the "stable" chart repository
Update Complete. ? Happy Helming!?
exec: helm upgrade --install --reset-values grafana-course-deploy stable/grafana --namespace prometheus --values /root/local_charts/prometheus_grafana/grafana/values.yaml --kube-context kops.peelmicro.com
exec: helm upgrade --install --reset-values prometheus-course-deploy stable/prometheus --namespace prometheus --values /root/local_charts/prometheus_grafana/prometheus/values.yaml --kube-context kops.peelmicro.com
Release "grafana-course-deploy" has been upgraded. Happy Helming!
LAST DEPLOYED: Tue Mar 12 18:17:34 2019
NAMESPACE: prometheus
STATUS: DEPLOYED

RESOURCES:
==> v1/Secret
NAME                   TYPE    DATA  AGE
grafana-course-deploy  Opaque  3     12h

==> v1/ConfigMap
NAME                   DATA  AGE
grafana-course-deploy  1     12h

==> v1/ClusterRoleBinding
NAME                                      AGE
grafana-course-deploy-clusterrolebinding  12h

==> v1beta1/Role
NAME                   AGE
grafana-course-deploy  12h

==> v1beta1/RoleBinding
NAME                   AGE
grafana-course-deploy  12h

==> v1/ServiceAccount
NAME                   SECRETS  AGE
grafana-course-deploy  1        12h

==> v1/ClusterRole
NAME                               AGE
grafana-course-deploy-clusterrole  12h

==> v1/Service
NAME                   TYPE          CLUSTER-IP     EXTERNAL-IP  PORT(S)       AGE
grafana-course-deploy  LoadBalancer  100.69.248.75  <pending>    80:31704/TCP  12h

==> v1beta2/Deployment
NAME                   DESIRED  CURRENT  UP-TO-DATE  AVAILABLE  AGE
grafana-course-deploy  1        1        1           1          12h

==> v1beta1/PodSecurityPolicy
NAME                   DATA   CAPS      SELINUX   RUNASUSER  FSGROUP   SUPGROUP  READONLYROOTFS  VOLUMES
grafana-course-deploy  false  RunAsAny  RunAsAny  RunAsAny   RunAsAny  false     configMap,emptyDir,projected,secret,downwardAPI,persistentVolumeClaim

==> v1/Pod(related)
NAME                                    READY  STATUS   RESTARTS  AGE
grafana-course-deploy-68c8968f9f-np9b9  1/1    Running  0         12h


NOTES:
1. Get your 'admin' user password by running:

   kubectl get secret --namespace prometheus grafana-course-deploy -o jsonpath="{.data.admin-password}" | base64 --decode ; echo

2. The Grafana server can be accessed via port 80 on the following DNS name from within your cluster:

   grafana-course-deploy.prometheus.svc.cluster.local

   Get the Grafana URL to visit by running these commands in the same shell:
NOTE: It may take a few minutes for the LoadBalancer IP to be available.
        You can watch the status of by running 'kubectl get svc --namespace prometheus -w grafana-course-deploy'
     export SERVICE_IP=$(kubectl get svc --namespace prometheus grafana-course-deploy -o jsonpath='{.status.loadBalancer.ingress[0].ip}')
     http://$SERVICE_IP:80

3. Login with the password from step 1 and the username: admin
#################################################################################
######   WARNING: Persistence is disabled!!! You will lose your data when   #####
######            the Grafana pod is terminated.                            #####
#################################################################################

Release "prometheus-course-deploy" has been upgraded. Happy Helming!
LAST DEPLOYED: Tue Mar 12 18:17:34 2019
NAMESPACE: prometheus
STATUS: DEPLOYED

RESOURCES:
==> v1/PersistentVolumeClaim
NAME                             STATUS  VOLUME                                    CAPACITY  ACCESS MODES  STORAGECLASS  AGE
prometheus-course-deploy-server  Bound   pvc-79c6764f-4489-11e9-b1ba-023d0745758e  1Gi       RWO           gp2           12h

==> v1beta1/ClusterRole
NAME                                         AGE
prometheus-course-deploy-kube-state-metrics  12h
prometheus-course-deploy-server              12h

==> v1beta1/ClusterRoleBinding
NAME                                         AGE
prometheus-course-deploy-kube-state-metrics  12h
prometheus-course-deploy-server              12h

==> v1beta1/DaemonSet
NAME                                    DESIRED  CURRENT  READY  UP-TO-DATE  AVAILABLE  NODE SELECTOR  AGE
prometheus-course-deploy-node-exporter  2        2        2      2           2          <none>         12h

==> v1beta1/Deployment
NAME                                         DESIRED  CURRENT  UP-TO-DATE  AVAILABLE  AGE
prometheus-course-deploy-kube-state-metrics  1        1        1           1          12h
prometheus-course-deploy-server              1        1        1           1          12h

==> v1/ConfigMap
NAME                             DATA  AGE
prometheus-course-deploy-server  3     12h

==> v1/ServiceAccount
NAME                                         SECRETS  AGE
prometheus-course-deploy-kube-state-metrics  1        12h
prometheus-course-deploy-node-exporter       1        12h
prometheus-course-deploy-server              1        12h

==> v1/Service
NAME                                         TYPE       CLUSTER-IP     EXTERNAL-IP  PORT(S)       AGE
prometheus-course-deploy-kube-state-metrics  ClusterIP  None           <none>       80/TCP        12h
prometheus-course-deploy-node-exporter       ClusterIP  None           <none>       9100/TCP      12h
prometheus-course-deploy-server              NodePort   100.68.41.209  <none>       80:30186/TCP  12h

==> v1/Pod(related)
NAME                                                          READY  STATUS   RESTARTS  AGE
prometheus-course-deploy-node-exporter-2shl2                  1/1    Running  0         12h
prometheus-course-deploy-node-exporter-fm6w8                  1/1    Running  0         12h
prometheus-course-deploy-kube-state-metrics-5b676d5d87-9c2tw  1/1    Running  0         12h
prometheus-course-deploy-server-5748f5f975-dp52k              2/2    Running  0         12h


NOTES:
The Prometheus server can be accessed via port 80 on the following DNS name from within your cluster:
prometheus-course-deploy-server.prometheus.svc.cluster.local


Get the Prometheus server URL by running these commands in the same shell:
  export NODE_PORT=$(kubectl get --namespace prometheus -o jsonpath="{.spec.ports[0].nodePort}" services prometheus-course-deploy-server)
  export NODE_IP=$(kubectl get nodes --namespace prometheus -o jsonpath="{.items[0].status.addresses[0].address}")
  echo http://$NODE_IP:$NODE_PORT


For more information on running Prometheus, visit:
https://prometheus.io/

root@ubuntu-s-1vcpu-2gb-lon1-01:~/local_charts/prometheus_grafana#
root@ubuntu-s-1vcpu-2gb-lon1-01:~/local_charts/prometheus_grafana# kubectl get pods,svc -n prometheus
NAME                                                               READY   STATUS    RESTARTS   AGE
pod/grafana-course-deploy-68c8968f9f-np9b9                         1/1     Running   0          12h
pod/prometheus-course-deploy-kube-state-metrics-5b676d5d87-9c2tw   1/1     Running   0          12h
pod/prometheus-course-deploy-node-exporter-2shl2                   1/1     Running   0          12h
pod/prometheus-course-deploy-node-exporter-fm6w8                   1/1     Running   0          12h
pod/prometheus-course-deploy-server-5748f5f975-dp52k               2/2     Running   0          12h

NAME                                                  TYPE           CLUSTER-IP      EXTERNAL-IP                                                                  PORT(S)        AGE
service/grafana-course-deploy                         LoadBalancer   100.69.248.75   a7a290df7448911e9b1ba023d0745758-2120599963.eu-central-1.elb.amazonaws.com   80:31704/TCP   12h
service/prometheus-course-deploy-kube-state-metrics   ClusterIP      None            <none>                                                                       80/TCP         12h
service/prometheus-course-deploy-node-exporter        ClusterIP      None            <none>                                                                       9100/TCP       12h
service/prometheus-course-deploy-server               NodePort       100.68.41.209   <none>                                                                       80:30186/TCP   12h
- Go to https://eu-central-1.console.aws.amazon.com/ec2
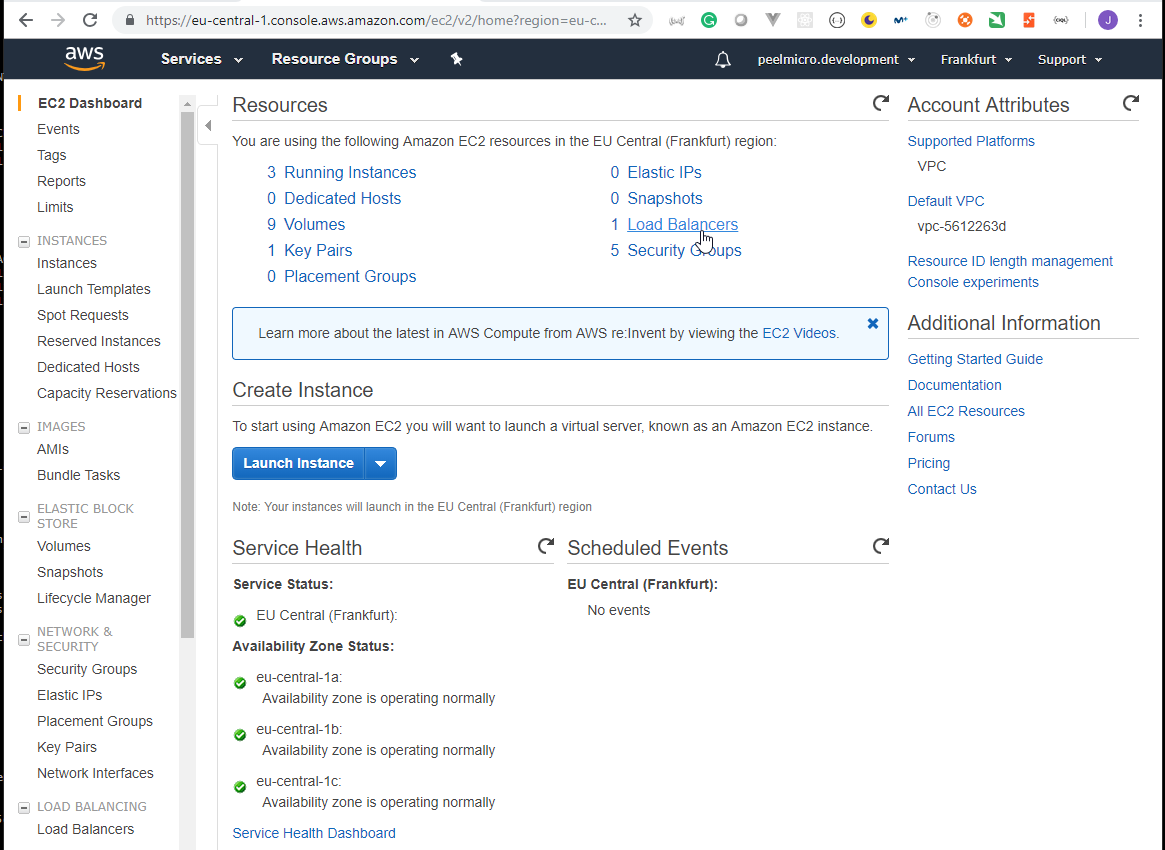
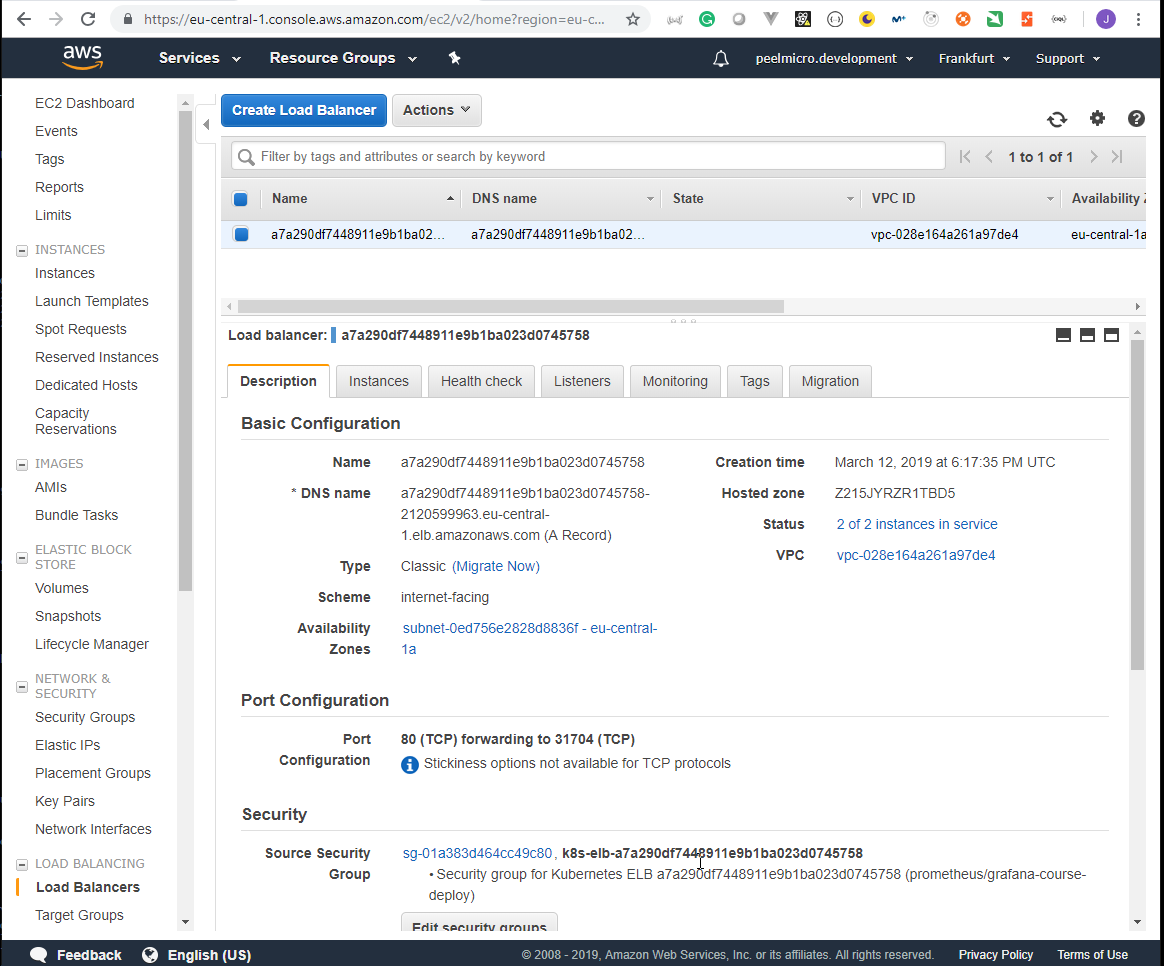
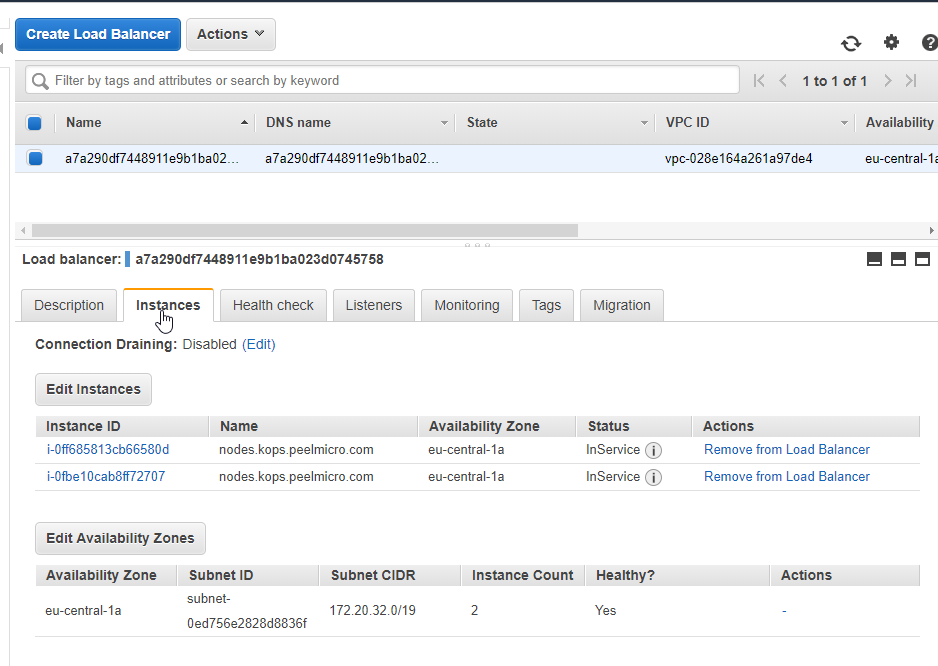

- Go to http://a7a290df7448911e9b1ba023d0745758-2120599963.eu-central-1.elb.amazonaws.com
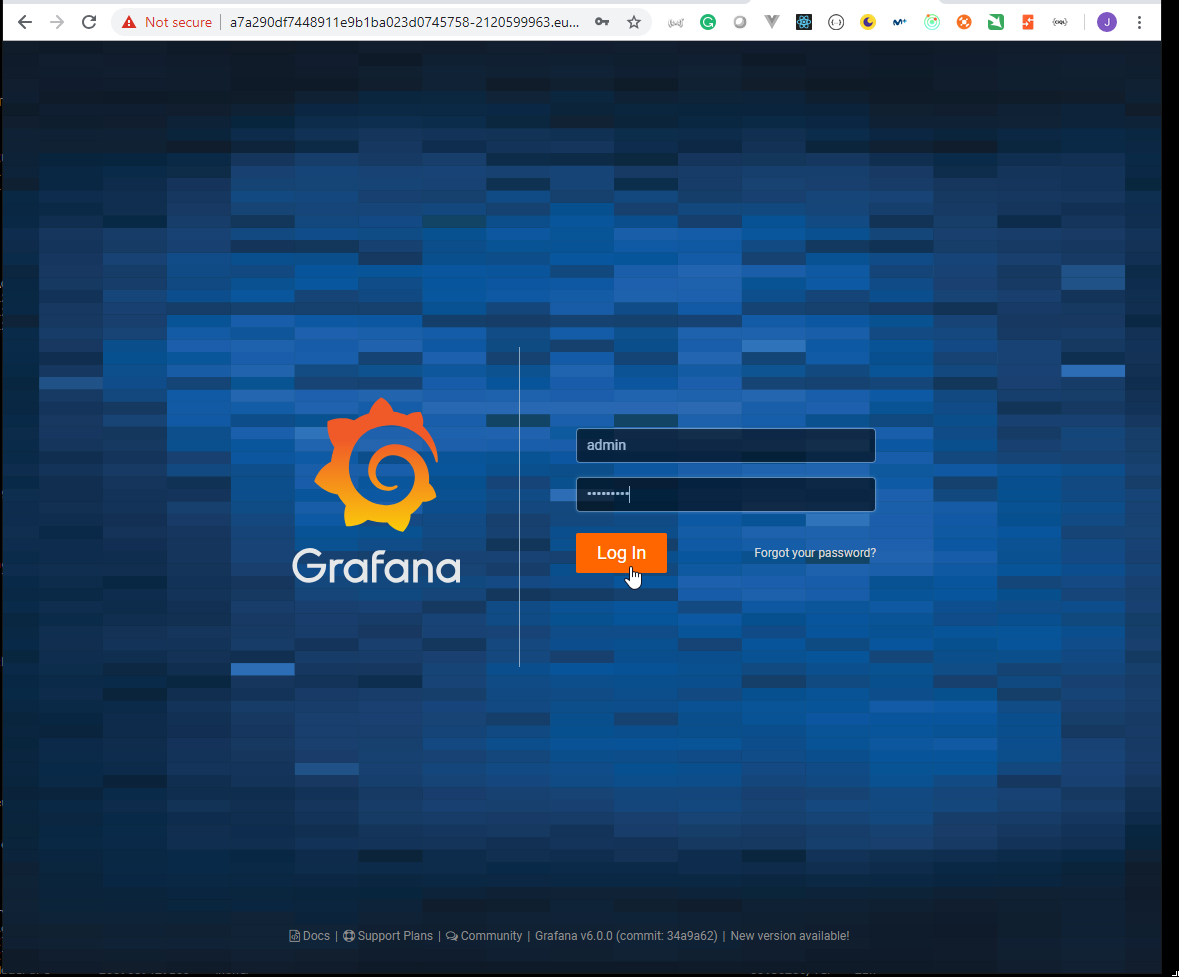
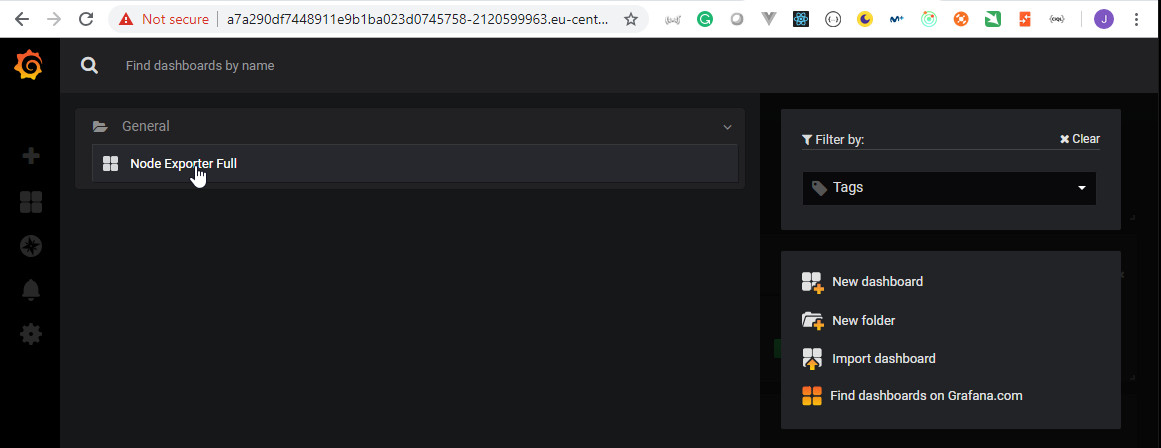
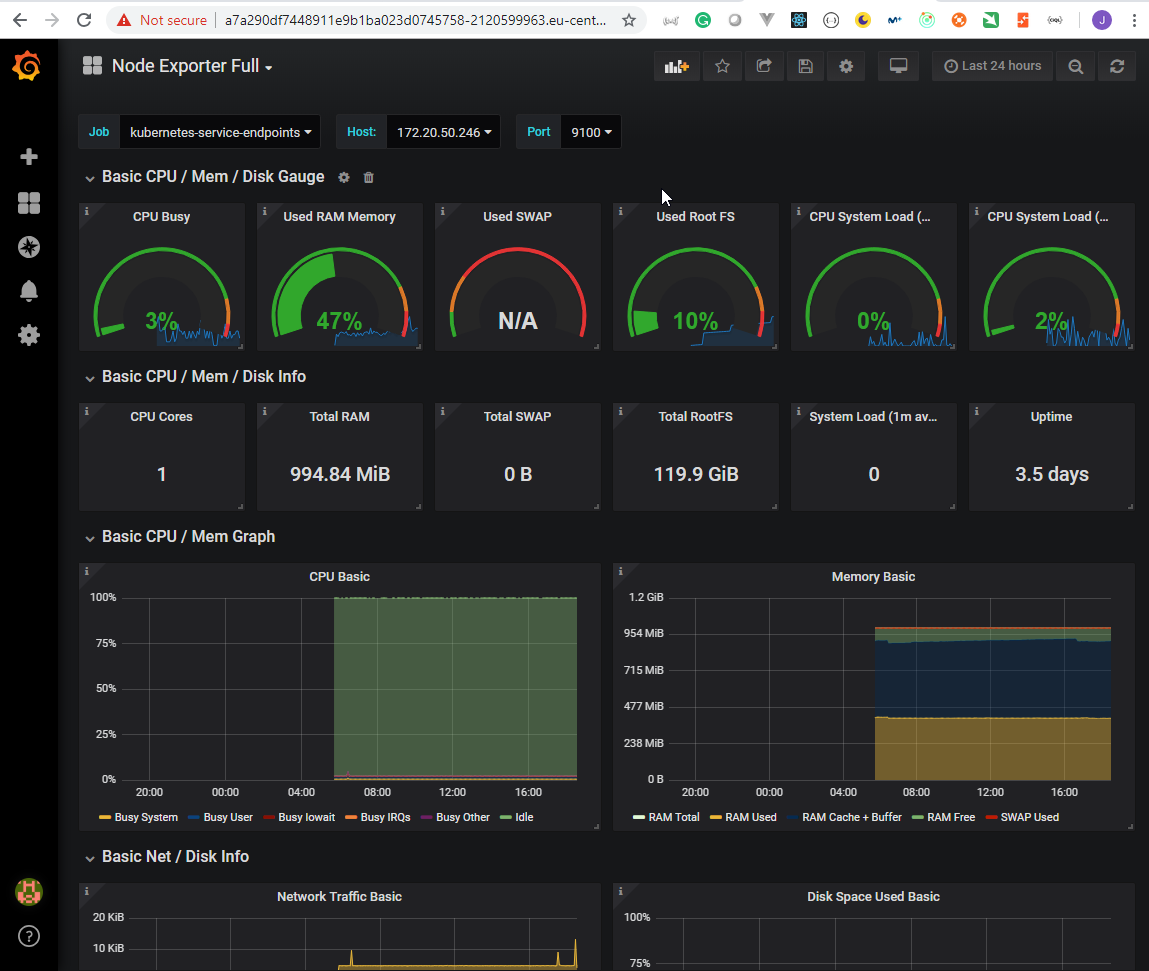
- In order to make the URL more readable we have to go to:
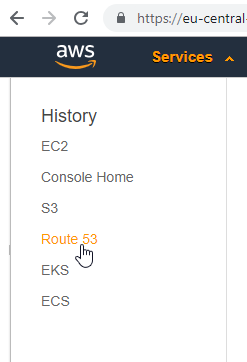
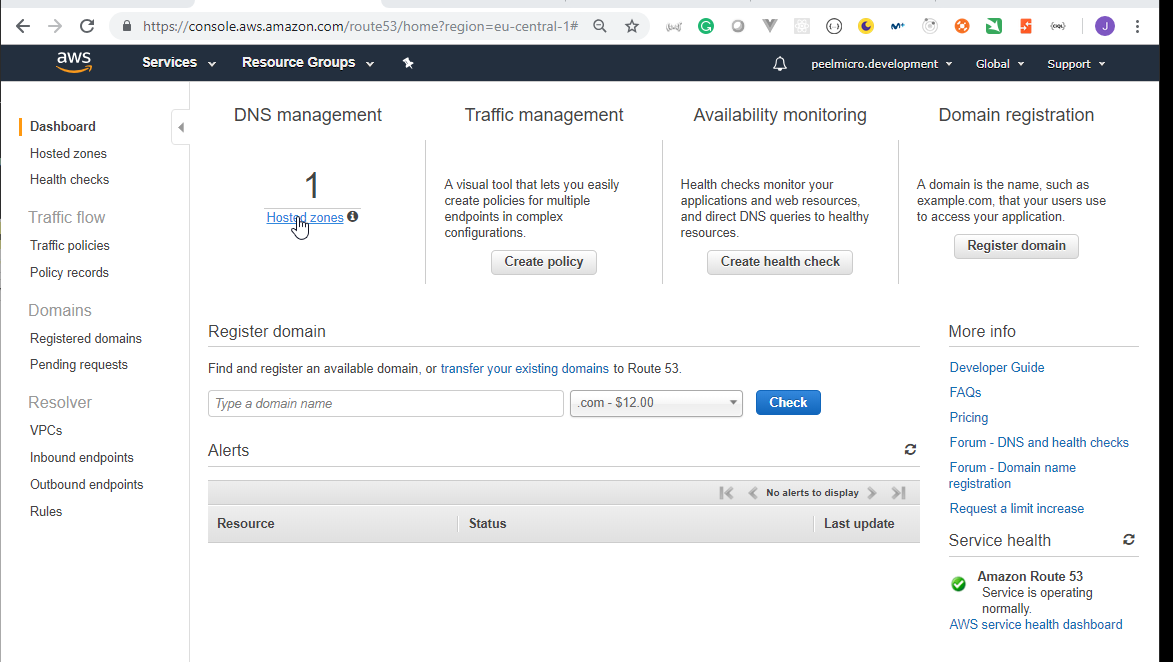
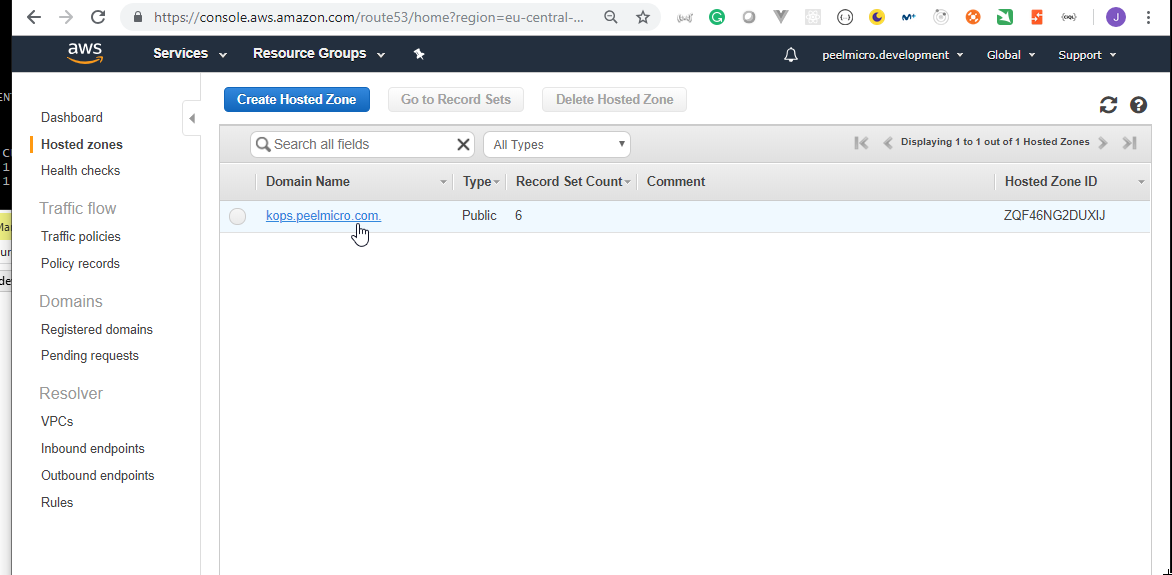
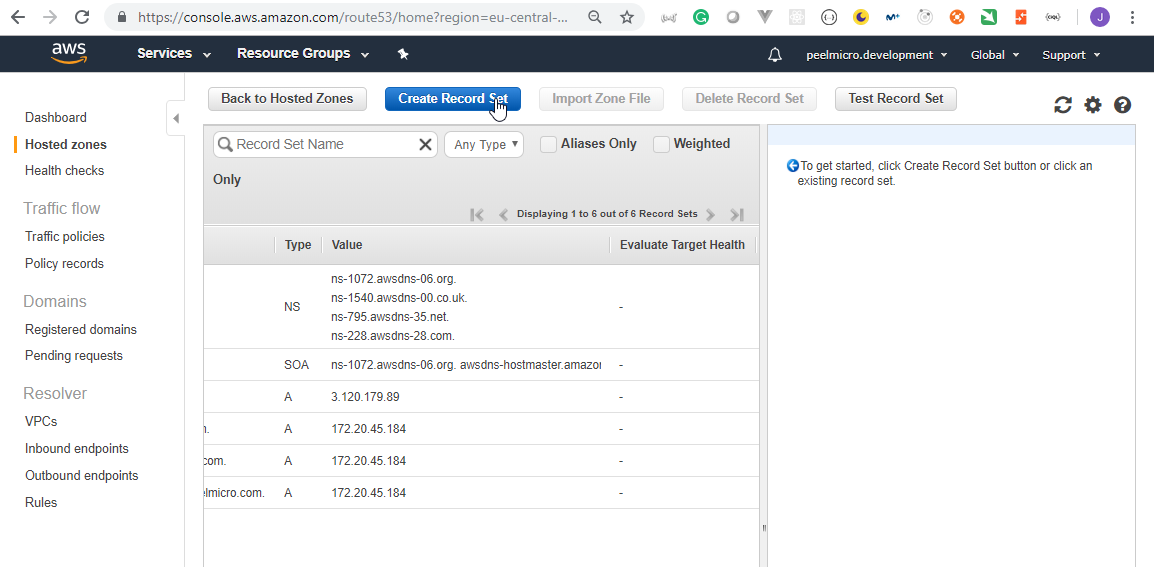
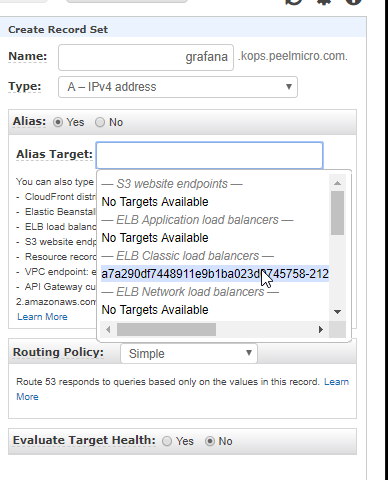
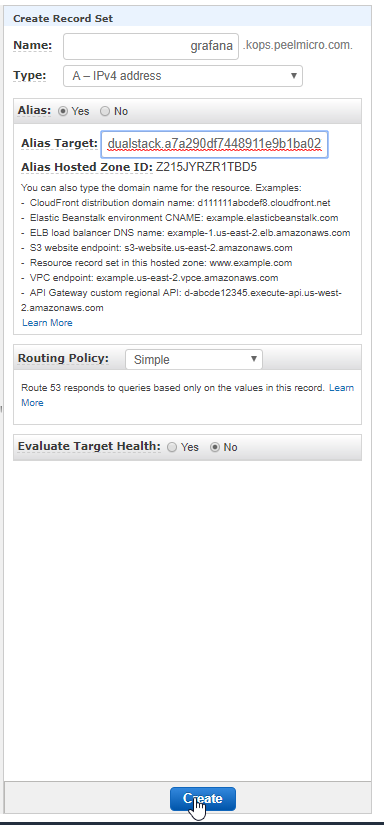
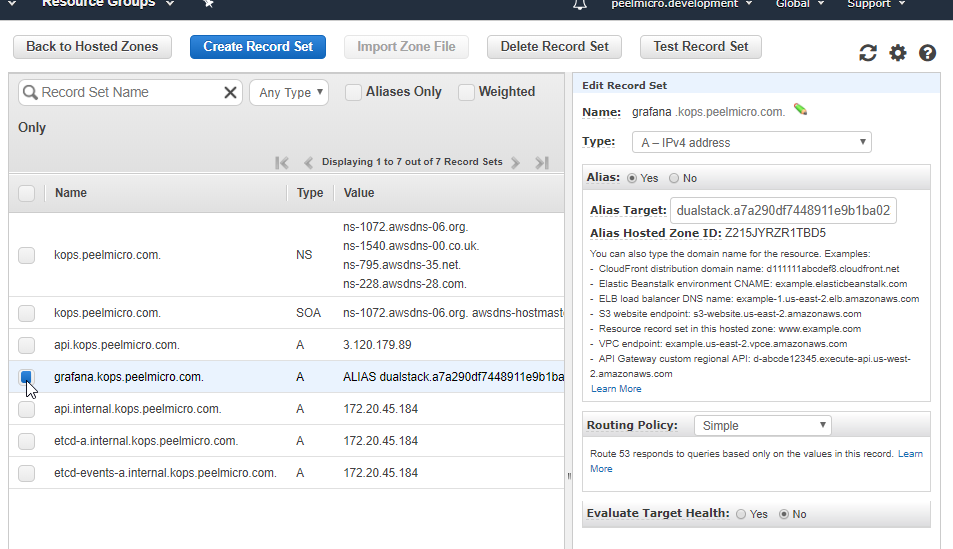
- We can now go to http://grafana.kops.peelmicro.com/login
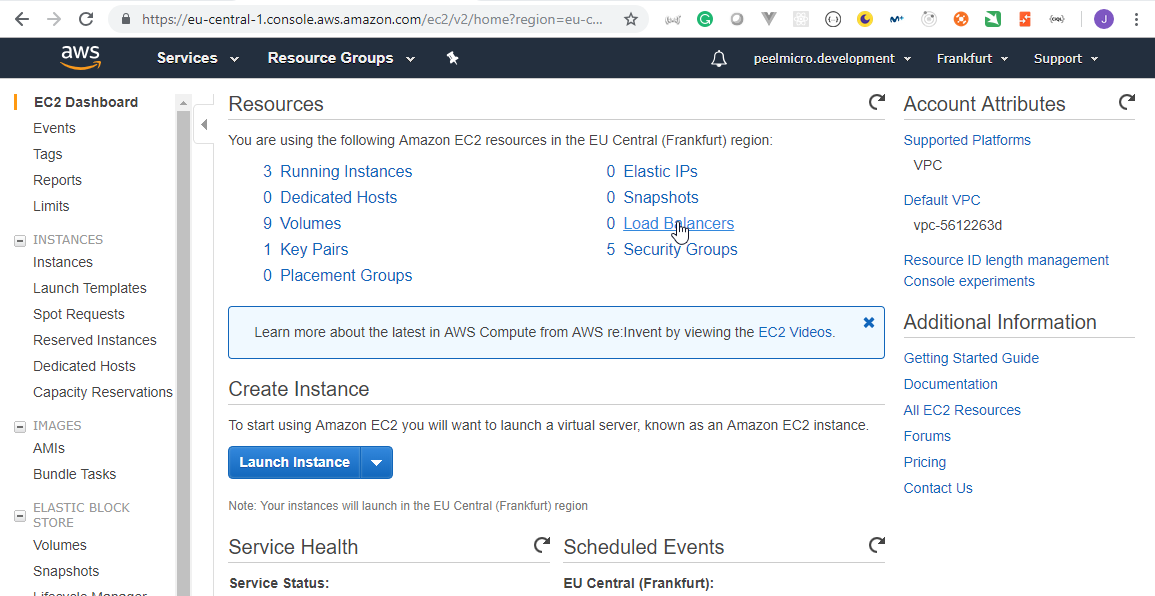
- In order to avoid payment for
LoadBalancerwe need to revert the changes to thegrafana/values.yalmdocument to change fromservice: type: LoadBalancertoservice: type: NodePortand comment in thenodePort:section
.
.
.
## Expose the grafana service to be accessed from outside the cluster (LoadBalancer service).
## or access it from within the cluster (ClusterIP service). Set the service type and the port to serve it.
## ref: http://kubernetes.io/docs/user-guide/services/
##
service:
  type: NodePort
  nodePort: 30377
  port: 80
  targetPort:
    3000
    # targetPort: 4181 To be used with a proxy extraContainer
  annotations: {}
  labels: {}
.
.
.
root@ubuntu-s-1vcpu-2gb-lon1-01:~/local_charts/prometheus_grafana# vi grafana/values.yaml
root@ubuntu-s-1vcpu-2gb-lon1-01:~/local_charts/prometheus_grafana#
root@ubuntu-s-1vcpu-2gb-lon1-01:~/local_charts/prometheus_grafana# helmfile -f helmfile_specification_pg.yaml sync
exec: helm repo update --kube-context kops.peelmicro.com
Hang tight while we grab the latest from your chart repositories...
...Skip local chart repository
...Successfully got an update from the "incubator" chart repository
...Successfully got an update from the "stable" chart repository
Update Complete. ? Happy Helming!?
exec: helm upgrade --install --reset-values grafana-course-deploy stable/grafana --namespace prometheus --values /root/local_charts/prometheus_grafana/grafana/values.yaml --kube-context kops.peelmicro.com
exec: helm upgrade --install --reset-values prometheus-course-deploy stable/prometheus --namespace prometheus --values /root/local_charts/prometheus_grafana/prometheus/values.yaml --kube-context kops.peelmicro.com
Release "grafana-course-deploy" has been upgraded. Happy Helming!
LAST DEPLOYED: Tue Mar 12 18:44:45 2019
NAMESPACE: prometheus
STATUS: DEPLOYED

RESOURCES:
==> v1beta2/Deployment
NAME                   DESIRED  CURRENT  UP-TO-DATE  AVAILABLE  AGE
grafana-course-deploy  1        1        1           1          13h

==> v1beta1/PodSecurityPolicy
NAME                   DATA   CAPS      SELINUX   RUNASUSER  FSGROUP   SUPGROUP  READONLYROOTFS  VOLUMES
grafana-course-deploy  false  RunAsAny  RunAsAny  RunAsAny   RunAsAny  false     configMap,emptyDir,projected,secret,downwardAPI,persistentVolumeClaim

==> v1/Secret
NAME                   TYPE    DATA  AGE
grafana-course-deploy  Opaque  3     13h

==> v1/ConfigMap
NAME                   DATA  AGE
grafana-course-deploy  1     13h

==> v1/ClusterRoleBinding
NAME                                      AGE
grafana-course-deploy-clusterrolebinding  13h

==> v1beta1/Role
NAME                   AGE
grafana-course-deploy  13h

==> v1beta1/RoleBinding
NAME                   AGE
grafana-course-deploy  13h

==> v1/ServiceAccount
NAME                   SECRETS  AGE
grafana-course-deploy  1        13h

==> v1/ClusterRole
NAME                               AGE
grafana-course-deploy-clusterrole  13h

==> v1/Service
NAME                   TYPE      CLUSTER-IP     EXTERNAL-IP  PORT(S)       AGE
grafana-course-deploy  NodePort  100.69.248.75  <none>       80:30377/TCP  13h

==> v1/Pod(related)
NAME                                    READY  STATUS   RESTARTS  AGE
grafana-course-deploy-68c8968f9f-np9b9  1/1    Running  0         13h


NOTES:
1. Get your 'admin' user password by running:

   kubectl get secret --namespace prometheus grafana-course-deploy -o jsonpath="{.data.admin-password}" | base64 --decode ; echo

2. The Grafana server can be accessed via port 80 on the following DNS name from within your cluster:

   grafana-course-deploy.prometheus.svc.cluster.local

   Get the Grafana URL to visit by running these commands in the same shell:
export NODE_PORT=$(kubectl get --namespace prometheus -o jsonpath="{.spec.ports[0].nodePort}" services grafana-course-deploy)
     export NODE_IP=$(kubectl get nodes --namespace prometheus -o jsonpath="{.items[0].status.addresses[0].address}")
     echo http://$NODE_IP:$NODE_PORT


3. Login with the password from step 1 and the username: admin
#################################################################################
######   WARNING: Persistence is disabled!!! You will lose your data when   #####
######            the Grafana pod is terminated.                            #####
#################################################################################

Release "prometheus-course-deploy" has been upgraded. Happy Helming!
LAST DEPLOYED: Tue Mar 12 18:44:45 2019
NAMESPACE: prometheus
STATUS: DEPLOYED

RESOURCES:
==> v1/Pod(related)
NAME                                                          READY  STATUS   RESTARTS  AGE
prometheus-course-deploy-node-exporter-2shl2                  1/1    Running  0         13h
prometheus-course-deploy-node-exporter-fm6w8                  1/1    Running  0         13h
prometheus-course-deploy-kube-state-metrics-5b676d5d87-9c2tw  1/1    Running  0         13h
prometheus-course-deploy-server-5748f5f975-dp52k              2/2    Running  0         13h

==> v1/PersistentVolumeClaim
NAME                             STATUS  VOLUME                                    CAPACITY  ACCESS MODES  STORAGECLASS  AGE
prometheus-course-deploy-server  Bound   pvc-79c6764f-4489-11e9-b1ba-023d0745758e  1Gi       RWO           gp2           13h

==> v1beta1/ClusterRole
NAME                                         AGE
prometheus-course-deploy-kube-state-metrics  13h
prometheus-course-deploy-server              13h

==> v1beta1/ClusterRoleBinding
NAME                                         AGE
prometheus-course-deploy-kube-state-metrics  13h
prometheus-course-deploy-server              13h

==> v1beta1/DaemonSet
NAME                                    DESIRED  CURRENT  READY  UP-TO-DATE  AVAILABLE  NODE SELECTOR  AGE
prometheus-course-deploy-node-exporter  2        2        2      2           2          <none>         13h

==> v1/ConfigMap
NAME                             DATA  AGE
prometheus-course-deploy-server  3     13h

==> v1/ServiceAccount
NAME                                         SECRETS  AGE
prometheus-course-deploy-kube-state-metrics  1        13h
prometheus-course-deploy-node-exporter       1        13h
prometheus-course-deploy-server              1        13h

==> v1/Service
NAME                                         TYPE       CLUSTER-IP     EXTERNAL-IP  PORT(S)       AGE
prometheus-course-deploy-kube-state-metrics  ClusterIP  None           <none>       80/TCP        13h
prometheus-course-deploy-node-exporter       ClusterIP  None           <none>       9100/TCP      13h
prometheus-course-deploy-server              NodePort   100.68.41.209  <none>       80:30186/TCP  13h

==> v1beta1/Deployment
NAME                                         DESIRED  CURRENT  UP-TO-DATE  AVAILABLE  AGE
prometheus-course-deploy-kube-state-metrics  1        1        1           1          13h
prometheus-course-deploy-server              1        1        1           1          13h


NOTES:
The Prometheus server can be accessed via port 80 on the following DNS name from within your cluster:
prometheus-course-deploy-server.prometheus.svc.cluster.local


Get the Prometheus server URL by running these commands in the same shell:
  export NODE_PORT=$(kubectl get --namespace prometheus -o jsonpath="{.spec.ports[0].nodePort}" services prometheus-course-deploy-server)
  export NODE_IP=$(kubectl get nodes --namespace prometheus -o jsonpath="{.items[0].status.addresses[0].address}")
  echo http://$NODE_IP:$NODE_PORT


For more information on running Prometheus, visit:
https://prometheus.io/

root@ubuntu-s-1vcpu-2gb-lon1-01:~/local_charts/prometheus_grafana#
root@ubuntu-s-1vcpu-2gb-lon1-01:~/local_charts/prometheus_grafana# kubectl get pods,svc -n prometheus
NAME                                                               READY   STATUS    RESTARTS   AGE
pod/grafana-course-deploy-68c8968f9f-np9b9                         1/1     Running   0          13h
pod/prometheus-course-deploy-kube-state-metrics-5b676d5d87-9c2tw   1/1     Running   0          13h
pod/prometheus-course-deploy-node-exporter-2shl2                   1/1     Running   0          13h
pod/prometheus-course-deploy-node-exporter-fm6w8                   1/1     Running   0          13h
pod/prometheus-course-deploy-server-5748f5f975-dp52k               2/2     Running   0          13h

NAME                                                  TYPE        CLUSTER-IP      EXTERNAL-IP   PORT(S)        AGE
service/grafana-course-deploy                         NodePort    100.69.248.75   <none>        80:30377/TCP   13h
service/prometheus-course-deploy-kube-state-metrics   ClusterIP   None            <none>        80/TCP         13h
service/prometheus-course-deploy-node-exporter        ClusterIP   None            <none>        9100/TCP       13h
service/prometheus-course-deploy-server               NodePort    100.68.41.209   <none>        80:30186/TCP   13h
- We can check that the
LoadBalancerdoesn't exist anymore.

- We can access again through http://18.184.104.252:30377
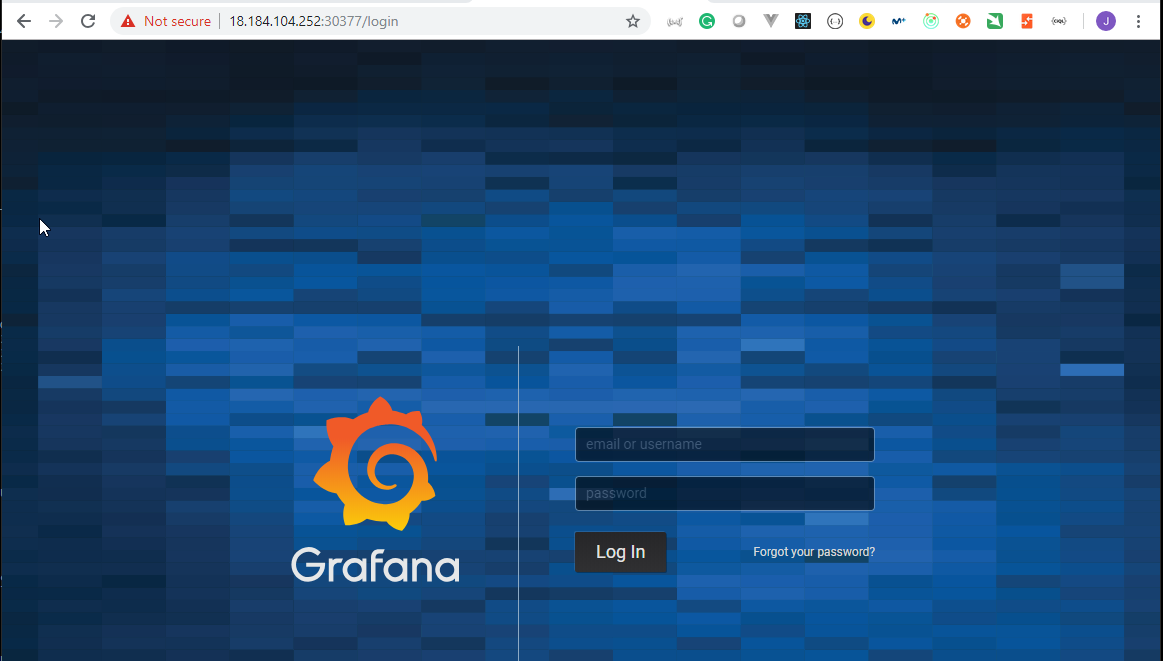
- Delete the record in the DNS
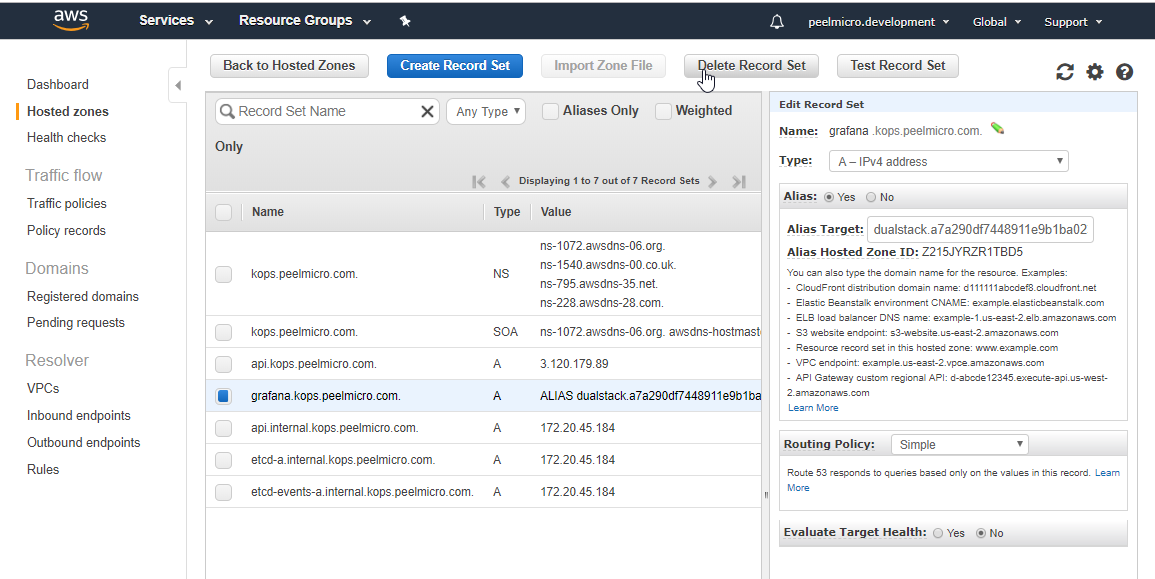
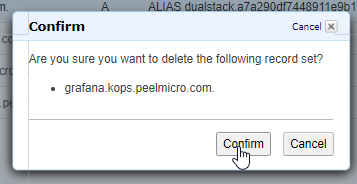
55. Materials: Helmfile specification to add DokuWiki deployment
Helmfile specification to add DokuWiki deployment to Prometheus and Grafana
Process deployment:
navigate to a location with all these folders (grafana/, prometheus/, dokuwiki/ ) created with corresponding
values.yamlfiles.Create this file:
helmfile_specification_pg.yaml
# kubectl config view
context: course.<your_domain>.com   # kube-context (--kube-context)

releases:
  # Published chart example
  - name: grafana-course-deploy             # name of this release
    namespace: prometheus                   # target namespace
    chart: stable/grafana                   # repository/chart` syntax
    values:
      - grafana/values.yaml                 # value files (--values)

  # Published chart example
  - name: prometheus-course-deploy          # name of this release
    namespace: prometheus                   # target namespace
    chart: stable/prometheus                # repository/chart` syntax
    values:
      - prometheus/values.yaml              # value files (--values)

  # DokuWiki Helmfile specification
  - name: dokuwiki-course-deploy            # name of this release
    namespace: doku                         # target namespace
    chart: stable/dokuwiki                  # repository/chart` syntax
    values:
      - dokuwiki/values.yaml                # value files (--values)
Process desired changes in
dokuwiki/values.yamlfiles.Run:
helmfile -f helmfile_specification_pg.yaml syncRun
kubectl get pods,svc -n dokuto see DokuWiki Kubernetes objects/
Note: I assume that if you are going through this course during several days - You always destroy all resources in AWS It means that you stop you Kubernetes cluster every time you are not working on it. The easiest way is to do it via terraform cd /.../.../.../terraform_code ; terraform destroy # hit yes
destroy/delete manually if terraform can't do that:
- VOLUMES
- LoadBalancer/s (if exists)
- RecordSet/s (custom RecordSet/s)
- EC2 instances
- network resources
- ...
except: - S3 bucket (delete once you do not want to use this free 1 YEAR account anymore, or you are done with this course.) - Hosted Zone (delete once you do not want to use this free 1 YEAR account anymore, or you are done with this course.)
Please do not forget redeploy tiller pod by using of this commands every time you are starting your Kubernetes cluster.
# Start your Kubernetes cluster
cd /.../.../.../terraform_code
terraform apply

# Crete service account && initiate tiller pod in your Kubernetes cluster
kubectl create serviceaccount --namespace kube-system tiller
kubectl create clusterrolebinding tiller-cluster-rule --clusterrole=cluster-admin --serviceaccount=kube-system:tiller
# kubectl patch deploy --namespace kube-system tiller-deploy -p '{"spec":{"template":{"spec":{"serviceAccount":"tiller"}}}}'
helm init --service-account tiller --upgrade
56. Single LoadBalancer service type for all instances in your K8s (DokuWiki)
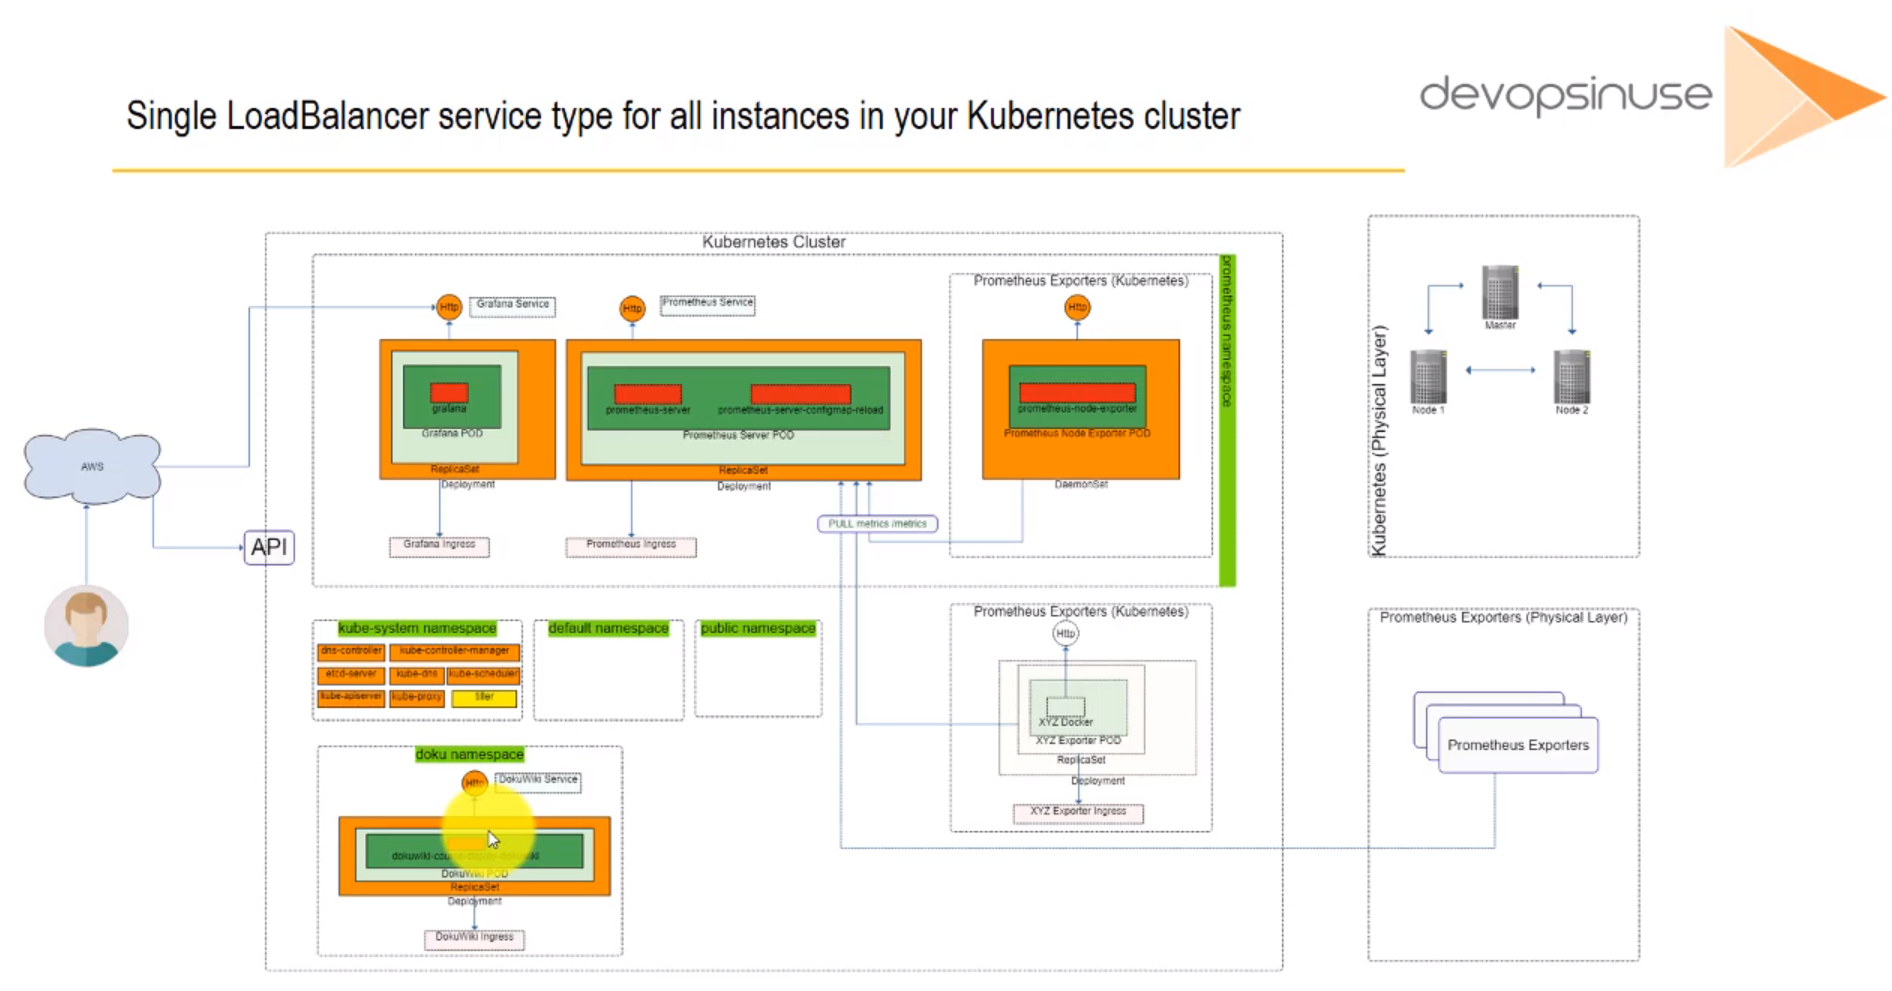
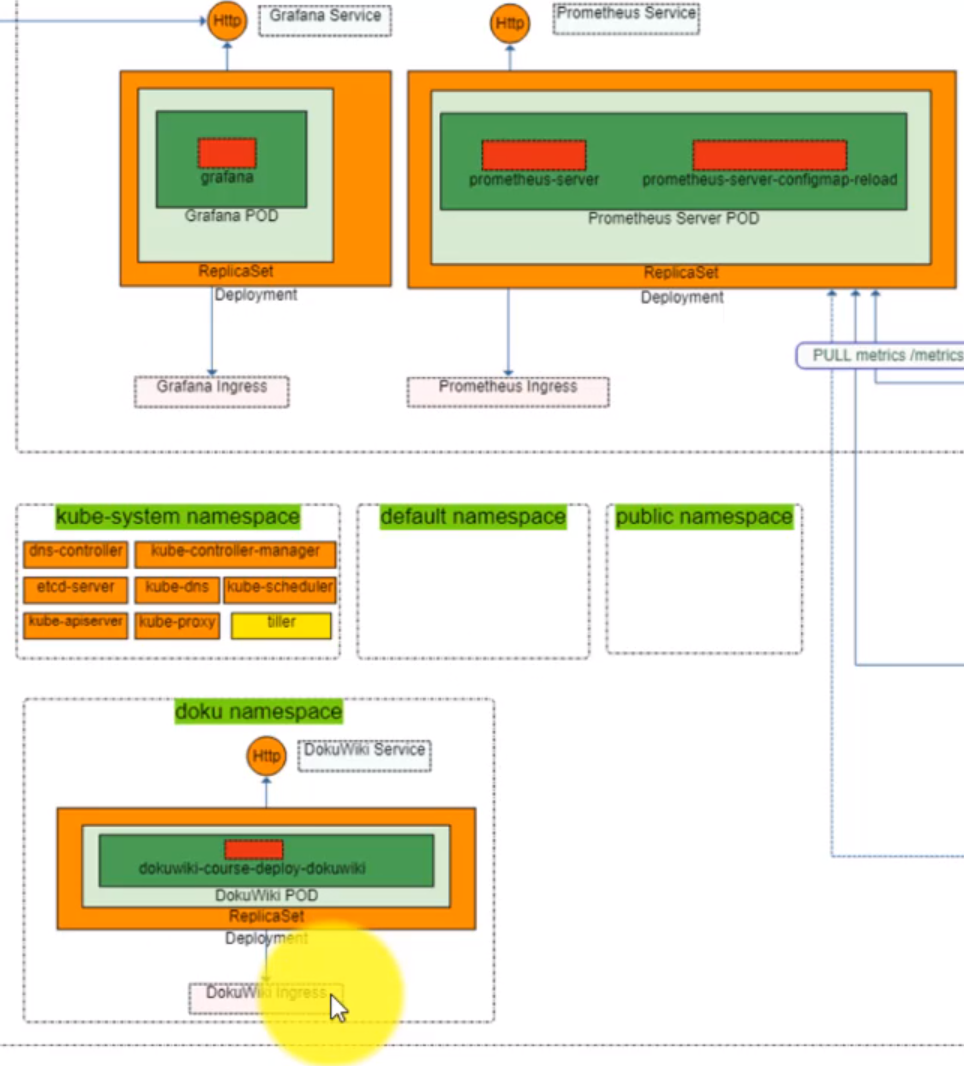
- Copy the
dokuwikichart folder from theHelm Chartslocal repository. We can get more information about it on Githut Dokukiwi chart.
root@ubuntu-s-1vcpu-2gb-lon1-01:~/local_charts/prometheus_grafana# rsync -avhx ../../charts/stable/dokuwiki .
sending incremental file list
dokuwiki/
dokuwiki/.helmignore
dokuwiki/Chart.yaml
dokuwiki/OWNERS
dokuwiki/README.md
dokuwiki/values.yaml
dokuwiki/templates/
dokuwiki/templates/NOTES.txt
dokuwiki/templates/_helpers.tpl
dokuwiki/templates/apache-pvc.yaml
dokuwiki/templates/deployment.yaml
dokuwiki/templates/dokuwiki-pvc.yaml
dokuwiki/templates/ingress.yaml
dokuwiki/templates/secrets.yaml
dokuwiki/templates/svc.yaml
dokuwiki/templates/tls-secrets.yaml

sent 35.42K bytes  received 298 bytes  71.44K bytes/sec
total size is 34.37K  speedup is 0.96
root@ubuntu-s-1vcpu-2gb-lon1-01:~/local_charts/prometheus_grafana# ll
total 24
drwxr-xr-x 5 root root 4096 Mar 13 05:13 ./
drwxr-xr-x 4 root root 4096 Mar 11 19:54 ../
drwxr-xr-x 3 root root 4096 Mar 10 06:17 dokuwiki/
drwxr-xr-x 4 root root 4096 Mar 12 18:44 grafana/
-rw-r--r-- 1 root root  718 Mar 11 18:58 helmfile_specification_pg.yaml
drwxr-xr-x 3 root root 4096 Mar 12 17:23 prometheus/
- Change the
dokuwiki/values.yamldocument:
- Change
dokuwikiUsername: usertodokuwikiUsername: admin - Uncoment and change
# dokuwikiPassword:todokuwikiPassword: Start123# - Change
service: type: LoadBalancertoservice: type: NodePort
root@ubuntu-s-1vcpu-2gb-lon1-01:~/local_charts/prometheus_grafana# vi dokuwiki/values.yaml
root@ubuntu-s-1vcpu-2gb-lon1-01:~/local_charts/prometheus_grafana#
- Modify the
helmfile_specification_pg.yamldocument
helmfile_specification_pg.yaml
context: kops.peelmicro.com # kube-context (--kube-context)

releases:
  # Published chart example
  - name: grafana-course-deploy # name of this release
    namespace: prometheus # target namespace
    chart: stable/grafana # repository/chart` syntax
    values:
      - grafana/values.yaml # value files (--values)

  # Published chart example
  - name: prometheus-course-deploy # name of this release
    namespace: prometheus # target namespace
    chart: stable/prometheus # repository/chart` syntax
    values:
      - prometheus/values.yaml # value files (--values)

  # DokuWiki Helmfile specification
  - name: dokuwiki-course-deploy # name of this release
    namespace: doku # target namespace
    chart: stable/dokuwiki # repository/chart` syntax
    values:
      - dokuwiki/values.yaml # value files (--values)```
root@ubuntu-s-1vcpu-2gb-lon1-01:~/local_charts/prometheus_grafana# vi helmfile_specification_pg.yaml
root@ubuntu-s-1vcpu-2gb-lon1-01:~/local_charts/prometheus_grafana#
- Deploy the changes.
root@ubuntu-s-1vcpu-2gb-lon1-01:~/local_charts/prometheus_grafana# helmfile -f helmfile_specification_pg.yaml sync
exec: helm repo update --kube-context kops.peelmicro.com
Hang tight while we grab the latest from your chart repositories...
...Skip local chart repository
...Successfully got an update from the "incubator" chart repository
...Successfully got an update from the "stable" chart repository
Update Complete. ? Happy Helming!?
exec: helm upgrade --install --reset-values prometheus-course-deploy stable/prometheus --namespace prometheus --values /root/local_charts/prometheus_grafana/prometheus/values.yaml --kube-context kops.peelmicro.com
exec: helm upgrade --install --reset-values dokuwiki-course-deploy stable/dokuwiki --namespace doku --values /root/local_charts/prometheus_grafana/dokuwiki/values.yaml --kube-context kops.peelmicro.com
exec: helm upgrade --install --reset-values grafana-course-deploy stable/grafana --namespace prometheus --values /root/local_charts/prometheus_grafana/grafana/values.yaml --kube-context kops.peelmicro.com
Release "dokuwiki-course-deploy" does not exist. Installing it now.
NAME: dokuwiki-course-deploy
LAST DEPLOYED: Wed Mar 13 05:29:55 2019
NAMESPACE: doku
STATUS: DEPLOYED
RESOURCES:
==> v1/Secret
NAME TYPE DATA AGE
dokuwiki-course-deploy-dokuwiki Opaque 1 1s
==> v1/PersistentVolumeClaim
NAME STATUS VOLUME CAPACITY ACCESS MODES STORAGECLASS AGE
dokuwiki-course-deploy-dokuwiki-apache Pending gp2 1s
dokuwiki-course-deploy-dokuwiki-dokuwiki Pending gp2 0s
==> v1/Service
NAME TYPE CLUSTER-IP EXTERNAL-IP PORT(S) AGE
dokuwiki-course-deploy-dokuwiki NodePort 100.64.180.130 <none> 80:30830/TCP,443:31788/TCP 0s
==> v1beta1/Deployment
NAME DESIRED CURRENT UP-TO-DATE AVAILABLE AGE
dokuwiki-course-deploy-dokuwiki 1 1 1 0 0s
==> v1/Pod(related)
NAME READY STATUS RESTARTS AGE
dokuwiki-course-deploy-dokuwiki-b49bbcbf4-pvfhm 0/1 Pending 0 0s
NOTES:
** Please be patient while the chart is being deployed **
1. Get the DokuWiki URL by running:
export NODE_PORT=$(kubectl get --namespace doku -o jsonpath="{.spec.ports[0].nodePort}" services dokuwiki-course-deploy-dokuwiki)
export NODE_IP=$(kubectl get nodes --namespace doku -o jsonpath="{.items[0].status.addresses[0].address}")
echo "URL: http://$NODE_IP:$NODE_PORT/"
2. Login with the following credentials
echo Username: admin
echo Password: $(kubectl get secret --namespace doku dokuwiki-course-deploy-dokuwiki -o jsonpath="{.data.dokuwiki-password}" | base64 --decode)
Release "grafana-course-deploy" has been upgraded. Happy Helming!
LAST DEPLOYED: Wed Mar 13 05:29:55 2019
NAMESPACE: prometheus
STATUS: DEPLOYED
RESOURCES:
==> v1/ConfigMap
NAME DATA AGE
grafana-course-deploy 1 23h
==> v1/ClusterRole
NAME AGE
grafana-course-deploy-clusterrole 23h
==> v1/Service
NAME TYPE CLUSTER-IP EXTERNAL-IP PORT(S) AGE
grafana-course-deploy NodePort 100.69.248.75 <none> 80:30377/TCP 23h
==> v1/Pod(related)
NAME READY STATUS RESTARTS AGE
grafana-course-deploy-68c8968f9f-np9b9 1/1 Running 0 23h
==> v1/Secret
NAME TYPE DATA AGE
grafana-course-deploy Opaque 3 23h
==> v1/ServiceAccount
NAME SECRETS AGE
grafana-course-deploy 1 23h
==> v1/ClusterRoleBinding
NAME AGE
grafana-course-deploy-clusterrolebinding 23h
==> v1beta1/Role
NAME AGE
grafana-course-deploy 23h
==> v1beta1/RoleBinding
NAME AGE
grafana-course-deploy 23h
==> v1beta2/Deployment
NAME DESIRED CURRENT UP-TO-DATE AVAILABLE AGE
grafana-course-deploy 1 1 1 1 23h
==> v1beta1/PodSecurityPolicy
NAME DATA CAPS SELINUX RUNASUSER FSGROUP SUPGROUP READONLYROOTFS VOLUMES
grafana-course-deploy false RunAsAny RunAsAny RunAsAny RunAsAny false configMap,emptyDir,projected,secret,downwardAPI,persistentVolumeClaim
NOTES:
1. Get your 'admin' user password by running:
kubectl get secret --namespace prometheus grafana-course-deploy -o jsonpath="{.data.admin-password}" | base64 --decode ; echo
2. The Grafana server can be accessed via port 80 on the following DNS name from within your cluster:
grafana-course-deploy.prometheus.svc.cluster.local
Get the Grafana URL to visit by running these commands in the same shell:
export NODE_PORT=$(kubectl get --namespace prometheus -o jsonpath="{.spec.ports[0].nodePort}" services grafana-course-deploy)
export NODE_IP=$(kubectl get nodes --namespace prometheus -o jsonpath="{.items[0].status.addresses[0].address}")
echo http://$NODE_IP:$NODE_PORT
3. Login with the password from step 1 and the username: admin
#################################################################################
###### WARNING: Persistence is disabled!!! You will lose your data when #####
###### the Grafana pod is terminated. #####
#################################################################################
Release "prometheus-course-deploy" has been upgraded. Happy Helming!
LAST DEPLOYED: Wed Mar 13 05:29:55 2019
NAMESPACE: prometheus
STATUS: DEPLOYED
RESOURCES:
==> v1beta1/ClusterRoleBinding
NAME AGE
prometheus-course-deploy-kube-state-metrics 23h
prometheus-course-deploy-server 23h
==> v1beta1/DaemonSet
NAME DESIRED CURRENT READY UP-TO-DATE AVAILABLE NODE SELECTOR AGE
prometheus-course-deploy-node-exporter 2 2 2 2 2 <none> 23h
==> v1beta1/ClusterRole
NAME AGE
prometheus-course-deploy-kube-state-metrics 23h
prometheus-course-deploy-server 23h
==> v1/PersistentVolumeClaim
NAME STATUS VOLUME CAPACITY ACCESS MODES STORAGECLASS AGE
prometheus-course-deploy-server Bound pvc-79c6764f-4489-11e9-b1ba-023d0745758e 1Gi RWO gp2 23h
==> v1/ServiceAccount
NAME SECRETS AGE
prometheus-course-deploy-kube-state-metrics 1 23h
prometheus-course-deploy-node-exporter 1 23h
prometheus-course-deploy-server 1 23h
==> v1/Service
NAME TYPE CLUSTER-IP EXTERNAL-IP PORT(S) AGE
prometheus-course-deploy-kube-state-metrics ClusterIP None <none> 80/TCP 23h
prometheus-course-deploy-node-exporter ClusterIP None <none> 9100/TCP 23h
prometheus-course-deploy-server NodePort 100.68.41.209 <none> 80:30186/TCP 23h
==> v1beta1/Deployment
NAME DESIRED CURRENT UP-TO-DATE AVAILABLE AGE
prometheus-course-deploy-kube-state-metrics 1 1 1 1 23h
prometheus-course-deploy-server 1 1 1 0 23h
==> v1/Pod(related)
NAME READY STATUS RESTARTS AGE
prometheus-course-deploy-node-exporter-2shl2 1/1 Running 0 23h
prometheus-course-deploy-node-exporter-fm6w8 1/1 Running 0 23h
prometheus-course-deploy-kube-state-metrics-5b676d5d87-9c2tw 1/1 Running 0 23h
prometheus-course-deploy-server-5748f5f975-dp52k 1/2 CrashLoopBackOff 52 23h
==> v1/ConfigMap
NAME DATA AGE
prometheus-course-deploy-server 3 23h
NOTES:
The Prometheus server can be accessed via port 80 on the following DNS name from within your cluster:
prometheus-course-deploy-server.prometheus.svc.cluster.local
Get the Prometheus server URL by running these commands in the same shell:
export NODE_PORT=$(kubectl get --namespace prometheus -o jsonpath="{.spec.ports[0].nodePort}" services prometheus-course-deploy-server)
export NODE_IP=$(kubectl get nodes --namespace prometheus -o jsonpath="{.items[0].status.addresses[0].address}")
echo http://$NODE_IP:$NODE_PORT
For more information on running Prometheus, visit:
https://prometheus.io/
root@ubuntu-s-1vcpu-2gb-lon1-01:~/local_charts/prometheus_grafana#
- Ensure the pods and services are running properly
root@ubuntu-s-1vcpu-2gb-lon1-01:~/local_charts/prometheus_grafana# kubectl get pods,svc -n doku
NAME READY STATUS RESTARTS AGE
pod/dokuwiki-course-deploy-dokuwiki-b49bbcbf4-pvfhm 1/1 Running 0 2m
NAME TYPE CLUSTER-IP EXTERNAL-IP PORT(S) AGE
service/dokuwiki-course-deploy-dokuwiki NodePort 100.64.180.130 <none> 80:30830/TCP,443:31788/TCP 2m
root@ubuntu-s-1vcpu-2gb-lon1-01:~/local_charts/prometheus_grafana#
- We need to open the
30830port.
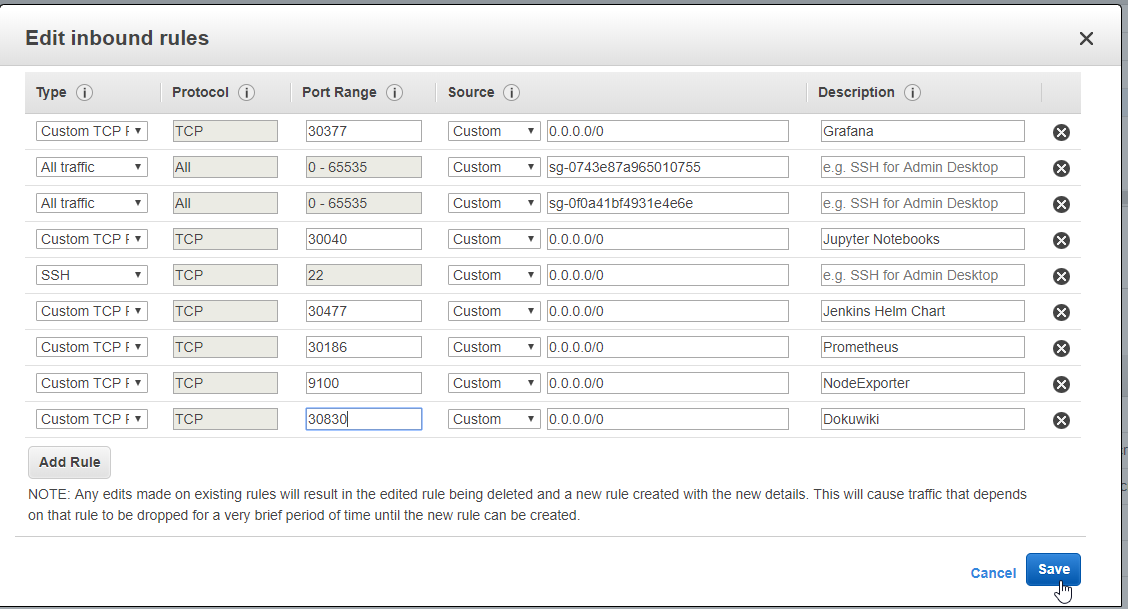
- Browse to http://18.184.104.252:30830
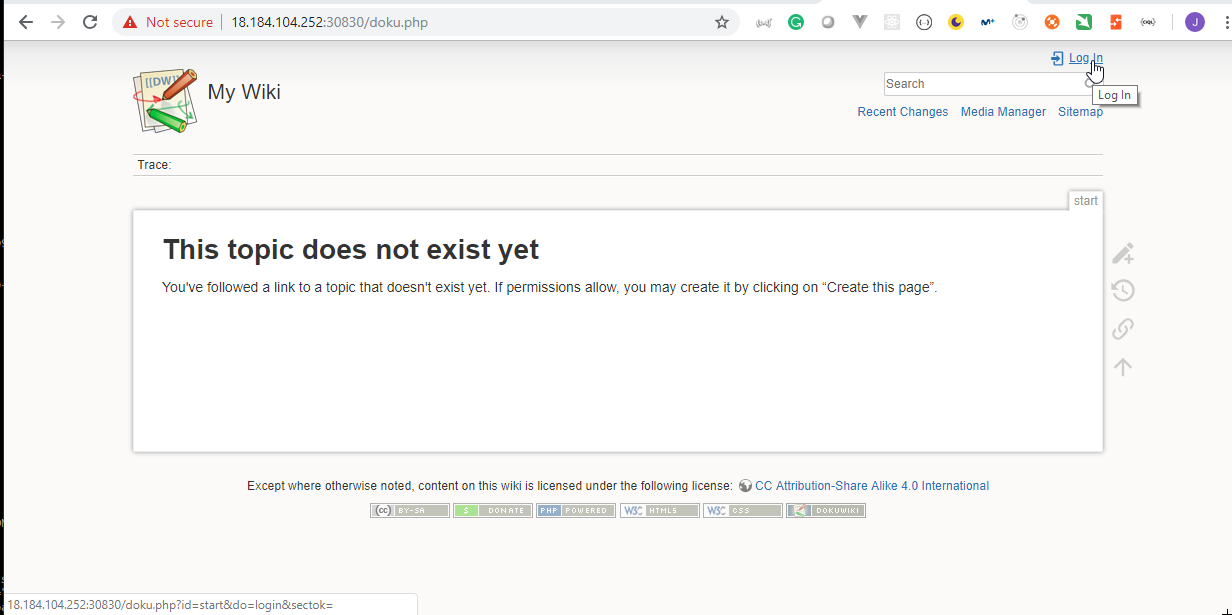
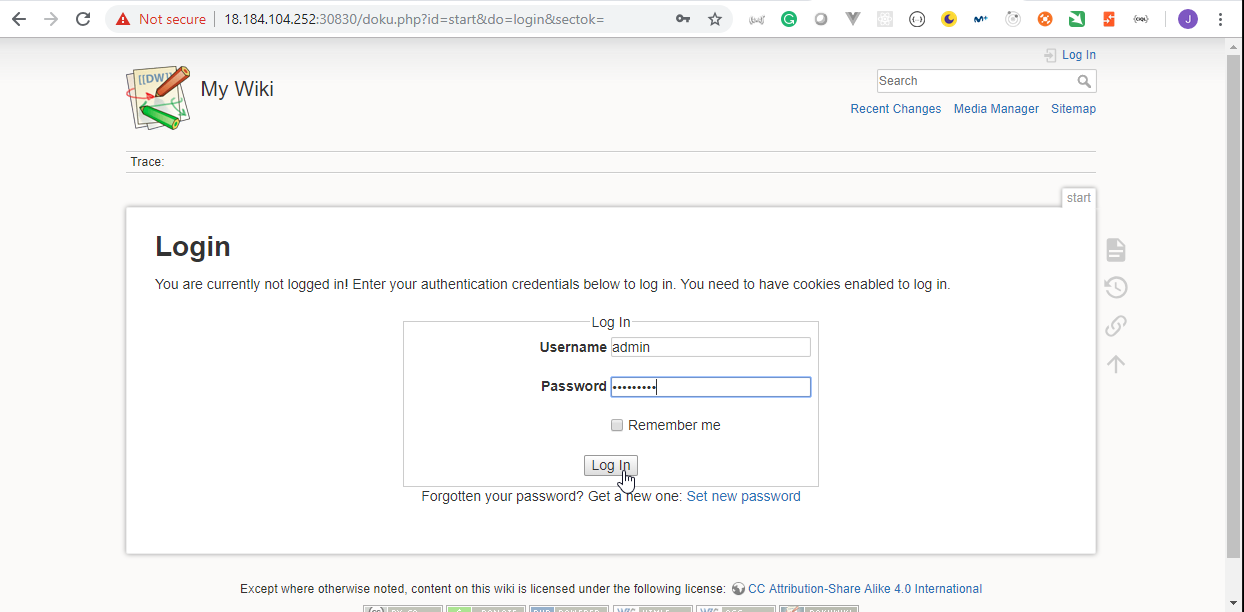
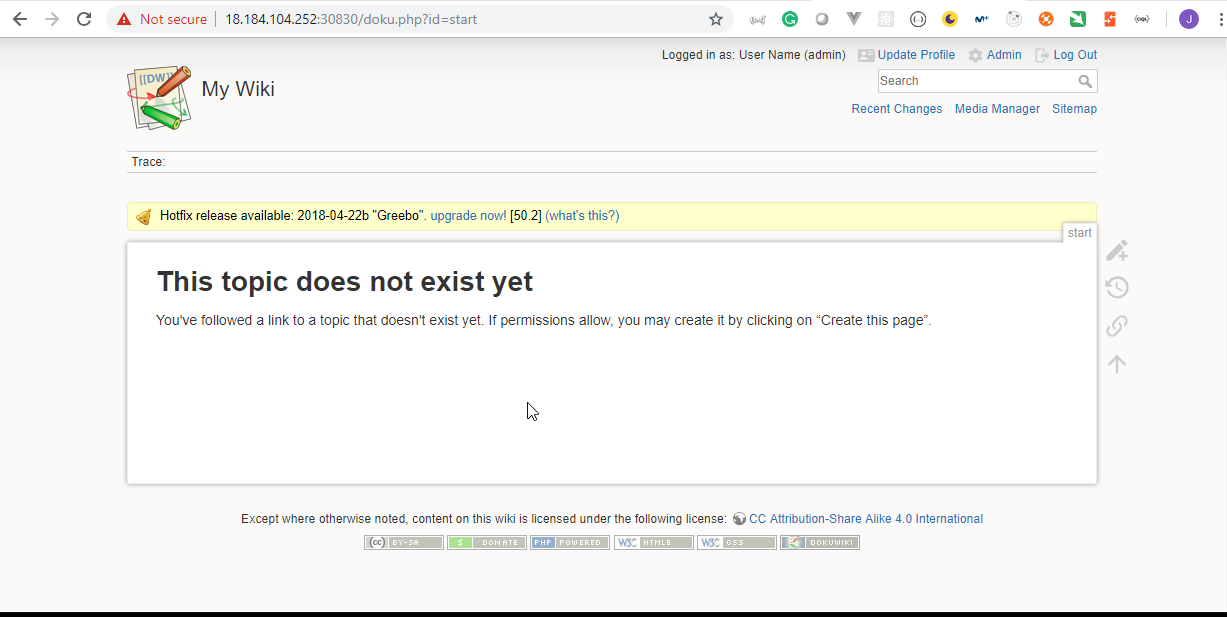
57. Materials: Helmfile specification to add nginx-ingress Helm Chart deployment
Helmfile specification to add nginx-ingress deployment to DokuWiki, Prometheus and Grafana
Process deployment:
navigate to a location with all these folders (grafana/, prometheus/, dokuwiki/, nginx_ingress/ ) created with corresponding values.yaml files.
Create this file: helmfile_specification_pg.yaml
# kubectl config view
context: course.<your_domain>.com # kube-context (--kube-context)
releases:
# Published chart example
- name: grafana-course-deploy # name of this release
namespace: prometheus # target namespace
chart: stable/grafana # repository/chart` syntax
values:
- grafana/values.yaml # value files (--values)
# Published chart example
- name: prometheus-course-deploy # name of this release
namespace: prometheus # target namespace
chart: stable/prometheus # repository/chart` syntax
values:
- prometheus/values.yaml # value files (--values)
# DokuWiki Helmfile specification
- name: dokuwiki-course-deploy # name of this release
namespace: doku # target namespace
chart: stable/dokuwiki # repository/chart` syntax
values:
- dokuwiki/values.yaml # value files (--values)
# nginx-ingress Helmfile specification
- name: nginx-course-deploy # name of this release
namespace: ingress # target namespace
chart: stable/nginx-ingress # repository/chart` syntax
values:
- nginx_ingress/values.yaml # value files (--values)
Process desired changes in nginx_ingress/values.yaml files.
Run:
helmfile -f helmfile_specification_pg.yaml syncRun
kubectl get pods,svc -n ingressto see nginx-ingress Kubernetes objects/
Note: I assume that if you are going through this course during several days - You always destroy all resources in AWS It means that you stop you Kubernetes cluster every time you are not working on it. The easiest way is to do it via terraform cd /.../.../.../terraform_code ; terraform destroy # hit yes
destroy/delete manually if terraform can't do that:
- VOLUMES
- LoadBalancer/s (if exists)
- RecordSet/s (custom RecordSet/s)
- EC2 instances
- network resources
- ...
except: - S3 bucket (delete once you do not want to use this free 1 YEAR account anymore, or you are done with this course.) - Hosted Zone (delete once you do not want to use this free 1 YEAR account anymore, or you are done with this course.)
Please do not forget redeploy tiller pod by using of this commands every time you are starting your Kubernetes cluster.
# Start your Kubernetes cluster
cd /.../.../.../terraform_code
terraform apply
# Crete service account && initiate tiller pod in your Kubernetes cluster
kubectl create serviceaccount --namespace kube-system tiller
kubectl create clusterrolebinding tiller-cluster-rule --clusterrole=cluster-admin --serviceaccount=kube-system:tiller
# kubectl patch deploy --namespace kube-system tiller-deploy -p '{"spec":{"template":{"spec":{"serviceAccount":"tiller"}}}}'
helm init --service-account tiller --upgrade
58. Nginx Ingress Controller Pod
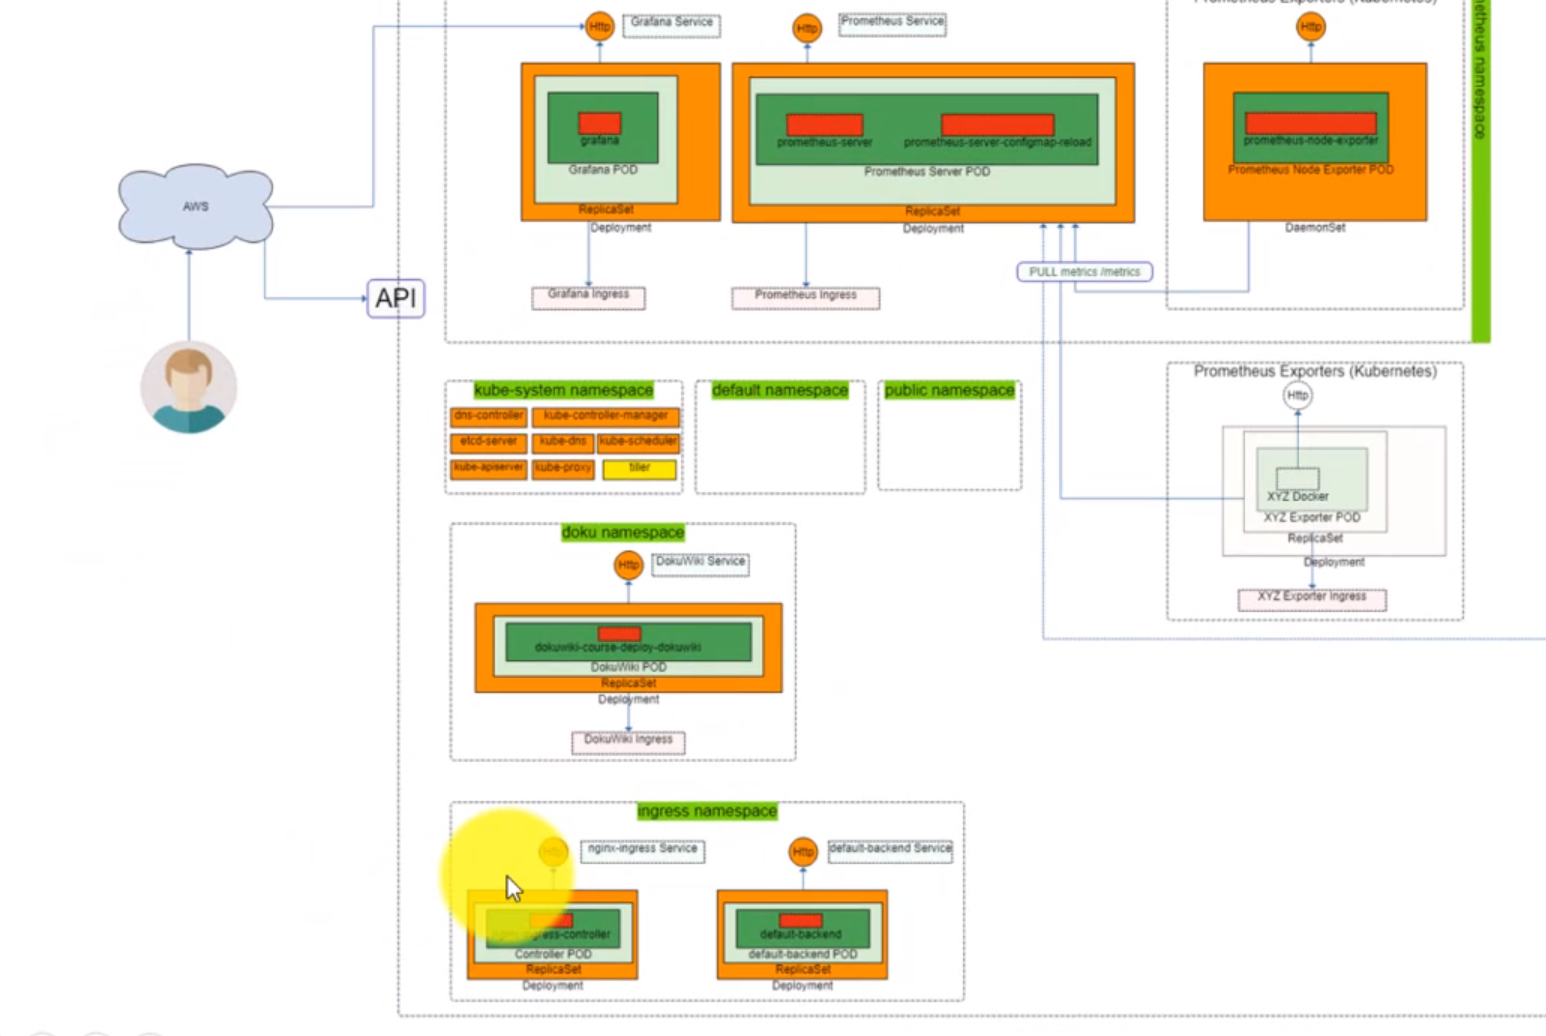
- We can use Ingress as a Single LoadBalancer service. Ingress is an API object that manages external access to the services in a cluster, typically HTTP.
Ingress can provide load balancing, SSL termination and name-based virtual hosting; it is an object that allows access to your Kubernetes services from outside the Kubernetes cluster. You configure access by creating a collection of rules that define which inbound connections reach which services. This lets you consolidate your routing rules into a single resource.
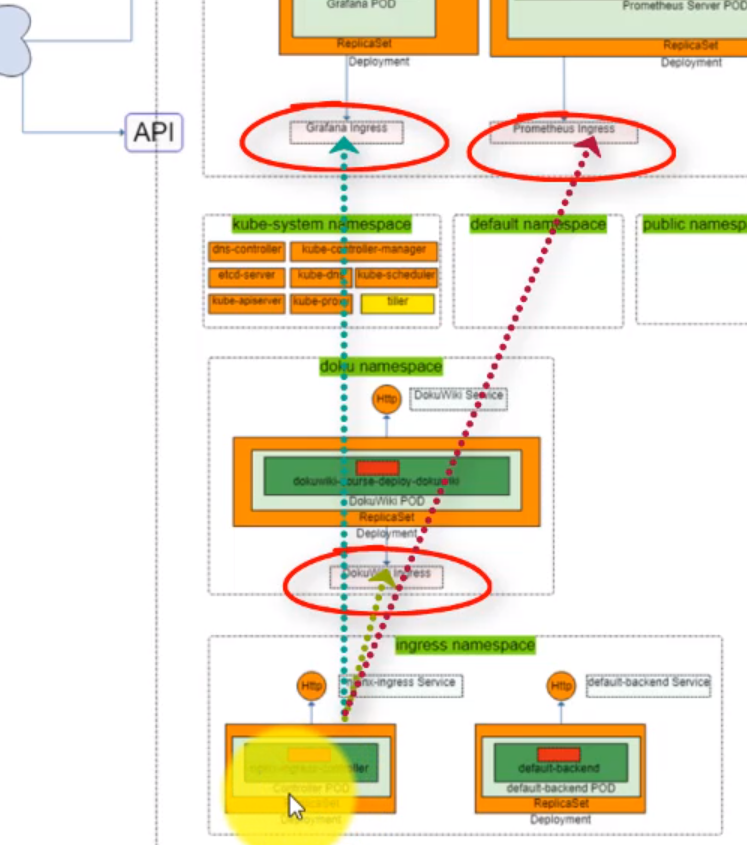
- Copy the
nginx-ingresschart folder from theHelm Chartslocal repository. We can get more information about it on Githut nginx-ingress chart.
root@ubuntu-s-1vcpu-2gb-lon1-01:~# cd local_charts/prometheus_grafana/
root@ubuntu-s-1vcpu-2gb-lon1-01:~/local_charts/prometheus_grafana# rsync -avhx ../../charts/stable/nginx-ingress .
sending incremental file list
nginx-ingress/
nginx-ingress/.helmignore
nginx-ingress/Chart.yaml
nginx-ingress/OWNERS
nginx-ingress/README.md
nginx-ingress/values.yaml
nginx-ingress/ci/
nginx-ingress/ci/psp-values.yaml
nginx-ingress/templates/
nginx-ingress/templates/NOTES.txt
nginx-ingress/templates/_helpers.tpl
nginx-ingress/templates/clusterrole.yaml
nginx-ingress/templates/clusterrolebinding.yaml
nginx-ingress/templates/controller-configmap.yaml
nginx-ingress/templates/controller-daemonset.yaml
nginx-ingress/templates/controller-deployment.yaml
nginx-ingress/templates/controller-hpa.yaml
nginx-ingress/templates/controller-metrics-service.yaml
nginx-ingress/templates/controller-poddisruptionbudget.yaml
nginx-ingress/templates/controller-service.yaml
nginx-ingress/templates/controller-servicemonitor.yaml
nginx-ingress/templates/controller-stats-service.yaml
nginx-ingress/templates/default-backend-deployment.yaml
nginx-ingress/templates/default-backend-poddisruptionbudget.yaml
nginx-ingress/templates/default-backend-service.yaml
nginx-ingress/templates/headers-configmap.yaml
nginx-ingress/templates/podsecuritypolicy.yaml
nginx-ingress/templates/role.yaml
nginx-ingress/templates/rolebinding.yaml
nginx-ingress/templates/scoped-clusterrole.yaml
nginx-ingress/templates/scoped-clusterrolebinding.yaml
nginx-ingress/templates/serviceaccount.yaml
nginx-ingress/templates/tcp-configmap.yaml
nginx-ingress/templates/udp-configmap.yaml
sent 74.58K bytes received 629 bytes 150.43K bytes/sec
total size is 72.11K speedup is 0.96
root@ubuntu-s-1vcpu-2gb-lon1-01:~/local_charts/prometheus_grafana# ll nginx-ingress/
total 60
drwxr-xr-x 4 root root 4096 Mar 10 06:17 ./
drwxr-xr-x 6 root root 4096 Mar 13 16:55 ../
-rw-r--r-- 1 root root 333 Mar 10 06:17 .helmignore
-rw-r--r-- 1 root root 528 Mar 10 06:17 Chart.yaml
-rw-r--r-- 1 root root 76 Mar 10 06:17 OWNERS
-rw-r--r-- 1 root root 16441 Mar 10 06:17 README.md
drwxr-xr-x 2 root root 4096 Mar 10 06:17 ci/
drwxr-xr-x 2 root root 4096 Mar 10 06:17 templates/
-rw-r--r-- 1 root root 9721 Mar 10 06:17 values.yaml
Nothing has to be changed on the
nginx-ingress/values.yamldocument.Modify the
helmfile_specification_pg.yamldocument
helmfile_specification_pg.yaml
context: kops.peelmicro.com # kube-context (--kube-context)
releases:
# Published chart example
- name: grafana-course-deploy # name of this release
namespace: prometheus # target namespace
chart: stable/grafana # repository/chart` syntax
values:
- grafana/values.yaml # value files (--values)
# Published chart example
- name: prometheus-course-deploy # name of this release
namespace: prometheus # target namespace
chart: stable/prometheus # repository/chart` syntax
values:
- prometheus/values.yaml # value files (--values)
# DokuWiki Helmfile specification
- name: dokuwiki-course-deploy # name of this release
namespace: doku # target namespace
chart: stable/dokuwiki # repository/chart` syntax
values:
- dokuwiki/values.yaml # value files (--values)
# nginx-ingress Helmfile specification
- name: nginx-course-deploy # name of this release
namespace: ingress # target namespace
chart: stable/nginx-ingress # repository/chart` syntax
values:
- nginx-ingress/values.yaml # value files (--values)
root@ubuntu-s-1vcpu-2gb-lon1-01:~/local_charts/prometheus_grafana# vi helmfile_specification_pg.yaml
root@ubuntu-s-1vcpu-2gb-lon1-01:~/local_charts/prometheus_grafana#
- Deploy the changes.
root@ubuntu-s-1vcpu-2gb-lon1-01:~/local_charts/prometheus_grafana# helmfile -f helmfile_specification_pg.yaml sync
exec: helm repo update --kube-context kops.peelmicro.com
Hang tight while we grab the latest from your chart repositories...
...Skip local chart repository
...Successfully got an update from the "incubator" chart repository
...Successfully got an update from the "stable" chart repository
Update Complete. ? Happy Helming!?
exec: helm upgrade --install --reset-values grafana-course-deploy stable/grafana --namespace prometheus --values /root/local_charts/prometheus_grafana/grafana/values.yaml --kube-context kops.peelmicro.com
exec: helm upgrade --install --reset-values prometheus-course-deploy stable/prometheus --namespace prometheus --values /root/local_charts/prometheus_grafana/prometheus/values.yaml --kube-context kops.peelmicro.com
exec: helm upgrade --install --reset-values dokuwiki-course-deploy stable/dokuwiki --namespace doku --values /root/local_charts/prometheus_grafana/dokuwiki/values.yaml --kube-context kops.peelmicro.com
exec: helm upgrade --install --reset-values nginx-course-deploy stable/nginx-ingress --namespace ingress --values /root/local_charts/prometheus_grafana/nginx-ingress/values.yaml --kube-context kops.peelmicro.com
Release "nginx-course-deploy" does not exist. Installing it now.
NAME: nginx-course-deploy
LAST DEPLOYED: Wed Mar 13 17:10:23 2019
NAMESPACE: ingress
STATUS: DEPLOYED
RESOURCES:
==> v1beta1/ClusterRoleBinding
NAME AGE
nginx-course-deploy-nginx-ingress 2s
==> v1beta1/Role
NAME AGE
nginx-course-deploy-nginx-ingress 2s
==> v1beta1/Deployment
NAME DESIRED CURRENT UP-TO-DATE AVAILABLE AGE
nginx-course-deploy-nginx-ingress-controller 1 1 1 0 2s
nginx-course-deploy-nginx-ingress-default-backend 1 1 1 0 2s
==> v1/ServiceAccount
NAME SECRETS AGE
nginx-course-deploy-nginx-ingress 1 2s
==> v1beta1/ClusterRole
NAME AGE
nginx-course-deploy-nginx-ingress 2s
==> v1beta1/RoleBinding
NAME AGE
nginx-course-deploy-nginx-ingress 2s
==> v1/Service
NAME TYPE CLUSTER-IP EXTERNAL-IP PORT(S) AGE
nginx-course-deploy-nginx-ingress-controller LoadBalancer 100.68.166.91 <pending> 80:31922/TCP,443:30284/TCP 2s
nginx-course-deploy-nginx-ingress-default-backend ClusterIP 100.64.200.87 <none> 80/TCP 2s
==> v1/Pod(related)
NAME READY STATUS RESTARTS AGE
nginx-course-deploy-nginx-ingress-controller-6f8469f787-rgbm9 0/1 ContainerCreating 0 2s
nginx-course-deploy-nginx-ingress-default-backend-6d77776fjbsf6 0/1 ContainerCreating 0 2s
==> v1/ConfigMap
NAME DATA AGE
nginx-course-deploy-nginx-ingress-controller 1 2s
NOTES:
The nginx-ingress controller has been installed.
It may take a few minutes for the LoadBalancer IP to be available.
You can watch the status by running 'kubectl --namespace ingress get services -o wide -w nginx-course-deploy-nginx-ingress-controller'
An example Ingress that makes use of the controller:
apiVersion: extensions/v1beta1
kind: Ingress
metadata:
annotations:
kubernetes.io/ingress.class: nginx
name: example
namespace: foo
spec:
rules:
- host: www.example.com
http:
paths:
- backend:
serviceName: exampleService
servicePort: 80
path: /
# This section is only required if TLS is to be enabled for the Ingress
tls:
- hosts:
- www.example.com
secretName: example-tls
If TLS is enabled for the Ingress, a Secret containing the certificate and key must also be provided:
apiVersion: v1
kind: Secret
metadata:
name: example-tls
namespace: foo
data:
tls.crt: <base64 encoded cert>
tls.key: <base64 encoded key>
type: kubernetes.io/tls
Release "dokuwiki-course-deploy" has been upgraded. Happy Helming!
LAST DEPLOYED: Wed Mar 13 17:10:23 2019
NAMESPACE: doku
STATUS: DEPLOYED
RESOURCES:
==> v1/Secret
NAME TYPE DATA AGE
dokuwiki-course-deploy-dokuwiki Opaque 1 11h
==> v1/PersistentVolumeClaim
NAME STATUS VOLUME CAPACITY ACCESS MODES STORAGECLASS AGE
dokuwiki-course-deploy-dokuwiki-apache Bound pvc-092a3755-4551-11e9-b1ba-023d0745758e 1Gi RWO gp2 11h
dokuwiki-course-deploy-dokuwiki-dokuwiki Bound pvc-092c5aad-4551-11e9-b1ba-023d0745758e 8Gi RWO gp2 11h
==> v1/Service
NAME TYPE CLUSTER-IP EXTERNAL-IP PORT(S) AGE
dokuwiki-course-deploy-dokuwiki NodePort 100.64.180.130 <none> 80:30830/TCP,443:31788/TCP 11h
==> v1beta1/Deployment
NAME DESIRED CURRENT UP-TO-DATE AVAILABLE AGE
dokuwiki-course-deploy-dokuwiki 1 1 1 1 11h
==> v1/Pod(related)
NAME READY STATUS RESTARTS AGE
dokuwiki-course-deploy-dokuwiki-b49bbcbf4-pvfhm 1/1 Running 1 11h
NOTES:
** Please be patient while the chart is being deployed **
1. Get the DokuWiki URL by running:
export NODE_PORT=$(kubectl get --namespace doku -o jsonpath="{.spec.ports[0].nodePort}" services dokuwiki-course-deploy-dokuwiki)
export NODE_IP=$(kubectl get nodes --namespace doku -o jsonpath="{.items[0].status.addresses[0].address}")
echo "URL: http://$NODE_IP:$NODE_PORT/"
2. Login with the following credentials
echo Username: admin
echo Password: $(kubectl get secret --namespace doku dokuwiki-course-deploy-dokuwiki -o jsonpath="{.data.dokuwiki-password}" | base64 --decode)
Release "grafana-course-deploy" has been upgraded. Happy Helming!
LAST DEPLOYED: Wed Mar 13 17:10:23 2019
NAMESPACE: prometheus
STATUS: DEPLOYED
RESOURCES:
==> v1/ServiceAccount
NAME SECRETS AGE
grafana-course-deploy 1 1d
==> v1/ClusterRole
NAME AGE
grafana-course-deploy-clusterrole 1d
==> v1/Pod(related)
NAME READY STATUS RESTARTS AGE
grafana-course-deploy-68c8968f9f-np9b9 1/1 Running 1 1d
==> v1/Secret
NAME TYPE DATA AGE
grafana-course-deploy Opaque 3 1d
==> v1/ConfigMap
NAME DATA AGE
grafana-course-deploy 1 1d
==> v1beta1/RoleBinding
NAME AGE
grafana-course-deploy 1d
==> v1/Service
NAME TYPE CLUSTER-IP EXTERNAL-IP PORT(S) AGE
grafana-course-deploy NodePort 100.69.248.75 <none> 80:30377/TCP 1d
==> v1beta2/Deployment
NAME DESIRED CURRENT UP-TO-DATE AVAILABLE AGE
grafana-course-deploy 1 1 1 1 1d
==> v1beta1/PodSecurityPolicy
NAME DATA CAPS SELINUX RUNASUSER FSGROUP SUPGROUP READONLYROOTFS VOLUMES
grafana-course-deploy false RunAsAny RunAsAny RunAsAny RunAsAny false configMap,emptyDir,projected,secret,downwardAPI,persistentVolumeClaim
==> v1/ClusterRoleBinding
NAME AGE
grafana-course-deploy-clusterrolebinding 1d
==> v1beta1/Role
NAME AGE
grafana-course-deploy 1d
NOTES:
1. Get your 'admin' user password by running:
kubectl get secret --namespace prometheus grafana-course-deploy -o jsonpath="{.data.admin-password}" | base64 --decode ; echo
2. The Grafana server can be accessed via port 80 on the following DNS name from within your cluster:
grafana-course-deploy.prometheus.svc.cluster.local
Get the Grafana URL to visit by running these commands in the same shell:
export NODE_PORT=$(kubectl get --namespace prometheus -o jsonpath="{.spec.ports[0].nodePort}" services grafana-course-deploy)
export NODE_IP=$(kubectl get nodes --namespace prometheus -o jsonpath="{.items[0].status.addresses[0].address}")
echo http://$NODE_IP:$NODE_PORT
3. Login with the password from step 1 and the username: admin
#################################################################################
###### WARNING: Persistence is disabled!!! You will lose your data when #####
###### the Grafana pod is terminated. #####
#################################################################################
Release "prometheus-course-deploy" has been upgraded. Happy Helming!
LAST DEPLOYED: Wed Mar 13 17:10:24 2019
NAMESPACE: prometheus
STATUS: DEPLOYED
RESOURCES:
==> v1beta1/DaemonSet
NAME DESIRED CURRENT READY UP-TO-DATE AVAILABLE NODE SELECTOR AGE
prometheus-course-deploy-node-exporter 2 2 2 2 2 <none> 1d
==> v1beta1/Deployment
NAME DESIRED CURRENT UP-TO-DATE AVAILABLE AGE
prometheus-course-deploy-kube-state-metrics 1 1 1 1 1d
prometheus-course-deploy-server 1 1 1 0 1d
==> v1/ConfigMap
NAME DATA AGE
prometheus-course-deploy-server 3 1d
==> v1/ServiceAccount
NAME SECRETS AGE
prometheus-course-deploy-kube-state-metrics 1 1d
prometheus-course-deploy-node-exporter 1 1d
prometheus-course-deploy-server 1 1d
==> v1beta1/ClusterRoleBinding
NAME AGE
prometheus-course-deploy-kube-state-metrics 1d
prometheus-course-deploy-server 1d
==> v1/Pod(related)
NAME READY STATUS RESTARTS AGE
prometheus-course-deploy-node-exporter-2shl2 1/1 Running 0 1d
prometheus-course-deploy-node-exporter-fm6w8 1/1 Running 1 1d
prometheus-course-deploy-kube-state-metrics-5b676d5d87-9c2tw 1/1 Running 1 1d
prometheus-course-deploy-server-5748f5f975-dp52k 1/2 CrashLoopBackOff 180 1d
==> v1/PersistentVolumeClaim
NAME STATUS VOLUME CAPACITY ACCESS MODES STORAGECLASS AGE
prometheus-course-deploy-server Bound pvc-79c6764f-4489-11e9-b1ba-023d0745758e 1Gi RWO gp2 1d
==> v1beta1/ClusterRole
NAME AGE
prometheus-course-deploy-kube-state-metrics 1d
prometheus-course-deploy-server 1d
==> v1/Service
NAME TYPE CLUSTER-IP EXTERNAL-IP PORT(S) AGE
prometheus-course-deploy-kube-state-metrics ClusterIP None <none> 80/TCP 1d
prometheus-course-deploy-node-exporter ClusterIP None <none> 9100/TCP 1d
prometheus-course-deploy-server NodePort 100.68.41.209 <none> 80:30186/TCP 1d
NOTES:
The Prometheus server can be accessed via port 80 on the following DNS name from within your cluster:
prometheus-course-deploy-server.prometheus.svc.cluster.local
Get the Prometheus server URL by running these commands in the same shell:
export NODE_PORT=$(kubectl get --namespace prometheus -o jsonpath="{.spec.ports[0].nodePort}" services prometheus-course-deploy-server)
export NODE_IP=$(kubectl get nodes --namespace prometheus -o jsonpath="{.items[0].status.addresses[0].address}")
echo http://$NODE_IP:$NODE_PORT
For more information on running Prometheus, visit:
https://prometheus.io/
root@ubuntu-s-1vcpu-2gb-lon1-01:~/local_charts/prometheus_grafana#
- Ensure the pods and services have been created
root@ubuntu-s-1vcpu-2gb-lon1-01:~/local_charts/prometheus_grafana# kubectl get pods,svc -n ingress
NAME READY STATUS RESTARTS AGE
pod/nginx-course-deploy-nginx-ingress-controller-6f8469f787-rgbm9 1/1 Running 0 2m
pod/nginx-course-deploy-nginx-ingress-default-backend-6d77776fjbsf6 1/1 Running 0 2m
NAME TYPE CLUSTER-IP EXTERNAL-IP PORT(S) AGE
service/nginx-course-deploy-nginx-ingress-controller LoadBalancer 100.68.166.91 ae3a20fc245b211e9b1ba023d0745758-1989208325.eu-central-1.elb.amazonaws.com 80:31922/TCP,443:30284/TCP 2m
service/nginx-course-deploy-nginx-ingress-default-backend ClusterIP 100.64.200.87 <none> 80/TCP 2m
- We can ensure that the LoadBalancer has been created on the
AWS console

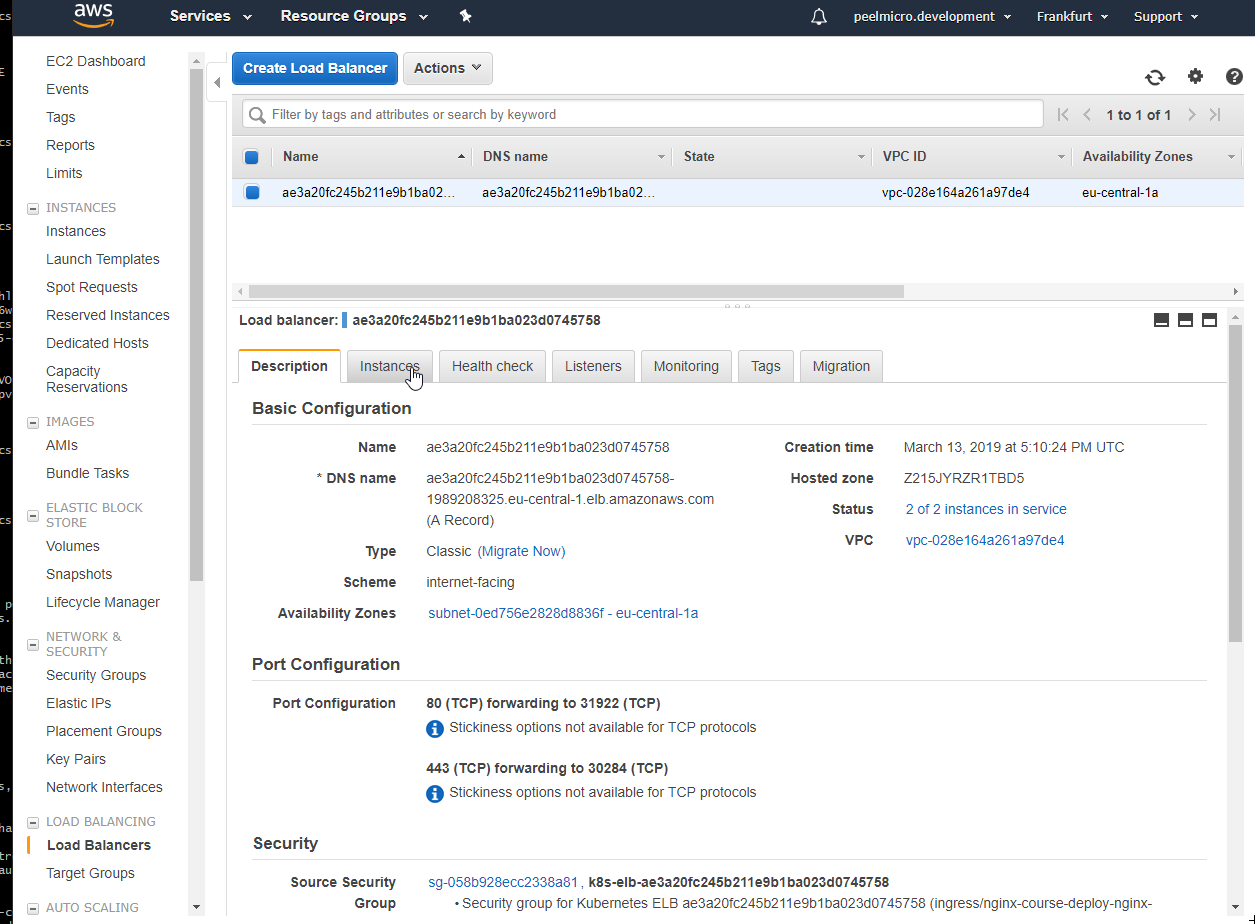
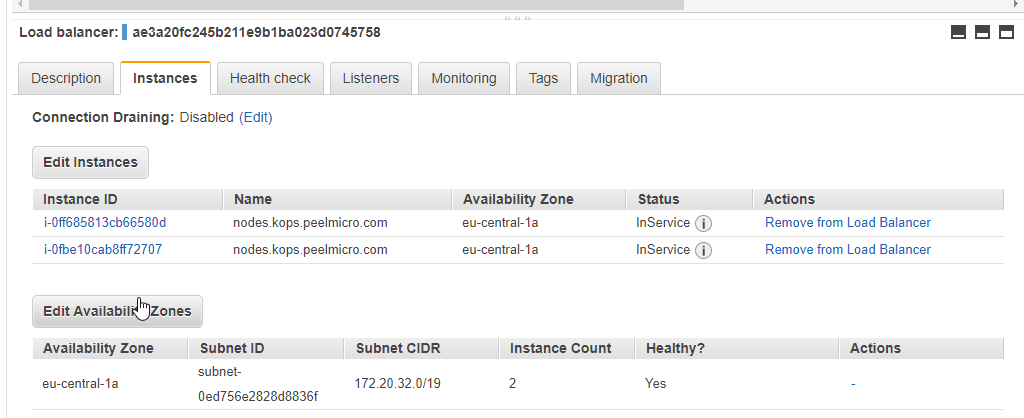
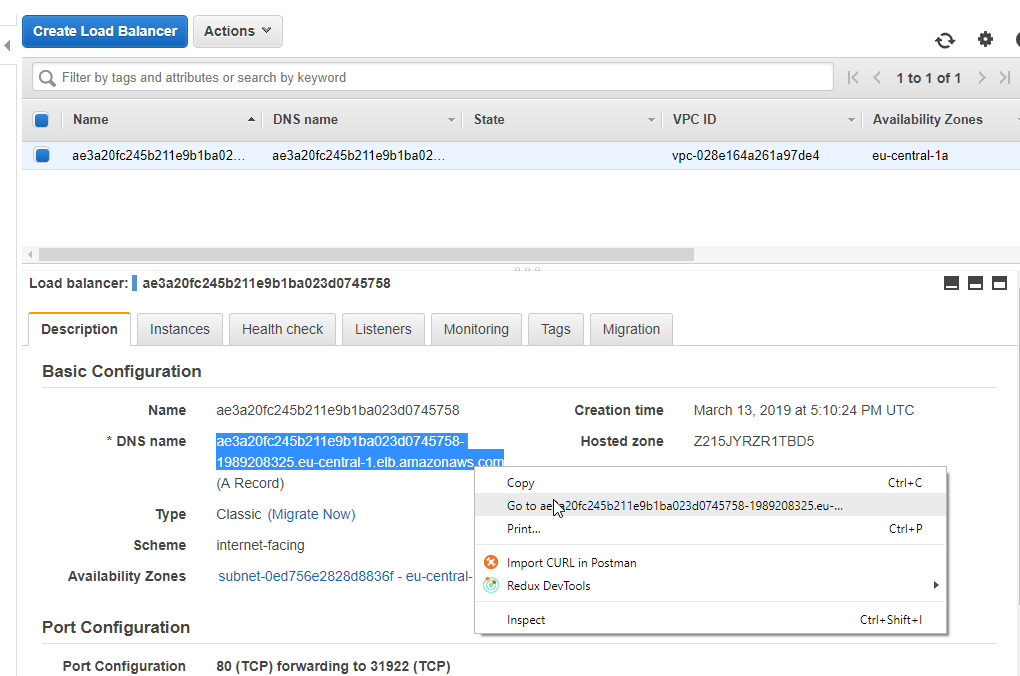

59. Configure Ingress Kubernetes Objects for Grafana, Prometheus and DokuWiki
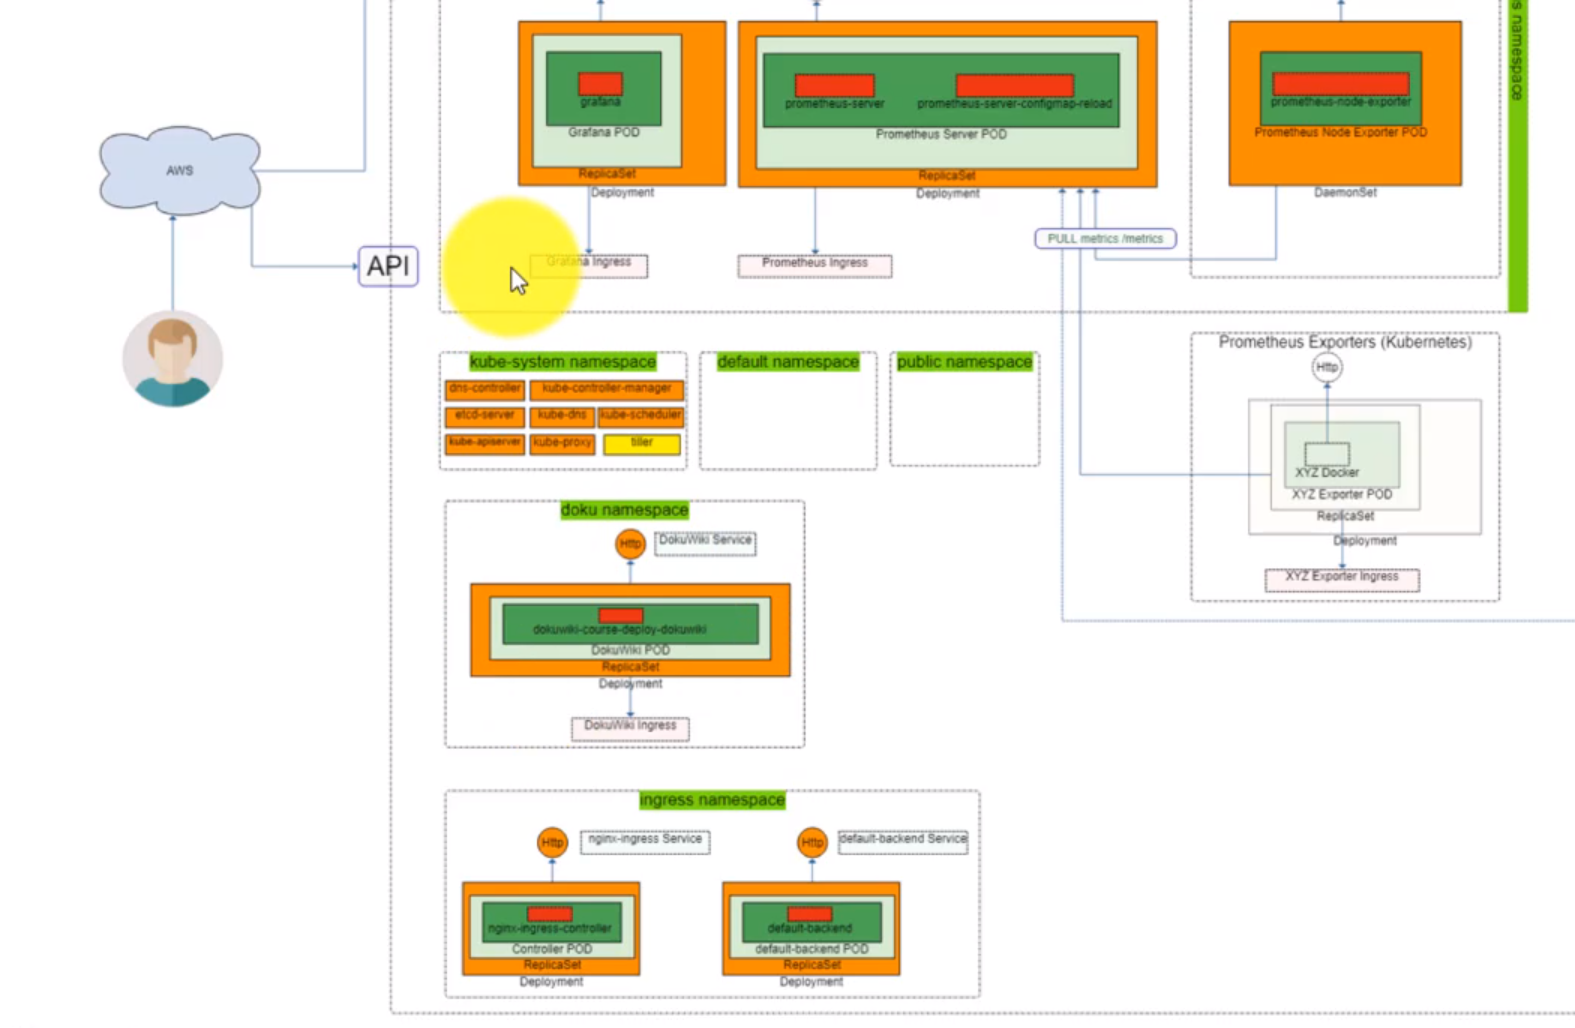
root@ubuntu-s-1vcpu-2gb-lon1-01:~/local_charts/prometheus_grafana# kubectl get ingress --all-namespaces
No resources found.
- Modify the
prometheus/values.yamldocument to:
- change
server: ingress: enabled: falsetoserver: ingress: enabled: true - change
server: ingress: hosts: []toserver: ingress: hosts: ["prometheus.course.devopsinuse.com"]
root@ubuntu-s-1vcpu-2gb-lon1-01:~/local_charts/prometheus_grafana# vi prometheus/values.yaml
root@ubuntu-s-1vcpu-2gb-lon1-01:~/local_charts/prometheus_grafana#
- Modify the
grafana/values.yamldocument to:
- change
ingress: enabled: falsetoingress: enabled: true - change
hosts: - chart-example.localtohosts: - grafana.course.devopsinuse.com
root@ubuntu-s-1vcpu-2gb-lon1-01:~/local_charts/prometheus_grafana# vi grafana/values.yaml
root@ubuntu-s-1vcpu-2gb-lon1-01:~/local_charts/prometheus_grafana#
- Modify the
dokuwiki/values.yamldocument to:
- change
ingress: enabled: falsetoingress: enabled: true - change
hosts: name: dokuwiki.localtohosts: name: dokuwiki.course.devopsinuse.com
root@ubuntu-s-1vcpu-2gb-lon1-01:~/local_charts/prometheus_grafana# vi dokuwiki/values.yaml
root@ubuntu-s-1vcpu-2gb-lon1-01:~/local_charts/prometheus_grafana#
- Deploy the changes.
root@ubuntu-s-1vcpu-2gb-lon1-01:~/local_charts/prometheus_grafana# helmfile -f helmfile_specification_pg.yaml sync
exec: helm repo update --kube-context kops.peelmicro.com
Hang tight while we grab the latest from your chart repositories...
...Skip local chart repository
...Successfully got an update from the "incubator" chart repository
...Successfully got an update from the "stable" chart repository
Update Complete. ? Happy Helming!?
exec: helm upgrade --install --reset-values grafana-course-deploy stable/grafana --namespace prometheus --values /root/local_charts/prometheus_grafana/grafana/values.yaml --kube-context kops.peelmicro.com
exec: helm upgrade --install --reset-values prometheus-course-deploy stable/prometheus --namespace prometheus --values /root/local_charts/prometheus_grafana/prometheus/values.yaml --kube-context kops.peelmicro.com
exec: helm upgrade --install --reset-values dokuwiki-course-deploy stable/dokuwiki --namespace doku --values /root/local_charts/prometheus_grafana/dokuwiki/values.yaml --kube-context kops.peelmicro.com
exec: helm upgrade --install --reset-values nginx-course-deploy stable/nginx-ingress --namespace ingress --values /root/local_charts/prometheus_grafana/nginx-ingress/values.yaml --kube-context kops.peelmicro.com
Release "grafana-course-deploy" has been upgraded. Happy Helming!
LAST DEPLOYED: Wed Mar 13 17:42:26 2019
NAMESPACE: prometheus
STATUS: DEPLOYED
RESOURCES:
==> v1/ClusterRoleBinding
NAME AGE
grafana-course-deploy-clusterrolebinding 1d
==> v1beta1/Role
NAME AGE
grafana-course-deploy 1d
==> v1/Service
NAME TYPE CLUSTER-IP EXTERNAL-IP PORT(S) AGE
grafana-course-deploy NodePort 100.69.248.75 <none> 80:30377/TCP 1d
==> v1beta2/Deployment
NAME DESIRED CURRENT UP-TO-DATE AVAILABLE AGE
grafana-course-deploy 1 1 1 1 1d
==> v1/Pod(related)
NAME READY STATUS RESTARTS AGE
grafana-course-deploy-68c8968f9f-np9b9 1/1 Running 1 1d
==> v1/ConfigMap
NAME DATA AGE
grafana-course-deploy 1 1d
==> v1/ServiceAccount
NAME SECRETS AGE
grafana-course-deploy 1 1d
==> v1/ClusterRole
NAME AGE
grafana-course-deploy-clusterrole 1d
==> v1beta1/RoleBinding
NAME AGE
grafana-course-deploy 1d
==> v1beta1/Ingress
NAME HOSTS ADDRESS PORTS AGE
grafana-course-deploy grafana.course.devopsinuse.com 80 2s
==> v1beta1/PodSecurityPolicy
NAME DATA CAPS SELINUX RUNASUSER FSGROUP SUPGROUP READONLYROOTFS VOLUMES
grafana-course-deploy false RunAsAny RunAsAny RunAsAny RunAsAny false configMap,emptyDir,projected,secret,downwardAPI,persistentVolumeClaim
==> v1/Secret
NAME TYPE DATA AGE
grafana-course-deploy Opaque 3 1d
NOTES:
1. Get your 'admin' user password by running:
kubectl get secret --namespace prometheus grafana-course-deploy -o jsonpath="{.data.admin-password}" | base64 --decode ; echo
2. The Grafana server can be accessed via port 80 on the following DNS name from within your cluster:
grafana-course-deploy.prometheus.svc.cluster.local
From outside the cluster, the server URL(s) are:
http://grafana.course.devopsinuse.com
3. Login with the password from step 1 and the username: admin
#################################################################################
###### WARNING: Persistence is disabled!!! You will lose your data when #####
###### the Grafana pod is terminated. #####
#################################################################################
Release "nginx-course-deploy" has been upgraded. Happy Helming!
LAST DEPLOYED: Wed Mar 13 17:42:25 2019
NAMESPACE: ingress
STATUS: DEPLOYED
RESOURCES:
==> v1beta1/Role
NAME AGE
nginx-course-deploy-nginx-ingress 32m
==> v1/Service
NAME TYPE CLUSTER-IP EXTERNAL-IP PORT(S) AGE
nginx-course-deploy-nginx-ingress-controller LoadBalancer 100.68.166.91 ae3a20fc245b2... 80:31922/TCP,443:30284/TCP 32m
nginx-course-deploy-nginx-ingress-default-backend ClusterIP 100.64.200.87 <none> 80/TCP 32m
==> v1beta1/Deployment
NAME DESIRED CURRENT UP-TO-DATE AVAILABLE AGE
nginx-course-deploy-nginx-ingress-controller 1 1 1 1 32m
nginx-course-deploy-nginx-ingress-default-backend 1 1 1 1 32m
==> v1/ConfigMap
NAME DATA AGE
nginx-course-deploy-nginx-ingress-controller 1 32m
==> v1/ServiceAccount
NAME SECRETS AGE
nginx-course-deploy-nginx-ingress 1 32m
==> v1beta1/RoleBinding
NAME AGE
nginx-course-deploy-nginx-ingress 32m
==> v1/Pod(related)
NAME READY STATUS RESTARTS AGE
nginx-course-deploy-nginx-ingress-controller-6f8469f787-rgbm9 1/1 Running 0 32m
nginx-course-deploy-nginx-ingress-default-backend-6d77776fjbsf6 1/1 Running 0 32m
==> v1beta1/ClusterRole
NAME AGE
nginx-course-deploy-nginx-ingress 32m
==> v1beta1/ClusterRoleBinding
NAME AGE
nginx-course-deploy-nginx-ingress 32m
NOTES:
The nginx-ingress controller has been installed.
It may take a few minutes for the LoadBalancer IP to be available.
You can watch the status by running 'kubectl --namespace ingress get services -o wide -w nginx-course-deploy-nginx-ingress-controller'
An example Ingress that makes use of the controller:
apiVersion: extensions/v1beta1
kind: Ingress
metadata:
annotations:
kubernetes.io/ingress.class: nginx
name: example
namespace: foo
spec:
rules:
- host: www.example.com
http:
paths:
- backend:
serviceName: exampleService
servicePort: 80
path: /
# This section is only required if TLS is to be enabled for the Ingress
tls:
- hosts:
- www.example.com
secretName: example-tls
If TLS is enabled for the Ingress, a Secret containing the certificate and key must also be provided:
apiVersion: v1
kind: Secret
metadata:
name: example-tls
namespace: foo
data:
tls.crt: <base64 encoded cert>
tls.key: <base64 encoded key>
type: kubernetes.io/tls
Release "dokuwiki-course-deploy" has been upgraded. Happy Helming!
LAST DEPLOYED: Wed Mar 13 17:42:25 2019
NAMESPACE: doku
STATUS: DEPLOYED
RESOURCES:
==> v1/Service
NAME TYPE CLUSTER-IP EXTERNAL-IP PORT(S) AGE
dokuwiki-course-deploy-dokuwiki NodePort 100.64.180.130 <none> 80:30830/TCP,443:31788/TCP 12h
==> v1beta1/Deployment
NAME DESIRED CURRENT UP-TO-DATE AVAILABLE AGE
dokuwiki-course-deploy-dokuwiki 1 1 1 1 12h
==> v1beta1/Ingress
NAME HOSTS ADDRESS PORTS AGE
dokuwiki-course-deploy-dokuwiki dokuwiki.course.devopsinuse.com 80 3s
==> v1/Pod(related)
NAME READY STATUS RESTARTS AGE
dokuwiki-course-deploy-dokuwiki-b49bbcbf4-pvfhm 1/1 Running 1 12h
==> v1/Secret
NAME TYPE DATA AGE
dokuwiki-course-deploy-dokuwiki Opaque 1 12h
==> v1/PersistentVolumeClaim
NAME STATUS VOLUME CAPACITY ACCESS MODES STORAGECLASS AGE
dokuwiki-course-deploy-dokuwiki-apache Bound pvc-092a3755-4551-11e9-b1ba-023d0745758e 1Gi RWO gp2 12h
dokuwiki-course-deploy-dokuwiki-dokuwiki Bound pvc-092c5aad-4551-11e9-b1ba-023d0745758e 8Gi RWO gp2 12h
NOTES:
** Please be patient while the chart is being deployed **
1. Get the DokuWiki URL indicated on the Ingress Rule and associate it to your cluster external IP:
export CLUSTER_IP=$(minikube ip) # On Minikube. Use: `kubectl cluster-info` on others K8s clusters
export HOSTNAME=$(kubectl get ingress --namespace doku dokuwiki-course-deploy-dokuwiki -o jsonpath='{.spec.rules[0].host}')
echo "Dokuwiki URL: http://$HOSTNAME/"
echo "$CLUSTER_IP $HOSTNAME" | sudo tee -a /etc/hosts
2. Login with the following credentials
echo Username: admin
echo Password: $(kubectl get secret --namespace doku dokuwiki-course-deploy-dokuwiki -o jsonpath="{.data.dokuwiki-password}" | base64 --decode)
Release "prometheus-course-deploy" has been upgraded. Happy Helming!
LAST DEPLOYED: Wed Mar 13 17:42:26 2019
NAMESPACE: prometheus
STATUS: DEPLOYED
RESOURCES:
==> v1/PersistentVolumeClaim
NAME STATUS VOLUME CAPACITY ACCESS MODES STORAGECLASS AGE
prometheus-course-deploy-server Bound pvc-79c6764f-4489-11e9-b1ba-023d0745758e 1Gi RWO gp2 1d
==> v1beta1/ClusterRole
NAME AGE
prometheus-course-deploy-kube-state-metrics 1d
prometheus-course-deploy-server 1d
==> v1beta1/Deployment
NAME DESIRED CURRENT UP-TO-DATE AVAILABLE AGE
prometheus-course-deploy-kube-state-metrics 1 1 1 1 1d
prometheus-course-deploy-server 1 1 1 0 1d
==> v1/Pod(related)
NAME READY STATUS RESTARTS AGE
prometheus-course-deploy-node-exporter-2shl2 1/1 Running 0 1d
prometheus-course-deploy-node-exporter-fm6w8 1/1 Running 1 1d
prometheus-course-deploy-kube-state-metrics-5b676d5d87-9c2tw 1/1 Running 1 1d
prometheus-course-deploy-server-5748f5f975-dp52k 1/2 Running 186 1d
==> v1/ConfigMap
NAME DATA AGE
prometheus-course-deploy-server 3 1d
==> v1/ServiceAccount
NAME SECRETS AGE
prometheus-course-deploy-kube-state-metrics 1 1d
prometheus-course-deploy-node-exporter 1 1d
prometheus-course-deploy-server 1 1d
==> v1beta1/ClusterRoleBinding
NAME AGE
prometheus-course-deploy-kube-state-metrics 1d
prometheus-course-deploy-server 1d
==> v1/Service
NAME TYPE CLUSTER-IP EXTERNAL-IP PORT(S) AGE
prometheus-course-deploy-kube-state-metrics ClusterIP None <none> 80/TCP 1d
prometheus-course-deploy-node-exporter ClusterIP None <none> 9100/TCP 1d
prometheus-course-deploy-server NodePort 100.68.41.209 <none> 80:30186/TCP 1d
==> v1beta1/DaemonSet
NAME DESIRED CURRENT READY UP-TO-DATE AVAILABLE NODE SELECTOR AGE
prometheus-course-deploy-node-exporter 2 2 2 2 2 <none> 1d
NOTES:
The Prometheus server can be accessed via port 80 on the following DNS name from within your cluster:
prometheus-course-deploy-server.prometheus.svc.cluster.local
Get the Prometheus server URL by running these commands in the same shell:
export NODE_PORT=$(kubectl get --namespace prometheus -o jsonpath="{.spec.ports[0].nodePort}" services prometheus-course-deploy-server)
export NODE_IP=$(kubectl get nodes --namespace prometheus -o jsonpath="{.items[0].status.addresses[0].address}")
echo http://$NODE_IP:$NODE_PORT
For more information on running Prometheus, visit:
https://prometheus.io/
root@ubuntu-s-1vcpu-2gb-lon1-01:~/local_charts/prometheus_grafana#
- Check if the services are part of the ingress:
root@ubuntu-s-1vcpu-2gb-lon1-01:~/local_charts/prometheus_grafana# kubectl get ingress --all-namespaces
NAMESPACE NAME HOSTS ADDRESS PORTS AGE
doku dokuwiki-course-deploy-dokuwiki dokuwiki.course.devopsinuse.com 18.184.104.252 80 12m
prometheus grafana-course-deploy grafana.course.devopsinuse.com 18.184.104.252 80 12m
- The prometheus one was not included because the changes on the
prometheus/values.yamldocument must be done on theserver:tag. Modify the document again and deploy the changes.
root@ubuntu-s-1vcpu-2gb-lon1-01:~/local_charts/prometheus_grafana# vi prometheus/values.yaml
root@ubuntu-s-1vcpu-2gb-lon1-01:~/local_charts/prometheus_grafana# helmfile -f helmfile_specification_pg.yaml sync
exec: helm repo update --kube-context kops.peelmicro.com
Hang tight while we grab the latest from your chart repositories...
...Skip local chart repository
...Successfully got an update from the "incubator" chart repository
...Successfully got an update from the "stable" chart repository
Update Complete. ? Happy Helming!?
exec: helm upgrade --install --reset-values grafana-course-deploy stable/grafana --namespace prometheus --values /root/local_charts/prometheus_grafana/grafana/values.yaml --kube-context kops.peelmicro.com
exec: helm upgrade --install --reset-values prometheus-course-deploy stable/prometheus --namespace prometheus --values /root/local_charts/prometheus_grafana/prometheus/values.yaml --kube-context kops.peelmicro.com
exec: helm upgrade --install --reset-values dokuwiki-course-deploy stable/dokuwiki --namespace doku --values /root/local_charts/prometheus_grafana/dokuwiki/values.yaml --kube-context kops.peelmicro.com
exec: helm upgrade --install --reset-values nginx-course-deploy stable/nginx-ingress --namespace ingress --values /root/local_charts/prometheus_grafana/nginx-ingress/values.yaml --kube-context kops.peelmicro.com
Release "dokuwiki-course-deploy" has been upgraded. Happy Helming!
LAST DEPLOYED: Wed Mar 13 17:58:37 2019
NAMESPACE: doku
STATUS: DEPLOYED
RESOURCES:
==> v1beta1/Ingress
NAME HOSTS ADDRESS PORTS AGE
dokuwiki-course-deploy-dokuwiki dokuwiki.course.devopsinuse.com 18.184.104.252 80 16m
==> v1/Pod(related)
NAME READY STATUS RESTARTS AGE
dokuwiki-course-deploy-dokuwiki-b49bbcbf4-pvfhm 1/1 Running 1 12h
==> v1/Secret
NAME TYPE DATA AGE
dokuwiki-course-deploy-dokuwiki Opaque 1 12h
==> v1/PersistentVolumeClaim
NAME STATUS VOLUME CAPACITY ACCESS MODES STORAGECLASS AGE
dokuwiki-course-deploy-dokuwiki-apache Bound pvc-092a3755-4551-11e9-b1ba-023d0745758e 1Gi RWO gp2 12h
dokuwiki-course-deploy-dokuwiki-dokuwiki Bound pvc-092c5aad-4551-11e9-b1ba-023d0745758e 8Gi RWO gp2 12h
==> v1/Service
NAME TYPE CLUSTER-IP EXTERNAL-IP PORT(S) AGE
dokuwiki-course-deploy-dokuwiki NodePort 100.64.180.130 <none> 80:30830/TCP,443:31788/TCP 12h
==> v1beta1/Deployment
NAME DESIRED CURRENT UP-TO-DATE AVAILABLE AGE
dokuwiki-course-deploy-dokuwiki 1 1 1 1 12h
NOTES:
** Please be patient while the chart is being deployed **
1. Get the DokuWiki URL indicated on the Ingress Rule and associate it to your cluster external IP:
export CLUSTER_IP=$(minikube ip) # On Minikube. Use: `kubectl cluster-info` on others K8s clusters
export HOSTNAME=$(kubectl get ingress --namespace doku dokuwiki-course-deploy-dokuwiki -o jsonpath='{.spec.rules[0].host}')
echo "Dokuwiki URL: http://$HOSTNAME/"
echo "$CLUSTER_IP $HOSTNAME" | sudo tee -a /etc/hosts
2. Login with the following credentials
echo Username: admin
echo Password: $(kubectl get secret --namespace doku dokuwiki-course-deploy-dokuwiki -o jsonpath="{.data.dokuwiki-password}" | base64 --decode)
Release "nginx-course-deploy" has been upgraded. Happy Helming!
LAST DEPLOYED: Wed Mar 13 17:58:37 2019
NAMESPACE: ingress
STATUS: DEPLOYED
RESOURCES:
==> v1beta1/ClusterRole
NAME AGE
nginx-course-deploy-nginx-ingress 48m
==> v1beta1/Role
nginx-course-deploy-nginx-ingress 48m
==> v1beta1/Deployment
NAME DESIRED CURRENT UP-TO-DATE AVAILABLE AGE
nginx-course-deploy-nginx-ingress-controller 1 1 1 1 48m
nginx-course-deploy-nginx-ingress-default-backend 1 1 1 1 48m
==> v1/ConfigMap
NAME DATA AGE
nginx-course-deploy-nginx-ingress-controller 1 48m
==> v1/ServiceAccount
NAME SECRETS AGE
nginx-course-deploy-nginx-ingress 1 48m
==> v1beta1/ClusterRoleBinding
NAME AGE
nginx-course-deploy-nginx-ingress 48m
==> v1beta1/RoleBinding
NAME AGE
nginx-course-deploy-nginx-ingress 48m
==> v1/Service
NAME TYPE CLUSTER-IP EXTERNAL-IP PORT(S) AGE
nginx-course-deploy-nginx-ingress-controller LoadBalancer 100.68.166.91 ae3a20fc245b2... 80:31922/TCP,443:30284/TCP 48m
nginx-course-deploy-nginx-ingress-default-backend ClusterIP 100.64.200.87 <none> 80/TCP 48m
==> v1/Pod(related)
NAME READY STATUS RESTARTS AGE
nginx-course-deploy-nginx-ingress-controller-6f8469f787-rgbm9 1/1 Running 0 48m
nginx-course-deploy-nginx-ingress-default-backend-6d77776fjbsf6 1/1 Running 0 48m
NOTES:
The nginx-ingress controller has been installed.
It may take a few minutes for the LoadBalancer IP to be available.
You can watch the status by running 'kubectl --namespace ingress get services -o wide -w nginx-course-deploy-nginx-ingress-controller'
An example Ingress that makes use of the controller:
apiVersion: extensions/v1beta1
kind: Ingress
metadata:
annotations:
kubernetes.io/ingress.class: nginx
name: example
namespace: foo
spec:
rules:
- host: www.example.com
http:
paths:
- backend:
serviceName: exampleService
servicePort: 80
path: /
# This section is only required if TLS is to be enabled for the Ingress
tls:
- hosts:
- www.example.com
secretName: example-tls
If TLS is enabled for the Ingress, a Secret containing the certificate and key must also be provided:
apiVersion: v1
kind: Secret
metadata:
name: example-tls
namespace: foo
data:
tls.crt: <base64 encoded cert>
tls.key: <base64 encoded key>
type: kubernetes.io/tls
Release "grafana-course-deploy" has been upgraded. Happy Helming!
LAST DEPLOYED: Wed Mar 13 17:58:37 2019
NAMESPACE: prometheus
STATUS: DEPLOYED
RESOURCES:
==> v1/ConfigMap
NAME DATA AGE
grafana-course-deploy 1 1d
==> v1/ServiceAccount
NAME SECRETS AGE
grafana-course-deploy 1 1d
==> v1beta1/Role
NAME AGE
grafana-course-deploy 1d
==> v1/Service
NAME TYPE CLUSTER-IP EXTERNAL-IP PORT(S) AGE
grafana-course-deploy NodePort 100.69.248.75 <none> 80:30377/TCP 1d
==> v1beta1/Ingress
NAME HOSTS ADDRESS PORTS AGE
grafana-course-deploy grafana.course.devopsinuse.com 18.184.104.252 80 16m
==> v1beta1/PodSecurityPolicy
NAME DATA CAPS SELINUX RUNASUSER FSGROUP SUPGROUP READONLYROOTFS VOLUMES
grafana-course-deploy false RunAsAny RunAsAny RunAsAny RunAsAny false configMap,emptyDir,projected,secret,downwardAPI,persistentVolumeClaim
==> v1/Secret
NAME TYPE DATA AGE
grafana-course-deploy Opaque 3 1d
==> v1/ClusterRoleBinding
NAME AGE
grafana-course-deploy-clusterrolebinding 1d
==> v1beta1/RoleBinding
NAME AGE
grafana-course-deploy 1d
==> v1beta2/Deployment
NAME DESIRED CURRENT UP-TO-DATE AVAILABLE AGE
grafana-course-deploy 1 1 1 1 1d
==> v1/Pod(related)
NAME READY STATUS RESTARTS AGE
grafana-course-deploy-68c8968f9f-np9b9 1/1 Running 1 1d
==> v1/ClusterRole
NAME AGE
grafana-course-deploy-clusterrole 1d
NOTES:
1. Get your 'admin' user password by running:
kubectl get secret --namespace prometheus grafana-course-deploy -o jsonpath="{.data.admin-password}" | base64 --decode ; echo
2. The Grafana server can be accessed via port 80 on the following DNS name from within your cluster:
grafana-course-deploy.prometheus.svc.cluster.local
From outside the cluster, the server URL(s) are:
http://grafana.course.devopsinuse.com
3. Login with the password from step 1 and the username: admin
#################################################################################
###### WARNING: Persistence is disabled!!! You will lose your data when #####
###### the Grafana pod is terminated. #####
#################################################################################
Release "prometheus-course-deploy" has been upgraded. Happy Helming!
LAST DEPLOYED: Wed Mar 13 17:58:37 2019
NAMESPACE: prometheus
STATUS: DEPLOYED
RESOURCES:
==> v1/ConfigMap
NAME DATA AGE
prometheus-course-deploy-server 3 1d
==> v1beta1/ClusterRole
NAME AGE
prometheus-course-deploy-kube-state-metrics 1d
prometheus-course-deploy-server 1d
==> v1beta1/ClusterRoleBinding
NAME AGE
prometheus-course-deploy-kube-state-metrics 1d
prometheus-course-deploy-server 1d
==> v1/Service
NAME TYPE CLUSTER-IP EXTERNAL-IP PORT(S) AGE
prometheus-course-deploy-kube-state-metrics ClusterIP None <none> 80/TCP 1d
prometheus-course-deploy-node-exporter ClusterIP None <none> 9100/TCP 1d
prometheus-course-deploy-server NodePort 100.68.41.209 <none> 80:30186/TCP 1d
==> v1beta1/Ingress
NAME HOSTS ADDRESS PORTS AGE
prometheus-course-deploy-server prometheus.course.devopsinuse.com 80 2s
==> v1/Pod(related)
NAME READY STATUS RESTARTS AGE
prometheus-course-deploy-node-exporter-2shl2 1/1 Running 0 1d
prometheus-course-deploy-node-exporter-fm6w8 1/1 Running 1 1d
prometheus-course-deploy-kube-state-metrics-5b676d5d87-9c2tw 1/1 Running 1 1d
prometheus-course-deploy-server-5748f5f975-dp52k 1/2 CrashLoopBackOff 188 1d
==> v1/PersistentVolumeClaim
NAME STATUS VOLUME CAPACITY ACCESS MODES STORAGECLASS AGE
prometheus-course-deploy-server Bound pvc-79c6764f-4489-11e9-b1ba-023d0745758e 1Gi RWO gp2 1d
==> v1/ServiceAccount
NAME SECRETS AGE
prometheus-course-deploy-kube-state-metrics 1 1d
prometheus-course-deploy-node-exporter 1 1d
prometheus-course-deploy-server 1 1d
==> v1beta1/DaemonSet
NAME DESIRED CURRENT READY UP-TO-DATE AVAILABLE NODE SELECTOR AGE
prometheus-course-deploy-node-exporter 2 2 2 2 2 <none> 1d
==> v1beta1/Deployment
NAME DESIRED CURRENT UP-TO-DATE AVAILABLE AGE
prometheus-course-deploy-kube-state-metrics 1 1 1 1 1d
prometheus-course-deploy-server 1 1 1 0 1d
NOTES:
The Prometheus server can be accessed via port 80 on the following DNS name from within your cluster:
prometheus-course-deploy-server.prometheus.svc.cluster.local
From outside the cluster, the server URL(s) are:
http://prometheus.course.devopsinuse.com
For more information on running Prometheus, visit:
https://prometheus.io/
root@ubuntu-s-1vcpu-2gb-lon1-01:~/local_charts/prometheus_grafana#
- Ensure all the serviser are part of ingress:
root@ubuntu-s-1vcpu-2gb-lon1-01:~/local_charts/prometheus_grafana# kubectl get ingress --all-namespaces
NAMESPACE NAME HOSTS ADDRESS PORTS AGE
doku dokuwiki-course-deploy-dokuwiki dokuwiki.course.devopsinuse.com 18.184.104.252 80 17m
prometheus grafana-course-deploy grafana.course.devopsinuse.com 18.184.104.252 80 17m
prometheus prometheus-course-deploy-server prometheus.course.devopsinuse.com 18.184.104.252 80 55s
NAME READY STATUS RESTARTS AGE
pod/nginx-course-deploy-nginx-ingress-controller-6f8469f787-rgbm9 1/1 Running 0 50m
pod/nginx-course-deploy-nginx-ingress-default-backend-6d77776fjbsf6 1/1 Running 0 50m
NAME TYPE CLUSTER-IP EXTERNAL-IP PORT(S) AGE
service/nginx-course-deploy-nginx-ingress-controller LoadBalancer 100.68.166.91 ae3a20fc245b211e9b1ba023d0745758-1989208325.eu-central-1.elb.amazonaws.com 80:31922/TCP,443:30284/TCP 50m
service/nginx-course-deploy-nginx-ingress-default-backend ClusterIP 100.64.200.87 <none> 80/TCP 50m
root@ubuntu-s-1vcpu-2gb-lon1-01:~/local_charts/prometheus_grafana# kubectl logs pod/nginx-course-deploy-nginx-ingress-controller-6f8469f787-rgbm9 -n ingress
-------------------------------------------------------------------------------
NGINX Ingress controller
Release: 0.22.0
Build: git-f7c42b78a
Repository: https://github.com/kubernetes/ingress-nginx
-------------------------------------------------------------------------------
I0313 17:11:46.484564 5 flags.go:183] Watching for Ingress class: nginx
W0313 17:11:46.485173 5 flags.go:216] SSL certificate chain completion is disabled (--enable-ssl-chain-completion=false)
nginx version: nginx/1.15.8
W0313 17:11:46.502613 5 client_config.go:548] Neither --kubeconfig nor --master was specified. Using the inClusterConfig. This might not work.
I0313 17:11:46.502921 5 main.go:200] Creating API client for https://100.64.0.1:443
I0313 17:11:46.515798 5 main.go:244] Running in Kubernetes cluster version v1.10 (v1.10.12) - git (clean) commit c757b93cf034d49af3a3b8ecee3b9639a7a11df7 - platform linux/amd64
I0313 17:11:46.521010 5 main.go:102] Validated ingress/nginx-course-deploy-nginx-ingress-default-backend as the default backend.
I0313 17:11:47.046907 5 nginx.go:267] Starting NGINX Ingress controller
I0313 17:11:47.097103 5 event.go:221] Event(v1.ObjectReference{Kind:"ConfigMap", Namespace:"ingress", Name:"nginx-course-deploy-nginx-ingress-controller", UID:"e38e83d7-45b2-11e9-b1ba-023d0745758e", APIVersion:"v1", ResourceVersion:"501446", FieldPath:""}): type: 'Normal' reason: 'CREATE' ConfigMap ingress/nginx-course-deploy-nginx-ingress-controller
I0313 17:11:48.248244 5 nginx.go:288] Starting NGINX process
I0313 17:11:48.249052 5 leaderelection.go:205] attempting to acquire leader lease ingress/ingress-controller-leader-nginx...
I0313 17:11:48.250409 5 controller.go:172] Configuration changes detected, backend reload required.
I0313 17:11:48.258905 5 leaderelection.go:214] successfully acquired lease ingress/ingress-controller-leader-nginx
I0313 17:11:48.259455 5 status.go:148] new leader elected: nginx-course-deploy-nginx-ingress-controller-6f8469f787-rgbm9
I0313 17:11:48.504066 5 controller.go:190] Backend successfully reloaded.
I0313 17:11:48.504236 5 controller.go:202] Initial sync, sleeping for 1 second.
[13/Mar/2019:17:11:49 +0000]TCP200000.001
I0313 17:42:26.541387 5 controller.go:172] Configuration changes detected, backend reload required.
I0313 17:42:26.544580 5 event.go:221] Event(v1.ObjectReference{Kind:"Ingress", Namespace:"prometheus", Name:"grafana-course-deploy", UID:"5db8691c-45b7-11e9-b1ba-023d0745758e", APIVersion:"extensions/v1beta1", ResourceVersion:"504266", FieldPath:""}): type: 'Normal' reason: 'CREATE' Ingress prometheus/grafana-course-deploy
I0313 17:42:26.716760 5 controller.go:190] Backend successfully reloaded.
[13/Mar/2019:17:42:26 +0000]TCP200000.000
I0313 17:42:26.736902 5 event.go:221] Event(v1.ObjectReference{Kind:"Ingress", Namespace:"doku", Name:"dokuwiki-course-deploy-dokuwiki", UID:"5dd8721b-45b7-11e9-b1ba-023d0745758e", APIVersion:"extensions/v1beta1", ResourceVersion:"504269", FieldPath:""}): type: 'Normal' reason: 'CREATE' Ingress doku/dokuwiki-course-deploy-dokuwiki
I0313 17:42:29.874933 5 controller.go:172] Configuration changes detected, backend reload required.
I0313 17:42:30.011735 5 controller.go:190] Backend successfully reloaded.
[13/Mar/2019:17:42:30 +0000]TCP200000.000
I0313 17:42:48.271746 5 status.go:388] updating Ingress doku/dokuwiki-course-deploy-dokuwiki status from [] to [{18.184.104.252 }]
I0313 17:42:48.273236 5 status.go:388] updating Ingress prometheus/grafana-course-deploy status from [] to [{18.184.104.252 }]
I0313 17:42:48.279388 5 event.go:221] Event(v1.ObjectReference{Kind:"Ingress", Namespace:"doku", Name:"dokuwiki-course-deploy-dokuwiki", UID:"5dd8721b-45b7-11e9-b1ba-023d0745758e", APIVersion:"extensions/v1beta1", ResourceVersion:"504318", FieldPath:""}): type: 'Normal' reason: 'UPDATE' Ingress doku/dokuwiki-course-deploy-dokuwiki
I0313 17:42:48.282766 5 event.go:221] Event(v1.ObjectReference{Kind:"Ingress", Namespace:"prometheus", Name:"grafana-course-deploy", UID:"5db8691c-45b7-11e9-b1ba-023d0745758e", APIVersion:"extensions/v1beta1", ResourceVersion:"504319", FieldPath:""}): type: 'Normal' reason: 'UPDATE' Ingress prometheus/grafana-course-deploy
W0313 17:58:38.166379 5 controller.go:842] Service "prometheus/prometheus-course-deploy-server" does not have any active Endpoint.
I0313 17:58:38.166540 5 controller.go:172] Configuration changes detected, backend reload required.
I0313 17:58:38.171179 5 event.go:221] Event(v1.ObjectReference{Kind:"Ingress", Namespace:"prometheus", Name:"prometheus-course-deploy-server", UID:"a0dc7a65-45b9-11e9-b1ba-023d0745758e", APIVersion:"extensions/v1beta1", ResourceVersion:"505695", FieldPath:""}): type: 'Normal' reason: 'CREATE' Ingress prometheus/prometheus-course-deploy-server
I0313 17:58:38.319705 5 controller.go:190] Backend successfully reloaded.
[13/Mar/2019:17:58:38 +0000]TCP200000.000
I0313 17:58:48.267649 5 status.go:388] updating Ingress prometheus/prometheus-course-deploy-server status from [] to [{18.184.104.252 }]
W0313 17:58:48.272440 5 controller.go:842] Service "prometheus/prometheus-course-deploy-server" does not have any active Endpoint.
I0313 17:58:48.272911 5 event.go:221] Event(v1.ObjectReference{Kind:"Ingress", Namespace:"prometheus", Name:"prometheus-course-deploy-server", UID:"a0dc7a65-45b9-11e9-b1ba-023d0745758e", APIVersion:"extensions/v1beta1", ResourceVersion:"505718", FieldPath:""}): type: 'Normal' reason: 'UPDATE' Ingress prometheus/prometheus-course-deploy-server
root@ubuntu-s-1vcpu-2gb-lon1-01:~/local_charts/prometheus_grafana#
- Browse again to http://ae3a20fc245b211e9b1ba023d0745758-1989208325.eu-central-1.elb.amazonaws.com/

- Go to
Route 53service
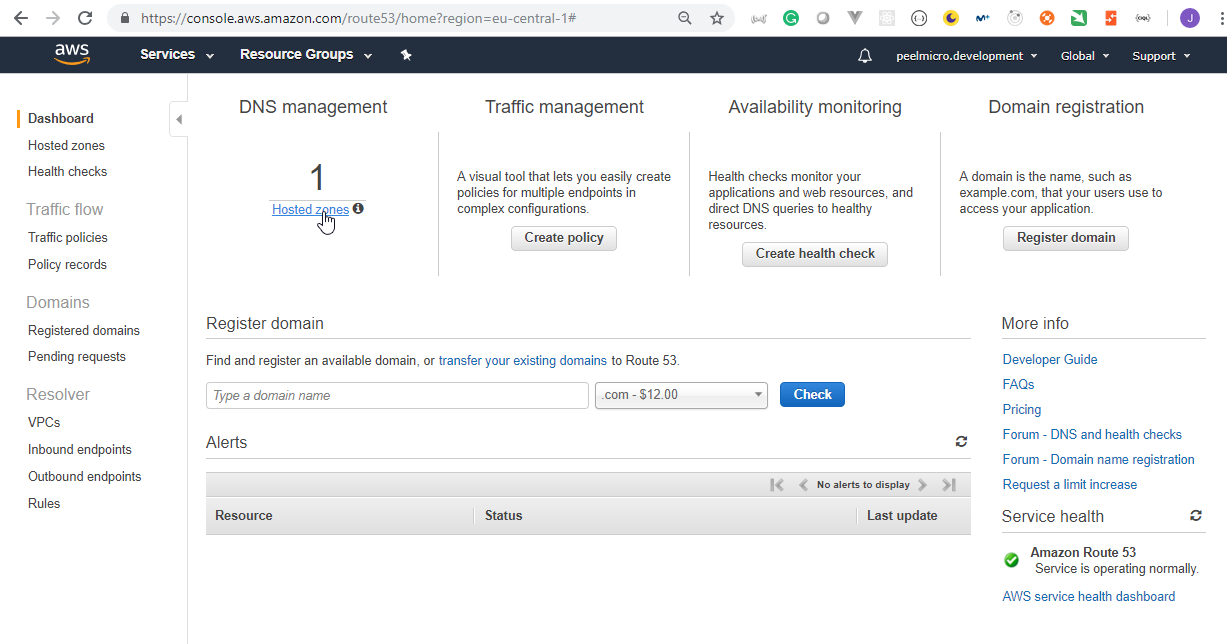
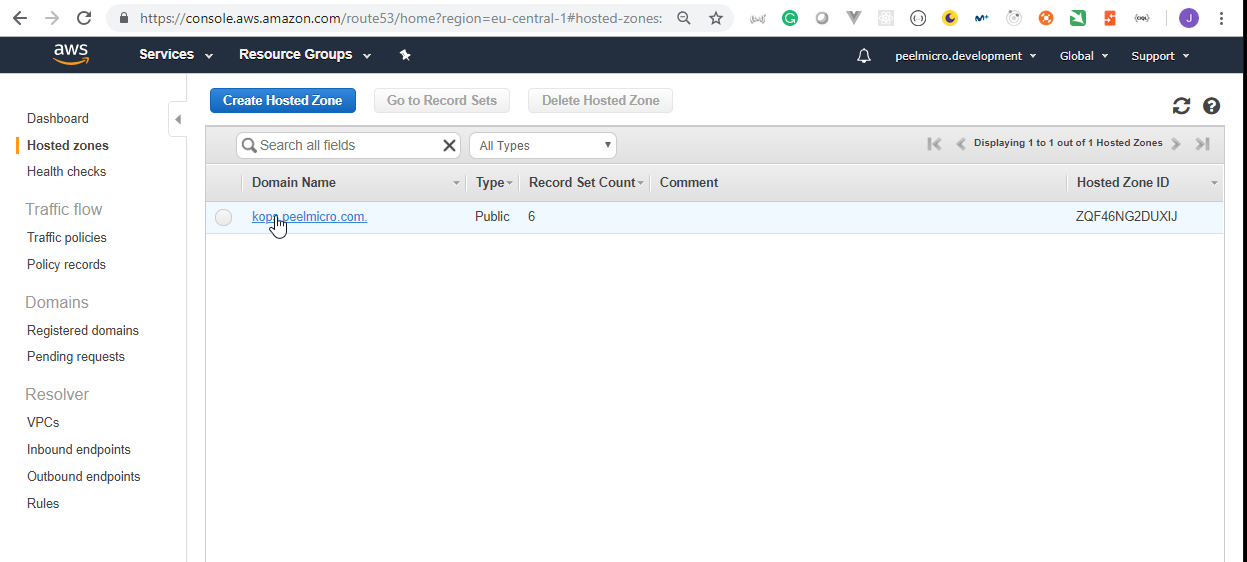
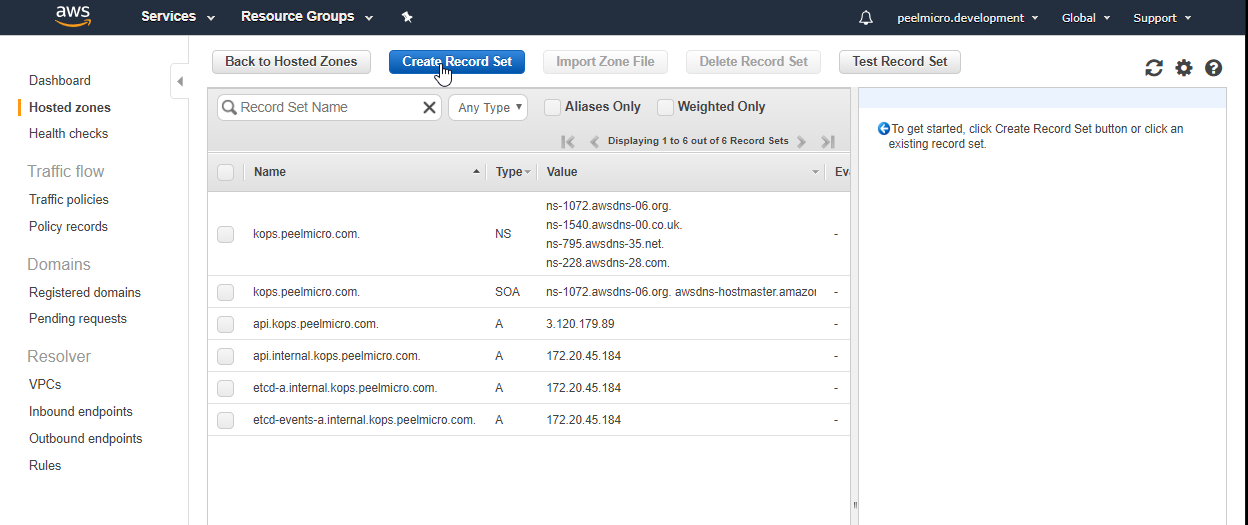
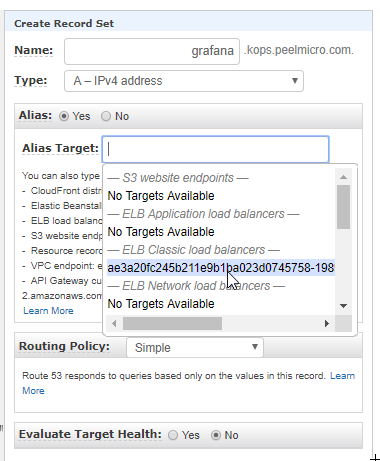
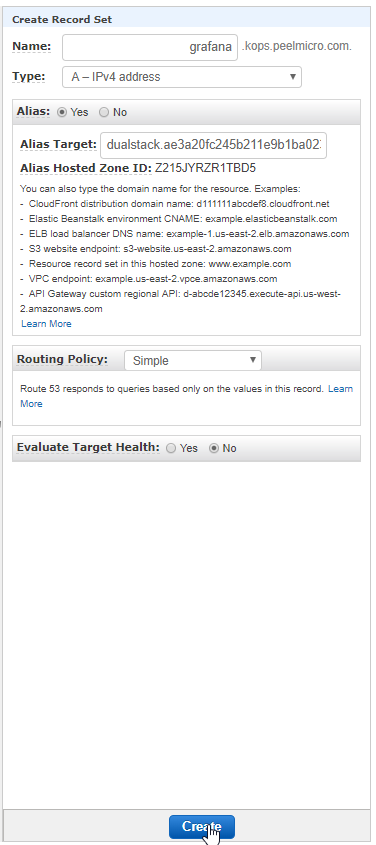
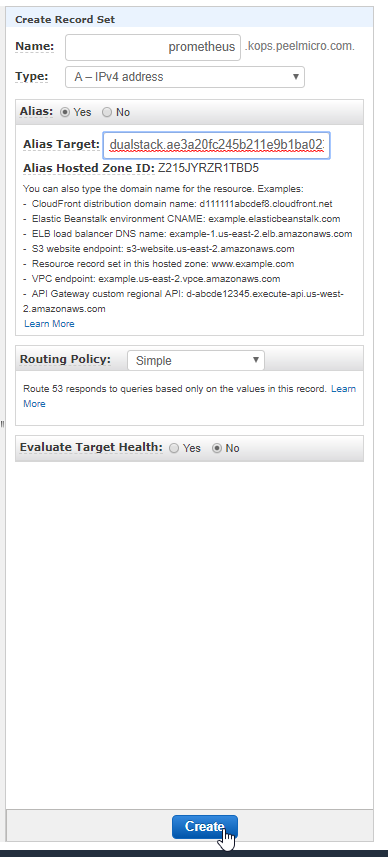
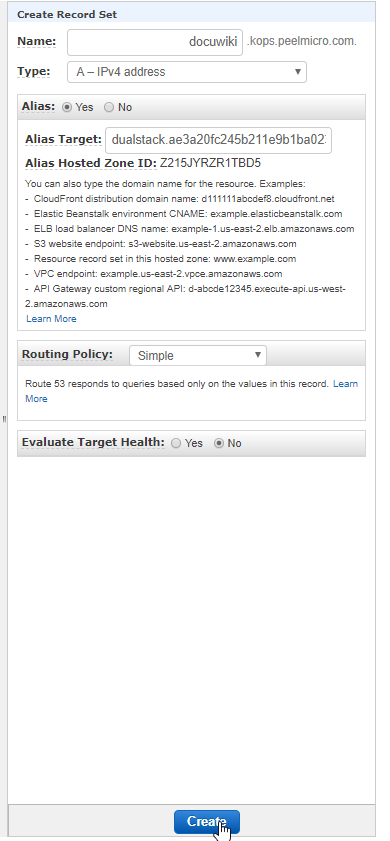
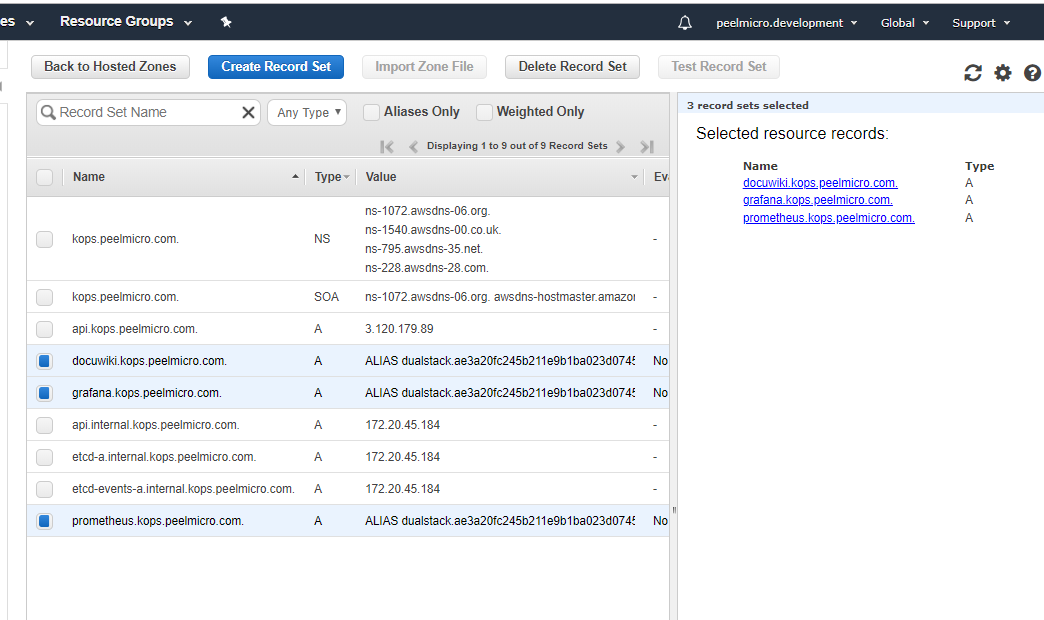

It is not working because the ingress host names should be .kops.peelmicro.com instead of .couse.devopsinuse.com. Change the values.yaml files and deploy again.
root@ubuntu-s-1vcpu-2gb-lon1-01:~/local_charts/prometheus_grafana# vi prometheus/values.yaml
root@ubuntu-s-1vcpu-2gb-lon1-01:~/local_charts/prometheus_grafana# vi dokuwiki/values.yaml
root@ubuntu-s-1vcpu-2gb-lon1-01:~/local_charts/prometheus_grafana# vi grafana/values.yaml
root@ubuntu-s-1vcpu-2gb-lon1-01:~/local_charts/prometheus_grafana# helmfile -f helmfile_specification_pg.yaml sync
exec: helm repo update --kube-context kops.peelmicro.com
Hang tight while we grab the latest from your chart repositories...
...Skip local chart repository
...Successfully got an update from the "incubator" chart repository
...Successfully got an update from the "stable" chart repository
Update Complete. ? Happy Helming!?
exec: helm upgrade --install --reset-values grafana-course-deploy stable/grafana --namespace prometheus --values /root/local_charts/prometheus_grafana/grafana/values.yaml --kube-context kops.peelmicro.com
exec: helm upgrade --install --reset-values prometheus-course-deploy stable/prometheus --namespace prometheus --values /root/local_charts/prometheus_grafana/prometheus/values.yaml --kube-context kops.peelmicro.com
exec: helm upgrade --install --reset-values dokuwiki-course-deploy stable/dokuwiki --namespace doku --values /root/local_charts/prometheus_grafana/dokuwiki/values.yaml --kube-context kops.peelmicro.com
exec: helm upgrade --install --reset-values nginx-course-deploy stable/nginx-ingress --namespace ingress --values /root/local_charts/prometheus_grafana/nginx-ingress/values.yaml --kube-context kops.peelmicro.com
Release "dokuwiki-course-deploy" has been upgraded. Happy Helming!
LAST DEPLOYED: Wed Mar 13 18:27:33 2019
NAMESPACE: doku
STATUS: DEPLOYED
RESOURCES:
==> v1beta1/Deployment
NAME DESIRED CURRENT UP-TO-DATE AVAILABLE AGE
dokuwiki-course-deploy-dokuwiki 1 1 1 1 12h
==> v1beta1/Ingress
NAME HOSTS ADDRESS PORTS AGE
dokuwiki-course-deploy-dokuwiki dokuwiki.kops.peelmicro.com 18.184.104.252 80 45m
==> v1/Pod(related)
NAME READY STATUS RESTARTS AGE
dokuwiki-course-deploy-dokuwiki-b49bbcbf4-pvfhm 1/1 Running 1 12h
==> v1/Secret
NAME TYPE DATA AGE
dokuwiki-course-deploy-dokuwiki Opaque 1 12h
==> v1/PersistentVolumeClaim
NAME STATUS VOLUME CAPACITY ACCESS MODES STORAGECLASS AGE
dokuwiki-course-deploy-dokuwiki-apache Bound pvc-092a3755-4551-11e9-b1ba-023d0745758e 1Gi RWO gp2 12h
dokuwiki-course-deploy-dokuwiki-dokuwiki Bound pvc-092c5aad-4551-11e9-b1ba-023d0745758e 8Gi RWO gp2 12h
==> v1/Service
NAME TYPE CLUSTER-IP EXTERNAL-IP PORT(S) AGE
dokuwiki-course-deploy-dokuwiki NodePort 100.64.180.130 <none> 80:30830/TCP,443:31788/TCP 12h
NOTES:
** Please be patient while the chart is being deployed **
1. Get the DokuWiki URL indicated on the Ingress Rule and associate it to your cluster external IP:
export CLUSTER_IP=$(minikube ip) # On Minikube. Use: `kubectl cluster-info` on others K8s clusters
export HOSTNAME=$(kubectl get ingress --namespace doku dokuwiki-course-deploy-dokuwiki -o jsonpath='{.spec.rules[0].host}')
echo "Dokuwiki URL: http://$HOSTNAME/"
echo "$CLUSTER_IP $HOSTNAME" | sudo tee -a /etc/hosts
2. Login with the following credentials
echo Username: admin
echo Password: $(kubectl get secret --namespace doku dokuwiki-course-deploy-dokuwiki -o jsonpath="{.data.dokuwiki-password}" | base64 --decode)
Release "nginx-course-deploy" has been upgraded. Happy Helming!
LAST DEPLOYED: Wed Mar 13 18:27:33 2019
NAMESPACE: ingress
STATUS: DEPLOYED
RESOURCES:
==> v1/ConfigMap
NAME DATA AGE
nginx-course-deploy-nginx-ingress-controller 1 1h
==> v1beta1/ClusterRole
NAME AGE
nginx-course-deploy-nginx-ingress 1h
==> v1beta1/ClusterRoleBinding
NAME AGE
nginx-course-deploy-nginx-ingress 1h
==> v1beta1/Role
NAME AGE
nginx-course-deploy-nginx-ingress 1h
==> v1beta1/RoleBinding
NAME AGE
nginx-course-deploy-nginx-ingress 1h
==> v1beta1/Deployment
NAME DESIRED CURRENT UP-TO-DATE AVAILABLE AGE
nginx-course-deploy-nginx-ingress-controller 1 1 1 1 1h
nginx-course-deploy-nginx-ingress-default-backend 1 1 1 1 1h
==> v1/ServiceAccount
NAME SECRETS AGE
nginx-course-deploy-nginx-ingress 1 1h
==> v1/Service
NAME TYPE CLUSTER-IP EXTERNAL-IP PORT(S) AGE
nginx-course-deploy-nginx-ingress-controller LoadBalancer 100.68.166.91 ae3a20fc245b2... 80:31922/TCP,443:30284/TCP 1h
nginx-course-deploy-nginx-ingress-default-backend ClusterIP 100.64.200.87 <none> 80/TCP 1h
==> v1/Pod(related)
NAME READY STATUS RESTARTS AGE
nginx-course-deploy-nginx-ingress-controller-6f8469f787-rgbm9 1/1 Running 0 1h
nginx-course-deploy-nginx-ingress-default-backend-6d77776fjbsf6 1/1 Running 0 1h
NOTES:
The nginx-ingress controller has been installed.
It may take a few minutes for the LoadBalancer IP to be available.
You can watch the status by running 'kubectl --namespace ingress get services -o wide -w nginx-course-deploy-nginx-ingress-controller'
An example Ingress that makes use of the controller:
apiVersion: extensions/v1beta1
kind: Ingress
metadata:
annotations:
kubernetes.io/ingress.class: nginx
name: example
namespace: foo
spec:
rules:
- host: www.example.com
http:
paths:
- backend:
serviceName: exampleService
servicePort: 80
path: /
# This section is only required if TLS is to be enabled for the Ingress
tls:
- hosts:
- www.example.com
secretName: example-tls
If TLS is enabled for the Ingress, a Secret containing the certificate and key must also be provided:
apiVersion: v1
kind: Secret
metadata:
name: example-tls
namespace: foo
data:
tls.crt: <base64 encoded cert>
tls.key: <base64 encoded key>
type: kubernetes.io/tls
Release "grafana-course-deploy" has been upgraded. Happy Helming!
LAST DEPLOYED: Wed Mar 13 18:27:33 2019
NAMESPACE: prometheus
STATUS: DEPLOYED
RESOURCES:
==> v1beta2/Deployment
NAME DESIRED CURRENT UP-TO-DATE AVAILABLE AGE
grafana-course-deploy 1 1 1 1 1d
==> v1/ConfigMap
NAME DATA AGE
grafana-course-deploy 1 1d
==> v1/ClusterRoleBinding
NAME AGE
grafana-course-deploy-clusterrolebinding 1d
==> v1beta1/Role
NAME AGE
grafana-course-deploy 1d
==> v1/Service
NAME TYPE CLUSTER-IP EXTERNAL-IP PORT(S) AGE
grafana-course-deploy NodePort 100.69.248.75 <none> 80:30377/TCP 1d
==> v1beta1/Ingress
NAME HOSTS ADDRESS PORTS AGE
grafana-course-deploy grafana.kops.peelmicro.com 18.184.104.252 80 45m
==> v1beta1/PodSecurityPolicy
NAME DATA CAPS SELINUX RUNASUSER FSGROUP SUPGROUP READONLYROOTFS VOLUMES
grafana-course-deploy false RunAsAny RunAsAny RunAsAny RunAsAny false configMap,emptyDir,projected,secret,downwardAPI,persistentVolumeClaim
==> v1/Pod(related)
NAME READY STATUS RESTARTS AGE
grafana-course-deploy-68c8968f9f-np9b9 1/1 Running 1 1d
==> v1/Secret
NAME TYPE DATA AGE
grafana-course-deploy Opaque 3 1d
==> v1/ServiceAccount
NAME SECRETS AGE
grafana-course-deploy 1 1d
==> v1/ClusterRole
NAME AGE
grafana-course-deploy-clusterrole 1d
==> v1beta1/RoleBinding
NAME AGE
grafana-course-deploy 1d
NOTES:
1. Get your 'admin' user password by running:
kubectl get secret --namespace prometheus grafana-course-deploy -o jsonpath="{.data.admin-password}" | base64 --decode ; echo
2. The Grafana server can be accessed via port 80 on the following DNS name from within your cluster:
grafana-course-deploy.prometheus.svc.cluster.local
From outside the cluster, the server URL(s) are:
http://grafana.kops.peelmicro.com
3. Login with the password from step 1 and the username: admin
#################################################################################
###### WARNING: Persistence is disabled!!! You will lose your data when #####
###### the Grafana pod is terminated. #####
#################################################################################
Release "prometheus-course-deploy" has been upgraded. Happy Helming!
LAST DEPLOYED: Wed Mar 13 18:27:33 2019
NAMESPACE: prometheus
STATUS: DEPLOYED
RESOURCES:
==> v1/ServiceAccount
NAME SECRETS AGE
prometheus-course-deploy-kube-state-metrics 1 1d
prometheus-course-deploy-node-exporter 1 1d
prometheus-course-deploy-server 1 1d
==> v1beta1/DaemonSet
NAME DESIRED CURRENT READY UP-TO-DATE AVAILABLE NODE SELECTOR AGE
prometheus-course-deploy-node-exporter 2 2 2 2 2 <none> 1d
==> v1beta1/Ingress
NAME HOSTS ADDRESS PORTS AGE
prometheus-course-deploy-server prometheus.kops.peelmicro.com 18.184.104.252 80 28m
==> v1/Service
NAME TYPE CLUSTER-IP EXTERNAL-IP PORT(S) AGE
prometheus-course-deploy-kube-state-metrics ClusterIP None <none> 80/TCP 1d
prometheus-course-deploy-node-exporter ClusterIP None <none> 9100/TCP 1d
prometheus-course-deploy-server NodePort 100.68.41.209 <none> 80:30186/TCP 1d
==> v1beta1/Deployment
NAME DESIRED CURRENT UP-TO-DATE AVAILABLE AGE
prometheus-course-deploy-kube-state-metrics 1 1 1 1 1d
prometheus-course-deploy-server 1 1 1 0 1d
==> v1/Pod(related)
NAME READY STATUS RESTARTS AGE
prometheus-course-deploy-node-exporter-2shl2 1/1 Running 0 1d
prometheus-course-deploy-node-exporter-fm6w8 1/1 Running 1 1d
prometheus-course-deploy-kube-state-metrics-5b676d5d87-9c2tw 1/1 Running 1 1d
prometheus-course-deploy-server-5748f5f975-dp52k 1/2 CrashLoopBackOff 194 1d
==> v1/ConfigMap
NAME DATA AGE
prometheus-course-deploy-server 3 1d
==> v1/PersistentVolumeClaim
NAME STATUS VOLUME CAPACITY ACCESS MODES STORAGECLASS AGE
prometheus-course-deploy-server Bound pvc-79c6764f-4489-11e9-b1ba-023d0745758e 1Gi RWO gp2 1d
==> v1beta1/ClusterRole
NAME AGE
prometheus-course-deploy-kube-state-metrics 1d
prometheus-course-deploy-server 1d
==> v1beta1/ClusterRoleBinding
NAME AGE
prometheus-course-deploy-kube-state-metrics 1d
prometheus-course-deploy-server 1d
NOTES:
The Prometheus server can be accessed via port 80 on the following DNS name from within your cluster:
prometheus-course-deploy-server.prometheus.svc.cluster.local
From outside the cluster, the server URL(s) are:
http://prometheus.kops.peelmicro.com
For more information on running Prometheus, visit:
https://prometheus.io/
root@ubuntu-s-1vcpu-2gb-lon1-01:~/local_charts/prometheus_grafana#
root@ubuntu-s-1vcpu-2gb-lon1-01:~/local_charts/prometheus_grafana# kubectl get ingress --all-namespaces
NAMESPACE NAME HOSTS ADDRESS PORTS AGE
doku dokuwiki-course-deploy-dokuwiki dokuwiki.kops.peelmicro.com 18.184.104.252 80 45m
prometheus grafana-course-deploy grafana.kops.peelmicro.com 18.184.104.252 80 45m
prometheus prometheus-course-deploy-server prometheus.kops.peelmicro.com 18.184.104.252 80 29m
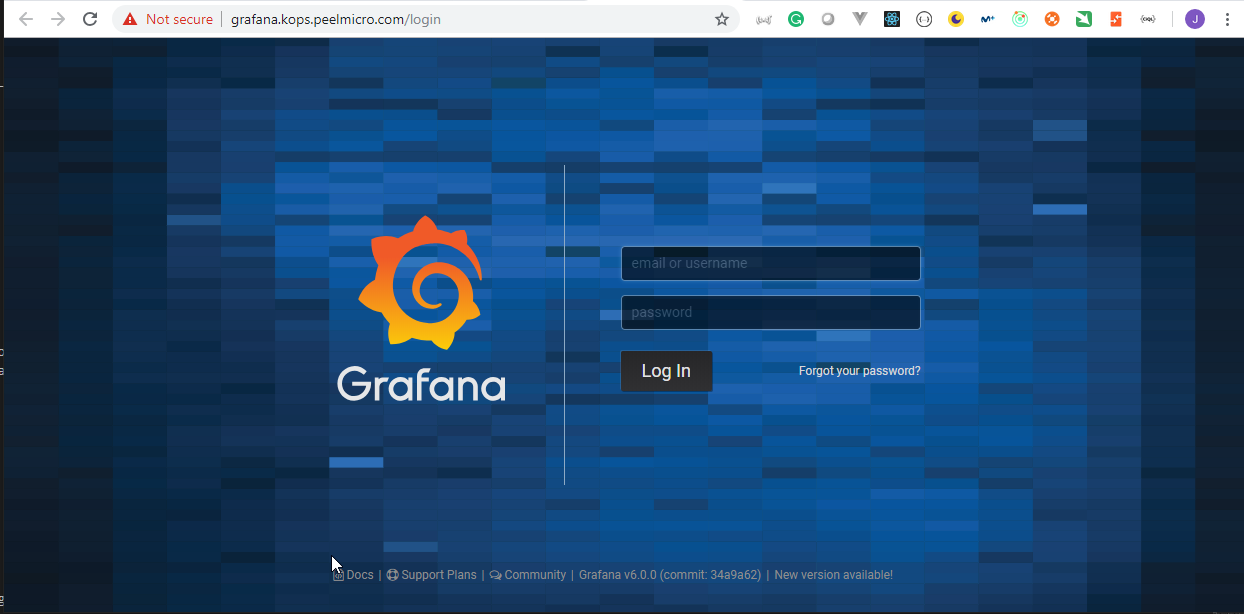
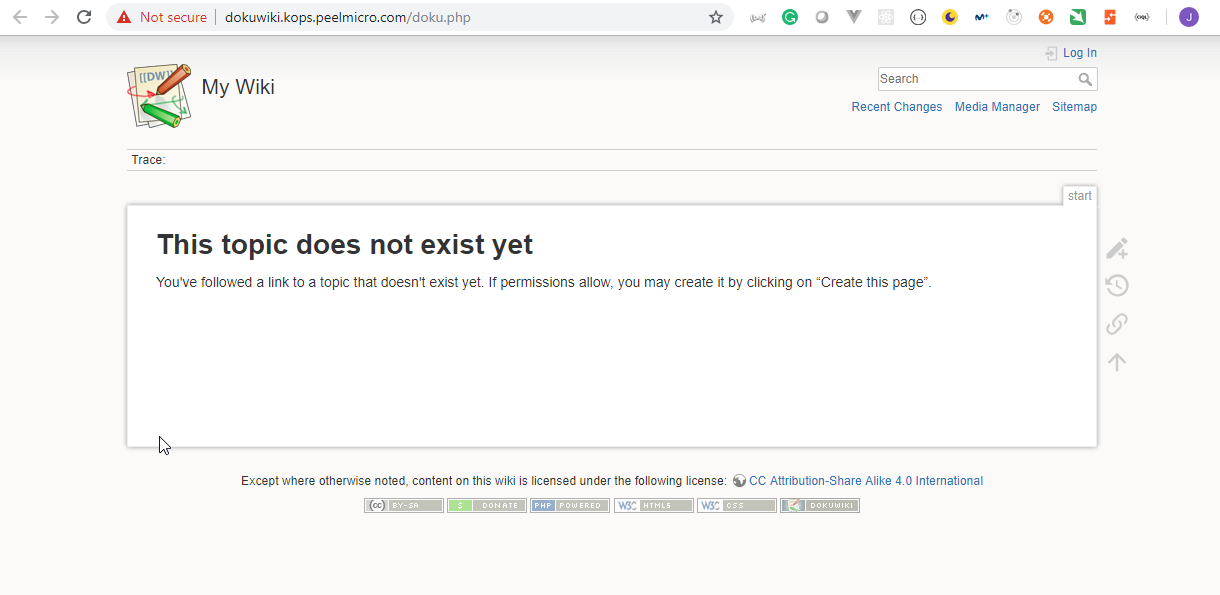
root@ubuntu-s-1vcpu-2gb-lon1-01:~/local_charts/prometheus_grafana# kubectl get pods,svc -n prometheus
NAME READY STATUS RESTARTS AGE
pod/grafana-course-deploy-68c8968f9f-np9b9 1/1 Running 1 1d
pod/prometheus-course-deploy-kube-state-metrics-5b676d5d87-9c2tw 1/1 Running 1 1d
pod/prometheus-course-deploy-node-exporter-2shl2 1/1 Running 0 1d
pod/prometheus-course-deploy-node-exporter-fm6w8 1/1 Running 1 1d
pod/prometheus-course-deploy-server-5748f5f975-dp52k 1/2 CrashLoopBackOff 195 1d
NAME TYPE CLUSTER-IP EXTERNAL-IP PORT(S) AGE
service/grafana-course-deploy NodePort 100.69.248.75 <none> 80:30377/TCP 1d
service/prometheus-course-deploy-kube-state-metrics ClusterIP None <none> 80/TCP 1d
service/prometheus-course-deploy-node-exporter ClusterIP None <none> 9100/TCP 1d
One of the instances for
prometheus-course-deploy-server-5748f5f975-dp52kis not working1/2 CrashLoopBackOff. That's why the reason for the error.We can find more information about the error on What is a CrashLoopBackOff? How to alert, debug / troubleshoot, and fix Kubernetes CrashLoopBackOff events.
root@ubuntu-s-1vcpu-2gb-lon1-01:~/local_charts/prometheus_grafana# kubectl describe pod prometheus-course-deploy-server-5748f5f975-dp52k -n prometheus
Name: prometheus-course-deploy-server-5748f5f975-dp52k
Namespace: prometheus
Node: ip-172-20-56-4.eu-central-1.compute.internal/172.20.56.4
Start Time: Tue, 12 Mar 2019 05:41:27 +0000
Labels: app=prometheus
chart=prometheus-8.8.1
component=server
heritage=Tiller
pod-template-hash=1304919531
release=prometheus-course-deploy
Annotations: <none>
Status: Running
IP: 100.96.2.21
Controlled By: ReplicaSet/prometheus-course-deploy-server-5748f5f975
Init Containers:
init-chown-data:
Container ID: docker://8fd07ca55071b769cc2a1b8ba92bd46cd4b04b5a92b5792eb92c8fa568d2f252
Image: busybox:latest
Image ID: docker-pullable://busybox@sha256:061ca9704a714ee3e8b80523ec720c64f6209ad3f97c0ff7cb9ec7d19f15149f
Port: <none>
Host Port: <none>
Command:
chown
-R
65534:65534
/data
State: Terminated
Reason: Completed
Exit Code: 0
Started: Wed, 13 Mar 2019 05:43:37 +0000
Finished: Wed, 13 Mar 2019 05:43:37 +0000
Ready: True
Restart Count: 1
Environment: <none>
Mounts:
/data from storage-volume (rw)
/var/run/secrets/kubernetes.io/serviceaccount from prometheus-course-deploy-server-token-jhrvj (ro)
Containers:
prometheus-server-configmap-reload:
Container ID: docker://a22d0ce767f50e77b484c8d862d7e42fac58b8cd9050795938ac075189cc6a4d
Image: jimmidyson/configmap-reload:v0.2.2
Image ID: docker-pullable://jimmidyson/configmap-reload@sha256:befec9f23d2a9da86a298d448cc9140f56a457362a7d9eecddba192db1ab489e
Port: <none>
Host Port: <none>
Args:
--volume-dir=/etc/config
--webhook-url=http://127.0.0.1:9090/-/reload
State: Running
Started: Wed, 13 Mar 2019 05:43:37 +0000
Last State: Terminated
Reason: Error
Exit Code: 2
Started: Tue, 12 Mar 2019 05:41:47 +0000
Finished: Wed, 13 Mar 2019 05:43:30 +0000
Ready: True
Restart Count: 1
Environment: <none>
Mounts:
/etc/config from config-volume (ro)
/var/run/secrets/kubernetes.io/serviceaccount from prometheus-course-deploy-server-token-jhrvj (ro)
prometheus-server:
Container ID: docker://9ba97a54b2a1525d2c229829c256d706120837ff282c3b70780c8760e316e938
Image: prom/prometheus:v2.7.2
Image ID: docker-pullable://prom/prometheus@sha256:33ff3dcfbae0454ceb403fd6a6e38583f5a5df271a14fea1defbbb6d699ef14e
Port: 9090/TCP
Host Port: 0/TCP
Args:
--config.file=/etc/config/prometheus.yml
--storage.tsdb.path=/data
--web.console.libraries=/etc/prometheus/console_libraries
--web.console.templates=/etc/prometheus/consoles
--web.enable-lifecycle
State: Waiting
Reason: CrashLoopBackOff
Last State: Terminated
Reason: Error
Exit Code: 2
Started: Wed, 13 Mar 2019 18:37:52 +0000
Finished: Wed, 13 Mar 2019 18:38:12 +0000
Ready: False
Restart Count: 195
Liveness: http-get http://:9090/-/healthy delay=30s timeout=30s period=10s #success=1 #failure=3
Readiness: http-get http://:9090/-/ready delay=30s timeout=30s period=10s #success=1 #failure=3
Environment: <none>
Mounts:
/data from storage-volume (rw)
/etc/config from config-volume (rw)
/var/run/secrets/kubernetes.io/serviceaccount from prometheus-course-deploy-server-token-jhrvj (ro)
Conditions:
Type Status
Initialized True
Ready False
PodScheduled True
Volumes:
config-volume:
Type: ConfigMap (a volume populated by a ConfigMap)
Name: prometheus-course-deploy-server
Optional: false
storage-volume:
Type: PersistentVolumeClaim (a reference to a PersistentVolumeClaim in the same namespace)
ClaimName: prometheus-course-deploy-server
ReadOnly: false
prometheus-course-deploy-server-token-jhrvj:
Type: Secret (a volume populated by a Secret)
SecretName: prometheus-course-deploy-server-token-jhrvj
Optional: false
QoS Class: BestEffort
Node-Selectors: <none>
Tolerations: node.kubernetes.io/not-ready:NoExecute for 300s
node.kubernetes.io/unreachable:NoExecute for 300s
Events:
Type Reason Age From Message
---- ------ ---- ---- -------
Warning BackOff 3m14s (x4471 over 17h) kubelet, ip-172-20-56-4.eu-central-1.compute.internal Back-off restarting failed container
root@ubuntu-s-1vcpu-2gb-lon1-01:~/local_charts/prometheus_grafana#
root@ubuntu-s-1vcpu-2gb-lon1-01:~/local_charts/prometheus_grafana# kubectl delete pod prometheus-course-deploy-server-5748f5f975-dp52k -n prometheus
pod "prometheus-course-deploy-server-5748f5f975-dp52k" deleted
root@ubuntu-s-1vcpu-2gb-lon1-01:~/local_charts/prometheus_grafana#
root@ubuntu-s-1vcpu-2gb-lon1-01:~/local_charts/prometheus_grafana# kubectl get pods,svc -n prometheus
NAME READY STATUS RESTARTS AGE
pod/grafana-course-deploy-68c8968f9f-np9b9 1/1 Running 1 1d
pod/prometheus-course-deploy-kube-state-metrics-5b676d5d87-9c2tw 1/1 Running 1 1d
pod/prometheus-course-deploy-node-exporter-2shl2 1/1 Running 0 1d
pod/prometheus-course-deploy-node-exporter-fm6w8 1/1 Running 1 1d
pod/prometheus-course-deploy-server-5748f5f975-rpx5x 1/2 Running 1 39s
NAME TYPE CLUSTER-IP EXTERNAL-IP PORT(S) AGE
service/grafana-course-deploy NodePort 100.69.248.75 <none> 80:30377/TCP 1d
service/prometheus-course-deploy-kube-state-metrics ClusterIP None <none> 80/TCP 1d
service/prometheus-course-deploy-node-exporter ClusterIP None <none> 9100/TCP 1d
service/prometheus-course-deploy-server NodePort 100.68.41.209 <none> 80:30186/TCP 1d
- Access the ingress controller pod
NAME READY STATUS RESTARTS AGE
pod/nginx-course-deploy-nginx-ingress-controller-6f8469f787-rgbm9 1/1 Running 0 1h
pod/nginx-course-deploy-nginx-ingress-default-backend-6d77776fjbsf6 1/1 Running 0 1h
NAME TYPE CLUSTER-IP EXTERNAL-IP PORT(S) AGE
service/nginx-course-deploy-nginx-ingress-controller LoadBalancer 100.68.166.91 ae3a20fc245b211e9b1ba023d0745758-1989208325.eu-central-1.elb.amazonaws.com 80:31922/TCP,443:30284/TCP 1h
service/nginx-course-deploy-nginx-ingress-default-backend ClusterIP 100.64.200.87 <none> 80/TCP 1h
root@ubuntu-s-1vcpu-2gb-lon1-01:~/local_charts/prometheus_grafana#
root@ubuntu-s-1vcpu-2gb-lon1-01:~/local_charts/prometheus_grafana# kubectl exec -it nginx-course-deploy-nginx-ingress-controller-6f8469f787-rgbm9 -n ingress -- bash
www-data@nginx-course-deploy-nginx-ingress-controller-6f8469f787-rgbm9:/etc/nginx$ cat /etc/nginx/nginx.conf
# Configuration checksum: 5350997910659272350
# setup custom paths that do not require root access
pid /tmp/nginx.pid;
load_module /etc/nginx/modules/ngx_http_modsecurity_module.so;
daemon off;
worker_processes 1;
.
.
.
log_format log_stream [$time_local] $protocol $status $bytes_sent $bytes_received $session_time;
access_log /var/log/nginx/access.log log_stream;
error_log /var/log/nginx/error.log;
upstream upstream_balancer {
server 0.0.0.1:1234; # placeholder
balancer_by_lua_block {
tcp_udp_balancer.balance()
}
}
.
.
.
## start server dokuwiki.kops.peelmicro.com
server {
server_name dokuwiki.kops.peelmicro.com ;
listen 80;
listen [::]:80;
set $proxy_upstream_name "-";
.
.
.
## start server grafana.kops.peelmicro.com
server {
server_name grafana.kops.peelmicro.com ;
listen 80;
listen [::]:80;
.
.
.
## start server prometheus.kops.peelmicro.com
server {
server_name prometheus.kops.peelmicro.com ;
listen 80;
listen [::]:80;
.
.
.
server {
listen unix:/tmp/ingress-stream.sock;
content_by_lua_block {
tcp_udp_configuration.call()
}
}
# TCP services
# UDP services
}
60. Important: Clean up Kubernetes cluster and all the AWS resources
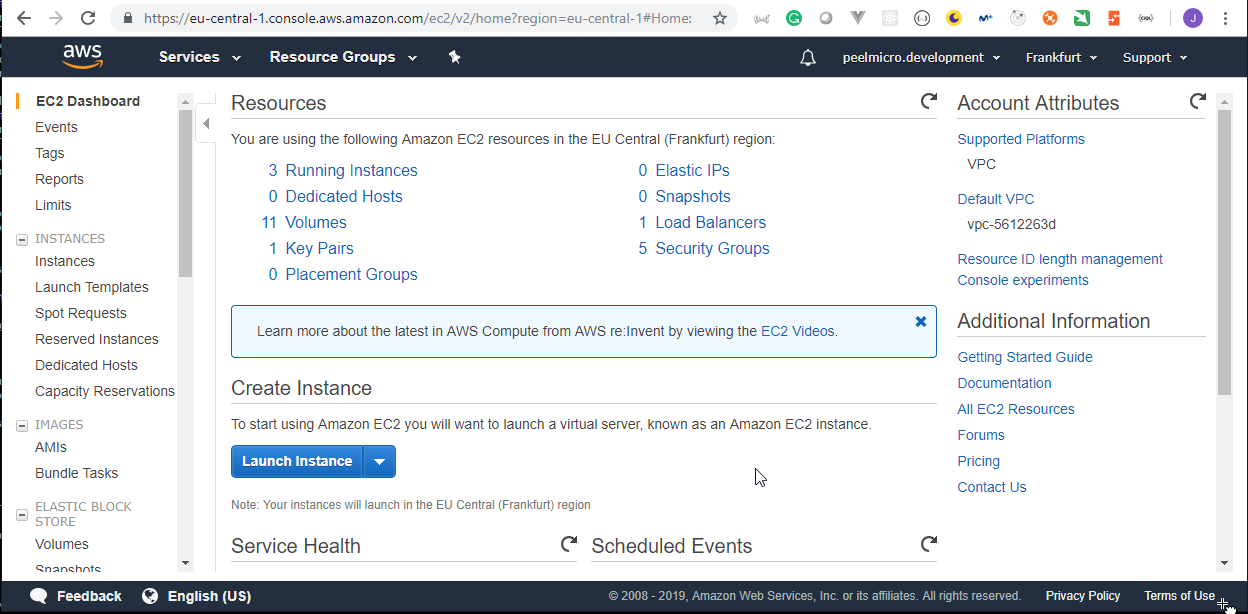
root@ubuntu-s-1vcpu-2gb-lon1-01:~/local_charts/prometheus_grafana# helm list -a
NAME REVISION UPDATED STATUS CHART NAMESPACE
dokuwiki-course-deploy 6 Wed Mar 13 18:27:33 2019 DEPLOYED dokuwiki-4.1.0 doku
grafana-course-deploy 10 Wed Mar 13 18:27:33 2019 DEPLOYED grafana-2.2.4 prometheus
jenkins-course-udemy 1 Sun Mar 10 17:15:53 2019 DEPLOYED jenkins-0.33.2 default
nginx-course-deploy 4 Wed Mar 13 18:27:33 2019 DEPLOYED nginx-ingress-1.3.1 ingress
prometheus-course-deploy 10 Wed Mar 13 18:27:33 2019 DEPLOYED prometheus-8.8.1 prometheus
- We can delete our deployments by running
root@ubuntu-s-1vcpu-2gb-lon1-01:~/local_charts/prometheus_grafana# helmfile -f helmfile_specification_pg.yaml delete
exec: helm delete nginx-course-deploy --kube-context kops.peelmicro.com
exec: helm delete grafana-course-deploy --kube-context kops.peelmicro.com
exec: helm delete prometheus-course-deploy --kube-context kops.peelmicro.com
exec: helm delete dokuwiki-course-deploy --kube-context kops.peelmicro.com
release "dokuwiki-course-deploy" deleted
release "grafana-course-deploy" deleted
release "nginx-course-deploy" deleted
release "prometheus-course-deploy" deleted
root@ubuntu-s-1vcpu-2gb-lon1-01:~/local_charts/prometheus_grafana#
root@ubuntu-s-1vcpu-2gb-lon1-01:~/local_charts/prometheus_grafana# helm list -a
NAME REVISION UPDATED STATUS CHART NAMESPACE
dokuwiki-course-deploy 6 Wed Mar 13 18:27:33 2019 DELETED dokuwiki-4.1.0 doku
grafana-course-deploy 10 Wed Mar 13 18:27:33 2019 DELETED grafana-2.2.4 prometheus
jenkins-course-udemy 1 Sun Mar 10 17:15:53 2019 DEPLOYED jenkins-0.33.2 default
nginx-course-deploy 4 Wed Mar 13 18:27:33 2019 DELETED nginx-ingress-1.3.1 ingress
prometheus-course-deploy 10 Wed Mar 13 18:27:33 2019 DELETED prometheus-8.8.1 prometheus
root@ubuntu-s-1vcpu-2gb-lon1-01:~/local_charts# helmfile -f jenkins_udemy_helmfile.yaml delete
exec: helm delete jenkins-course-udemy --kube-context kops.peelmicro.com
release "jenkins-course-udemy" deleted
root@ubuntu-s-1vcpu-2gb-lon1-01:~/local_charts#
root@ubuntu-s-1vcpu-2gb-lon1-01:~/local_charts# helm list -a
NAME REVISION UPDATED STATUS CHART NAMESPACE
dokuwiki-course-deploy 6 Wed Mar 13 18:27:33 2019 DELETED dokuwiki-4.1.0 doku
grafana-course-deploy 10 Wed Mar 13 18:27:33 2019 DELETED grafana-2.2.4 prometheus
jenkins-course-udemy 1 Sun Mar 10 17:15:53 2019 DELETED jenkins-0.33.2 default
nginx-course-deploy 4 Wed Mar 13 18:27:33 2019 DELETED nginx-ingress-1.3.1 ingress
prometheus-course-deploy 10 Wed Mar 13 18:27:33 2019 DELETED prometheus-8.8.1 prometheus
root@ubuntu-s-1vcpu-2gb-lon1-01:~/local_charts/prometheus_grafana# for i in prometheus-course-deploy grafana-course-deploy dokuwiki-course-deploy jenkins-course-udemy nginx-course-deploy; do helm delete $i --purge; done
release "prometheus-course-deploy" deleted
release "grafana-course-deploy" deleted
release "dokuwiki-course-deploy" deleted
release "jenkins-course-udemy" deleted
release "nginx-course-deploy" deleted
root@ubuntu-s-1vcpu-2gb-lon1-01:~/local_charts/prometheus_grafana#
root@ubuntu-s-1vcpu-2gb-lon1-01:~/local_charts/prometheus_grafana# helm list -a
root@ubuntu-s-1vcpu-2gb-lon1-01:~/local_charts/prometheus_grafana#
root@ubuntu-s-1vcpu-2gb-lon1-01:~/local_charts/prometheus_grafana# kubectl get pods,svc --all-namespaces
NAMESPACE NAME READY STATUS RESTARTS AGE
default pod/jupyter-k8s-udemy-79f7dd7ffc-kfzb7 1/1 Running 0 4d
kube-system pod/dns-controller-5875f77c46-psn65 1/1 Running 0 4d
kube-system pod/etcd-server-events-ip-172-20-45-184.eu-central-1.compute.internal 1/1 Running 0 4d
kube-system pod/etcd-server-ip-172-20-45-184.eu-central-1.compute.internal 1/1 Running 0 4d
kube-system pod/kube-apiserver-ip-172-20-45-184.eu-central-1.compute.internal 1/1 Running 0 4d
kube-system pod/kube-controller-manager-ip-172-20-45-184.eu-central-1.compute.internal 1/1 Running 0 4d
kube-system pod/kube-dns-5fbcb4d67b-77r68 3/3 Running 0 4d
kube-system pod/kube-dns-5fbcb4d67b-tqbx2 3/3 Running 0 4d
kube-system pod/kube-dns-autoscaler-6874c546dd-79tls 1/1 Running 0 4d
kube-system pod/kube-proxy-ip-172-20-45-184.eu-central-1.compute.internal 1/1 Running 0 4d
kube-system pod/kube-proxy-ip-172-20-50-246.eu-central-1.compute.internal 1/1 Running 0 4d
kube-system pod/kube-proxy-ip-172-20-56-4.eu-central-1.compute.internal 1/1 Running 1 4d
kube-system pod/kube-scheduler-ip-172-20-45-184.eu-central-1.compute.internal 1/1 Running 0 4d
kube-system pod/tiller-deploy-5c688d5f9b-tbqzh 1/1 Running 1 3d
NAMESPACE NAME TYPE CLUSTER-IP EXTERNAL-IP PORT(S) AGE
default service/jupyter-k8s-udemy NodePort 100.64.248.5 <none> 8888:30040/TCP 4d
default service/kubernetes ClusterIP 100.64.0.1 <none> 443/TCP 4d
kube-system service/kube-dns ClusterIP 100.64.0.10 <none> 53/UDP,53/TCP 4d
kube-system service/tiller-deploy ClusterIP 100.68.101.6 <none> 44134/TCP 3d
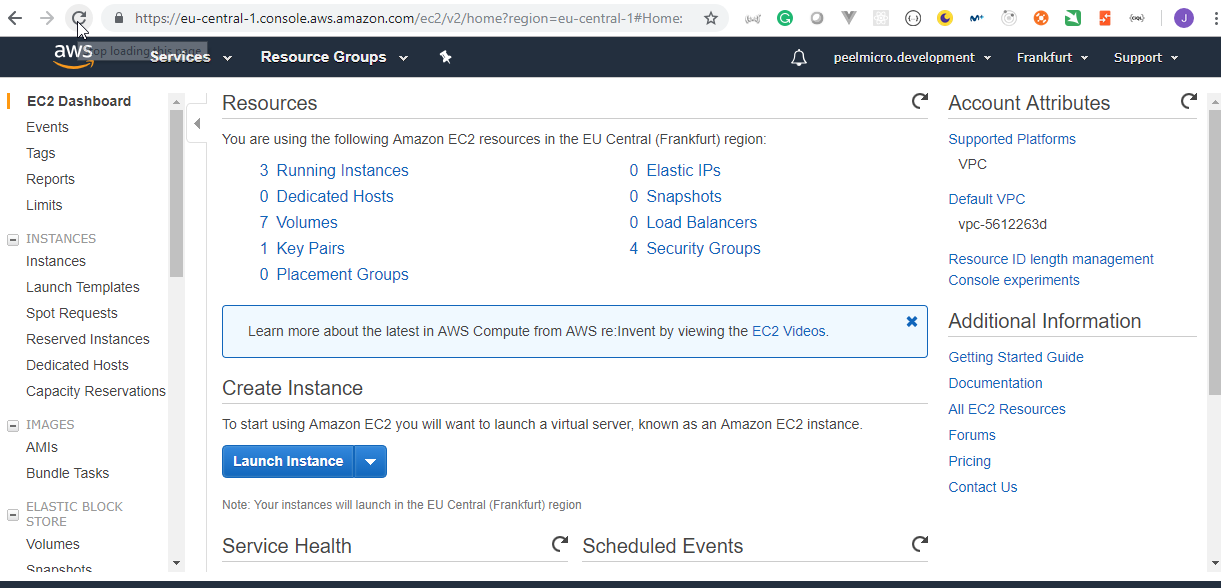
root@ubuntu-s-1vcpu-2gb-lon1-01:~# cd terraform/
root@ubuntu-s-1vcpu-2gb-lon1-01:~/terraform# ll
total 28
drwxr-xr-x 3 root root 4096 Mar 6 17:58 ./
drwx------ 19 root root 4096 Mar 13 18:26 ../
drwxr-xr-x 3 root root 4096 Mar 5 19:39 .terraform/
-rw-r--r-- 1 root root 14 Mar 6 17:48 private_ips.txt
-rw-r--r-- 1 root root 1140 Mar 6 17:46 terraform.code.tf
-rw-r--r-- 1 root root 318 Mar 6 17:58 terraform.tfstate
-rw-r--r-- 1 root root 4063 Mar 6 17:57 terraform.tfstate.backup
root@ubuntu-s-1vcpu-2gb-lon1-01:~/terraform#
- delete the first
kubernetes clusterby executingterraform destroyfrom the folder where theterraform.code.tfis
root@ubuntu-s-1vcpu-2gb-lon1-01:~/terraform# terraform destroy
Do you really want to destroy all resources?
Terraform will destroy all your managed infrastructure, as shown above.
There is no undo. Only 'yes' will be accepted to confirm.
Enter a value:
- Enter
yes
Do you really want to destroy all resources?
Terraform will destroy all your managed infrastructure, as shown above.
There is no undo. Only 'yes' will be accepted to confirm.
Enter a value: yes
Destroy complete! Resources: 0 destroyed.
- delete the course
kubernetes clusterby executingterraform destroyfrom the folder where thekubernetes.tfis
root@ubuntu-s-1vcpu-2gb-lon1-01:~/kops_cluster/devopsinuse_terraform# terraform destroy
aws_vpc.kops-peelmicro-com: Refreshing state... (ID: vpc-028e164a261a97de4)
aws_vpc_dhcp_options.kops-peelmicro-com: Refreshing state... (ID: dopt-0c9dd22620832ee93)
aws_ebs_volume.a-etcd-main-kops-peelmicro-com: Refreshing state... (ID: vol-0301c997672ded596)
aws_key_pair.kubernetes-kops-peelmicro-com-14f4e587b84d4819f287bedfda85ac26: Refreshing state... (ID: kubernetes.kops.peelmicro.com-14:f4:e5:87:b8:4d:48:19:f2:87:be:df:da:85:ac:26)
aws_ebs_volume.a-etcd-events-kops-peelmicro-com: Refreshing state... (ID: vol-07539d3f1d01b0044)
aws_iam_role.masters-kops-peelmicro-com: Refreshing state... (ID: masters.kops.peelmicro.com)
aws_iam_role.nodes-kops-peelmicro-com: Refreshing state... (ID: nodes.kops.peelmicro.com)
aws_iam_instance_profile.nodes-kops-peelmicro-com: Refreshing state... (ID: nodes.kops.peelmicro.com)
aws_iam_role_policy.nodes-kops-peelmicro-com: Refreshing state... (ID: nodes.kops.peelmicro.com:nodes.kops.peelmicro.com)
aws_iam_instance_profile.masters-kops-peelmicro-com: Refreshing state... (ID: masters.kops.peelmicro.com)
aws_iam_role_policy.masters-kops-peelmicro-com: Refreshing state... (ID: masters.kops.peelmicro.com:masters.kops.peelmicro.com)
aws_security_group.nodes-kops-peelmicro-com: Refreshing state... (ID: sg-0743e87a965010755)
aws_internet_gateway.kops-peelmicro-com: Refreshing state... (ID: igw-0c03bc064e9408647)
aws_route_table.kops-peelmicro-com: Refreshing state... (ID: rtb-0f63cc01eb0211053)
aws_security_group.masters-kops-peelmicro-com: Refreshing state... (ID: sg-0f0a41bf4931e4e6e)
aws_vpc_dhcp_options_association.kops-peelmicro-com: Refreshing state... (ID: dopt-0c9dd22620832ee93-vpc-028e164a261a97de4)
aws_subnet.eu-central-1a-kops-peelmicro-com: Refreshing state... (ID: subnet-0ed756e2828d8836f)
aws_launch_configuration.master-eu-central-1a-masters-kops-peelmicro-com: Refreshing state... (ID: master-eu-central-1a.masters.kops.peelmicro.com-20190309060741015700000001)
aws_security_group_rule.https-external-to-master-0-0-0-0--0: Refreshing state... (ID: sgrule-2908212759)
aws_security_group_rule.ssh-external-to-master-0-0-0-0--0: Refreshing state... (ID: sgrule-3478511132)
aws_security_group_rule.master-egress: Refreshing state... (ID: sgrule-3269006722)
aws_security_group_rule.all-master-to-master: Refreshing state... (ID: sgrule-1821362308)
aws_route.0-0-0-0--0: Refreshing state... (ID: r-rtb-0f63cc01eb02110531080289494)
aws_security_group_rule.all-master-to-node: Refreshing state... (ID: sgrule-996961237)
aws_security_group_rule.node-to-master-tcp-4003-65535: Refreshing state... (ID: sgrule-2231910828)
aws_security_group_rule.node-to-master-udp-1-65535: Refreshing state... (ID: sgrule-2220229052)
aws_security_group_rule.ssh-external-to-node-0-0-0-0--0: Refreshing state... (ID: sgrule-1119641619)
aws_security_group_rule.node-egress: Refreshing state... (ID: sgrule-1101280839)
aws_security_group_rule.node-to-master-tcp-1-2379: Refreshing state... (ID: sgrule-3762306149)
aws_launch_configuration.nodes-kops-peelmicro-com: Refreshing state... (ID: nodes.kops.peelmicro.com-20190309060742391800000002)
aws_security_group_rule.node-to-master-tcp-2382-4000: Refreshing state... (ID: sgrule-3742610849)
aws_security_group_rule.all-node-to-node: Refreshing state... (ID: sgrule-1880517418)
aws_route_table_association.eu-central-1a-kops-peelmicro-com: Refreshing state... (ID: rtbassoc-0627a7b379eae9700)
aws_autoscaling_group.master-eu-central-1a-masters-kops-peelmicro-com: Refreshing state... (ID: master-eu-central-1a.masters.kops.peelmicro.com)
aws_autoscaling_group.nodes-kops-peelmicro-com: Refreshing state... (ID: nodes.kops.peelmicro.com)
An execution plan has been generated and is shown below.
Resource actions are indicated with the following symbols:
- destroy
Terraform will perform the following actions:
- aws_autoscaling_group.master-eu-central-1a-masters-kops-peelmicro-com
- aws_autoscaling_group.nodes-kops-peelmicro-com
- aws_ebs_volume.a-etcd-events-kops-peelmicro-com
- aws_ebs_volume.a-etcd-main-kops-peelmicro-com
- aws_iam_instance_profile.masters-kops-peelmicro-com
- aws_iam_instance_profile.nodes-kops-peelmicro-com
- aws_iam_role.masters-kops-peelmicro-com
- aws_iam_role.nodes-kops-peelmicro-com
- aws_iam_role_policy.masters-kops-peelmicro-com
- aws_iam_role_policy.nodes-kops-peelmicro-com
- aws_internet_gateway.kops-peelmicro-com
- aws_key_pair.kubernetes-kops-peelmicro-com-14f4e587b84d4819f287bedfda85ac26
- aws_launch_configuration.master-eu-central-1a-masters-kops-peelmicro-com
- aws_launch_configuration.nodes-kops-peelmicro-com
- aws_route.0-0-0-0--0
- aws_route_table.kops-peelmicro-com
- aws_route_table_association.eu-central-1a-kops-peelmicro-com
- aws_security_group.masters-kops-peelmicro-com
- aws_security_group.nodes-kops-peelmicro-com
- aws_security_group_rule.all-master-to-master
- aws_security_group_rule.all-master-to-node
- aws_security_group_rule.all-node-to-node
- aws_security_group_rule.https-external-to-master-0-0-0-0--0
- aws_security_group_rule.master-egress
- aws_security_group_rule.node-egress
- aws_security_group_rule.node-to-master-tcp-1-2379
- aws_security_group_rule.node-to-master-tcp-2382-4000
- aws_security_group_rule.node-to-master-tcp-4003-65535
- aws_security_group_rule.node-to-master-udp-1-65535
- aws_security_group_rule.ssh-external-to-master-0-0-0-0--0
- aws_security_group_rule.ssh-external-to-node-0-0-0-0--0
- aws_subnet.eu-central-1a-kops-peelmicro-com
- aws_vpc.kops-peelmicro-com
- aws_vpc_dhcp_options.kops-peelmicro-com
- aws_vpc_dhcp_options_association.kops-peelmicro-com
Plan: 0 to add, 0 to change, 35 to destroy.
Do you really want to destroy all resources?
Terraform will destroy all your managed infrastructure, as shown above.
There is no undo. Only 'yes' will be accepted to confirm.
Enter a value:
- Enter
yes
Enter a value: yes
aws_security_group_rule.https-external-to-master-0-0-0-0--0: Destroying... (ID: sgrule-2908212759)
aws_autoscaling_group.master-eu-central-1a-masters-kops-peelmicro-com: Destroying... (ID: master-eu-central-1a.masters.kops.peelmicro.com)
aws_autoscaling_group.nodes-kops-peelmicro-com: Destroying... (ID: nodes.kops.peelmicro.com)
aws_security_group_rule.node-egress: Destroying... (ID: sgrule-1101280839)
aws_iam_role_policy.masters-kops-peelmicro-com: Destroying... (ID: masters.kops.peelmicro.com:masters.kops.peelmicro.com)
aws_security_group_rule.all-master-to-node: Destroying... (ID: sgrule-996961237)
aws_security_group_rule.all-node-to-node: Destroying... (ID: sgrule-1880517418)
aws_iam_role_policy.nodes-kops-peelmicro-com: Destroying... (ID: nodes.kops.peelmicro.com:nodes.kops.peelmicro.com)
aws_security_group_rule.master-egress: Destroying... (ID: sgrule-3269006722)
aws_ebs_volume.a-etcd-events-kops-peelmicro-com: Destroying... (ID: vol-07539d3f1d01b0044)
aws_security_group_rule.node-egress: Destruction complete after 0s
aws_security_group_rule.https-external-to-master-0-0-0-0--0: Destruction complete after 0s
aws_security_group_rule.ssh-external-to-master-0-0-0-0--0: Destroying... (ID: sgrule-3478511132)
aws_route.0-0-0-0--0: Destroying... (ID: r-rtb-0f63cc01eb02110531080289494)
aws_iam_role_policy.masters-kops-peelmicro-com: Destruction complete after 0s
aws_security_group_rule.node-to-master-tcp-1-2379: Destroying... (ID: sgrule-3762306149)
aws_iam_role_policy.nodes-kops-peelmicro-com: Destruction complete after 0s
aws_route_table_association.eu-central-1a-kops-peelmicro-com: Destroying... (ID: rtbassoc-0627a7b379eae9700)
aws_route.0-0-0-0--0: Destruction complete after 0s
aws_vpc_dhcp_options_association.kops-peelmicro-com: Destroying... (ID: dopt-0c9dd22620832ee93-vpc-028e164a261a97de4)
aws_route_table_association.eu-central-1a-kops-peelmicro-com: Destruction complete after 0s
aws_security_group_rule.all-master-to-master: Destroying... (ID: sgrule-1821362308)
aws_vpc_dhcp_options_association.kops-peelmicro-com: Destruction complete after 0s
aws_security_group_rule.node-to-master-udp-1-65535: Destroying... (ID: sgrule-2220229052)
aws_security_group_rule.master-egress: Destruction complete after 0s
aws_security_group_rule.ssh-external-to-node-0-0-0-0--0: Destroying... (ID: sgrule-1119641619)
aws_security_group_rule.all-master-to-node: Destruction complete after 0s
aws_ebs_volume.a-etcd-main-kops-peelmicro-com: Destroying... (ID: vol-0301c997672ded596)
aws_security_group_rule.all-node-to-node: Destruction complete after 1s
aws_security_group_rule.ssh-external-to-master-0-0-0-0--0: Destruction complete after 1s
aws_security_group_rule.node-to-master-tcp-2382-4000: Destroying... (ID: sgrule-3742610849)
aws_security_group_rule.node-to-master-tcp-4003-65535: Destroying... (ID: sgrule-2231910828)
aws_security_group_rule.node-to-master-tcp-1-2379: Destruction complete after 1s
aws_internet_gateway.kops-peelmicro-com: Destroying... (ID: igw-0c03bc064e9408647)
aws_security_group_rule.ssh-external-to-node-0-0-0-0--0: Destruction complete after 1s
aws_route_table.kops-peelmicro-com: Destroying... (ID: rtb-0f63cc01eb0211053)
aws_security_group_rule.all-master-to-master: Destruction complete after 2s
aws_vpc_dhcp_options.kops-peelmicro-com: Destroying... (ID: dopt-0c9dd22620832ee93)
aws_route_table.kops-peelmicro-com: Destruction complete after 1s
aws_vpc_dhcp_options.kops-peelmicro-com: Destruction complete after 0s
aws_security_group_rule.node-to-master-udp-1-65535: Destruction complete after 2s
aws_security_group_rule.node-to-master-tcp-2382-4000: Destruction complete after 1s
aws_security_group_rule.node-to-master-tcp-4003-65535: Destruction complete after 2s
aws_autoscaling_group.master-eu-central-1a-masters-kops-peelmicro-com: Still destroying... (ID: master-eu-central-1a.masters.kops.peelmicro.com, 10s elapsed)
aws_autoscaling_group.nodes-kops-peelmicro-com: Still destroying... (ID: nodes.kops.peelmicro.com, 10s elapsed)
aws_ebs_volume.a-etcd-events-kops-peelmicro-com: Still destroying... (ID: vol-07539d3f1d01b0044, 10s elapsed)
aws_ebs_volume.a-etcd-main-kops-peelmicro-com: Still destroying... (ID: vol-0301c997672ded596, 10s elapsed)
aws_internet_gateway.kops-peelmicro-com: Still destroying... (ID: igw-0c03bc064e9408647, 10s elapsed)
aws_autoscaling_group.master-eu-central-1a-masters-kops-peelmicro-com: Still destroying... (ID: master-eu-central-1a.masters.kops.peelmicro.com, 20s elapsed)
aws_autoscaling_group.nodes-kops-peelmicro-com: Still destroying... (ID: nodes.kops.peelmicro.com, 20s elapsed)
aws_ebs_volume.a-etcd-events-kops-peelmicro-com: Still destroying... (ID: vol-07539d3f1d01b0044, 20s elapsed)
aws_ebs_volume.a-etcd-main-kops-peelmicro-com: Still destroying... (ID: vol-0301c997672ded596, 20s elapsed)
aws_internet_gateway.kops-peelmicro-com: Still destroying... (ID: igw-0c03bc064e9408647, 20s elapsed)
aws_autoscaling_group.master-eu-central-1a-masters-kops-peelmicro-com: Still destroying... (ID: master-eu-central-1a.masters.kops.peelmicro.com, 30s elapsed)
aws_autoscaling_group.nodes-kops-peelmicro-com: Still destroying... (ID: nodes.kops.peelmicro.com, 30s elapsed)
aws_ebs_volume.a-etcd-events-kops-peelmicro-com: Still destroying... (ID: vol-07539d3f1d01b0044, 30s elapsed)
aws_ebs_volume.a-etcd-main-kops-peelmicro-com: Still destroying... (ID: vol-0301c997672ded596, 30s elapsed)
aws_internet_gateway.kops-peelmicro-com: Still destroying... (ID: igw-0c03bc064e9408647, 30s elapsed)
aws_autoscaling_group.master-eu-central-1a-masters-kops-peelmicro-com: Still destroying... (ID: master-eu-central-1a.masters.kops.peelmicro.com, 40s elapsed)
aws_autoscaling_group.nodes-kops-peelmicro-com: Still destroying... (ID: nodes.kops.peelmicro.com, 40s elapsed)
aws_ebs_volume.a-etcd-events-kops-peelmicro-com: Still destroying... (ID: vol-07539d3f1d01b0044, 40s elapsed)
aws_ebs_volume.a-etcd-main-kops-peelmicro-com: Still destroying... (ID: vol-0301c997672ded596, 40s elapsed)
aws_internet_gateway.kops-peelmicro-com: Still destroying... (ID: igw-0c03bc064e9408647, 40s elapsed)
aws_autoscaling_group.master-eu-central-1a-masters-kops-peelmicro-com: Still destroying... (ID: master-eu-central-1a.masters.kops.peelmicro.com, 50s elapsed)
aws_autoscaling_group.nodes-kops-peelmicro-com: Still destroying... (ID: nodes.kops.peelmicro.com, 50s elapsed)
aws_ebs_volume.a-etcd-events-kops-peelmicro-com: Still destroying... (ID: vol-07539d3f1d01b0044, 50s elapsed)
aws_ebs_volume.a-etcd-main-kops-peelmicro-com: Still destroying... (ID: vol-0301c997672ded596, 50s elapsed)
aws_internet_gateway.kops-peelmicro-com: Still destroying... (ID: igw-0c03bc064e9408647, 50s elapsed)
aws_autoscaling_group.master-eu-central-1a-masters-kops-peelmicro-com: Still destroying... (ID: master-eu-central-1a.masters.kops.peelmicro.com, 1m0s elapsed)
aws_autoscaling_group.nodes-kops-peelmicro-com: Still destroying... (ID: nodes.kops.peelmicro.com, 1m0s elapsed)
aws_ebs_volume.a-etcd-events-kops-peelmicro-com: Still destroying... (ID: vol-07539d3f1d01b0044, 1m0s elapsed)
aws_ebs_volume.a-etcd-main-kops-peelmicro-com: Still destroying... (ID: vol-0301c997672ded596, 1m0s elapsed)
aws_internet_gateway.kops-peelmicro-com: Still destroying... (ID: igw-0c03bc064e9408647, 1m0s elapsed)
aws_ebs_volume.a-etcd-events-kops-peelmicro-com: Destruction complete after 1m7s
aws_ebs_volume.a-etcd-main-kops-peelmicro-com: Destruction complete after 1m7s
aws_autoscaling_group.master-eu-central-1a-masters-kops-peelmicro-com: Still destroying... (ID: master-eu-central-1a.masters.kops.peelmicro.com, 1m10s elapsed)
aws_autoscaling_group.nodes-kops-peelmicro-com: Still destroying... (ID: nodes.kops.peelmicro.com, 1m10s elapsed)
aws_internet_gateway.kops-peelmicro-com: Still destroying... (ID: igw-0c03bc064e9408647, 1m10s elapsed)
aws_internet_gateway.kops-peelmicro-com: Destruction complete after 1m16s
aws_autoscaling_group.master-eu-central-1a-masters-kops-peelmicro-com: Still destroying... (ID: master-eu-central-1a.masters.kops.peelmicro.com, 1m20s elapsed)
aws_autoscaling_group.nodes-kops-peelmicro-com: Still destroying... (ID: nodes.kops.peelmicro.com, 1m20s elapsed)
aws_autoscaling_group.master-eu-central-1a-masters-kops-peelmicro-com: Still destroying... (ID: master-eu-central-1a.masters.kops.peelmicro.com, 1m30s elapsed)
aws_autoscaling_group.nodes-kops-peelmicro-com: Still destroying... (ID: nodes.kops.peelmicro.com, 1m30s elapsed)
aws_autoscaling_group.nodes-kops-peelmicro-com: Destruction complete after 1m35s
aws_launch_configuration.nodes-kops-peelmicro-com: Destroying... (ID: nodes.kops.peelmicro.com-20190309060742391800000002)
aws_launch_configuration.nodes-kops-peelmicro-com: Destruction complete after 0s
aws_security_group.nodes-kops-peelmicro-com: Destroying... (ID: sg-0743e87a965010755)
aws_iam_instance_profile.nodes-kops-peelmicro-com: Destroying... (ID: nodes.kops.peelmicro.com)
aws_security_group.nodes-kops-peelmicro-com: Destruction complete after 0s
aws_iam_instance_profile.nodes-kops-peelmicro-com: Destruction complete after 1s
aws_iam_role.nodes-kops-peelmicro-com: Destroying... (ID: nodes.kops.peelmicro.com)
aws_iam_role.nodes-kops-peelmicro-com: Destruction complete after 1s
aws_autoscaling_group.master-eu-central-1a-masters-kops-peelmicro-com: Still destroying... (ID: master-eu-central-1a.masters.kops.peelmicro.com, 1m40s elapsed)
aws_autoscaling_group.master-eu-central-1a-masters-kops-peelmicro-com: Still destroying... (ID: master-eu-central-1a.masters.kops.peelmicro.com, 1m50s elapsed)
aws_autoscaling_group.master-eu-central-1a-masters-kops-peelmicro-com: Destruction complete after 1m53s
aws_launch_configuration.master-eu-central-1a-masters-kops-peelmicro-com: Destroying... (ID: master-eu-central-1a.masters.kops.peelmicro.com-20190309060741015700000001)
aws_subnet.eu-central-1a-kops-peelmicro-com: Destroying... (ID: subnet-0ed756e2828d8836f)
aws_launch_configuration.master-eu-central-1a-masters-kops-peelmicro-com: Destruction complete after 0s
aws_security_group.masters-kops-peelmicro-com: Destroying... (ID: sg-0f0a41bf4931e4e6e)
aws_key_pair.kubernetes-kops-peelmicro-com-14f4e587b84d4819f287bedfda85ac26: Destroying... (ID: kubernetes.kops.peelmicro.com-14:f4:e5:87:b8:4d:48:19:f2:87:be:df:da:85:ac:26)
aws_iam_instance_profile.masters-kops-peelmicro-com: Destroying... (ID: masters.kops.peelmicro.com)
aws_key_pair.kubernetes-kops-peelmicro-com-14f4e587b84d4819f287bedfda85ac26: Destruction complete after 0s
aws_subnet.eu-central-1a-kops-peelmicro-com: Destruction complete after 0s
aws_security_group.masters-kops-peelmicro-com: Destruction complete after 1s
aws_vpc.kops-peelmicro-com: Destroying... (ID: vpc-028e164a261a97de4)
aws_vpc.kops-peelmicro-com: Destruction complete after 0s
aws_iam_instance_profile.masters-kops-peelmicro-com: Destruction complete after 1s
aws_iam_role.masters-kops-peelmicro-com: Destroying... (ID: masters.kops.peelmicro.com)
aws_iam_role.masters-kops-peelmicro-com: Destruction complete after 1s
Destroy complete! Resources: 35 destroyed.
root@ubuntu-s-1vcpu-2gb-lon1-01:~/kops_cluster/devopsinuse_terraform#
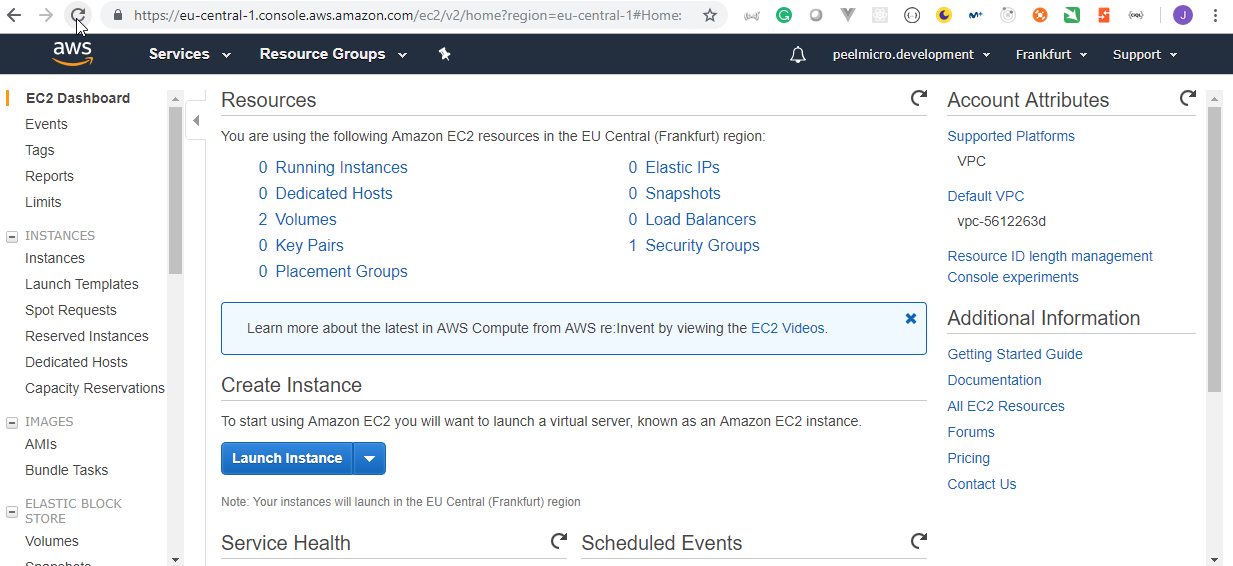
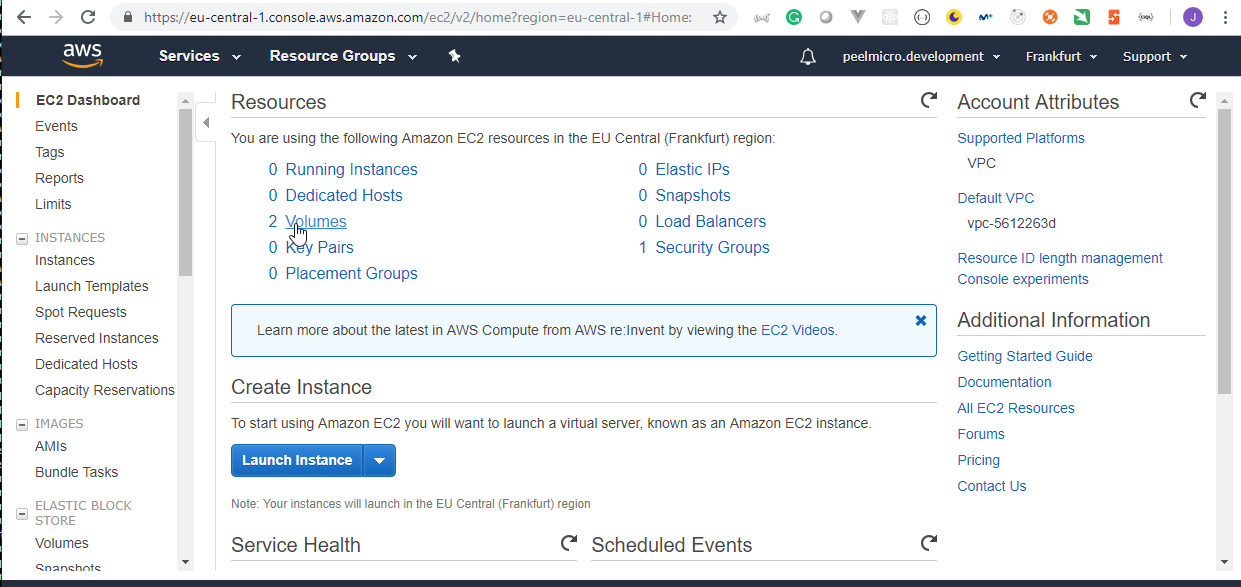
- Remove manually the volumens not removed:
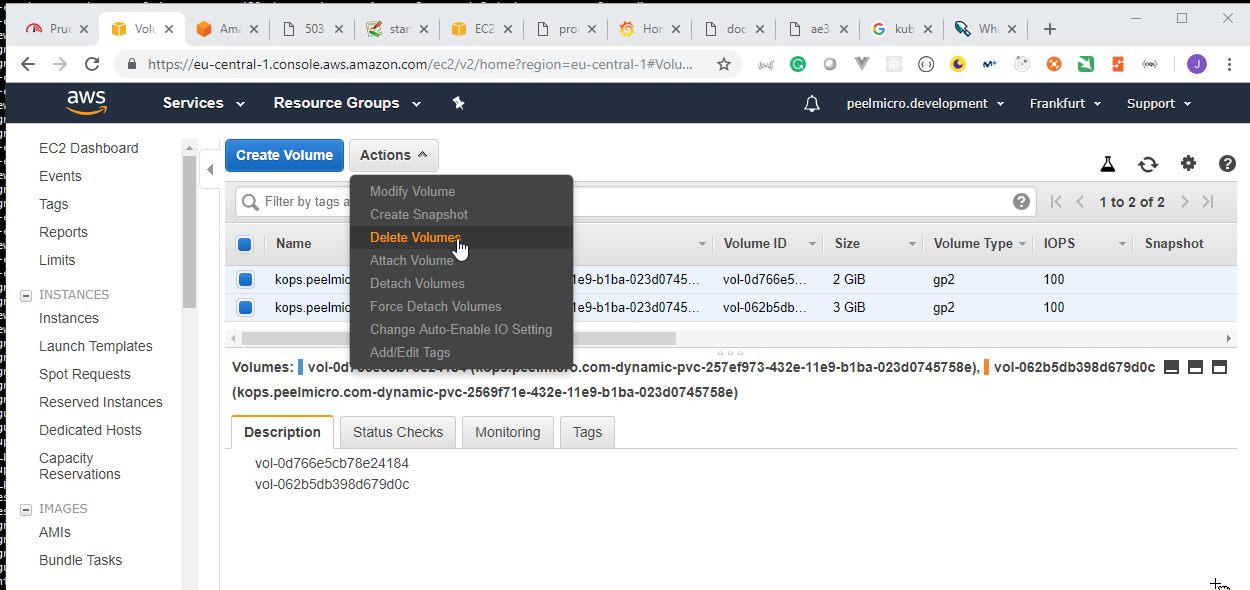
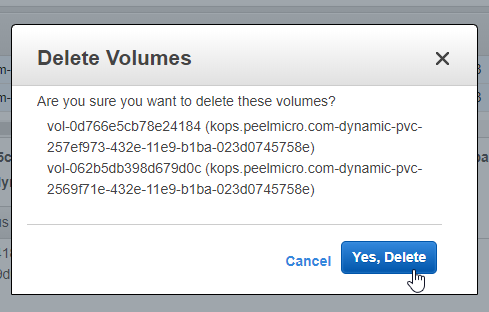
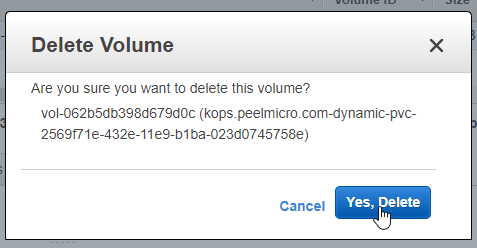
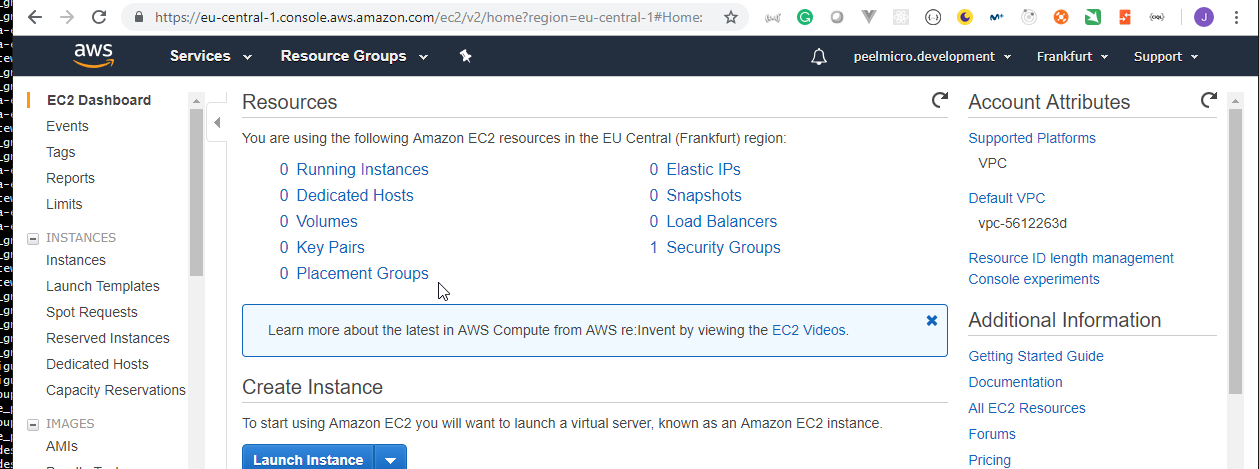
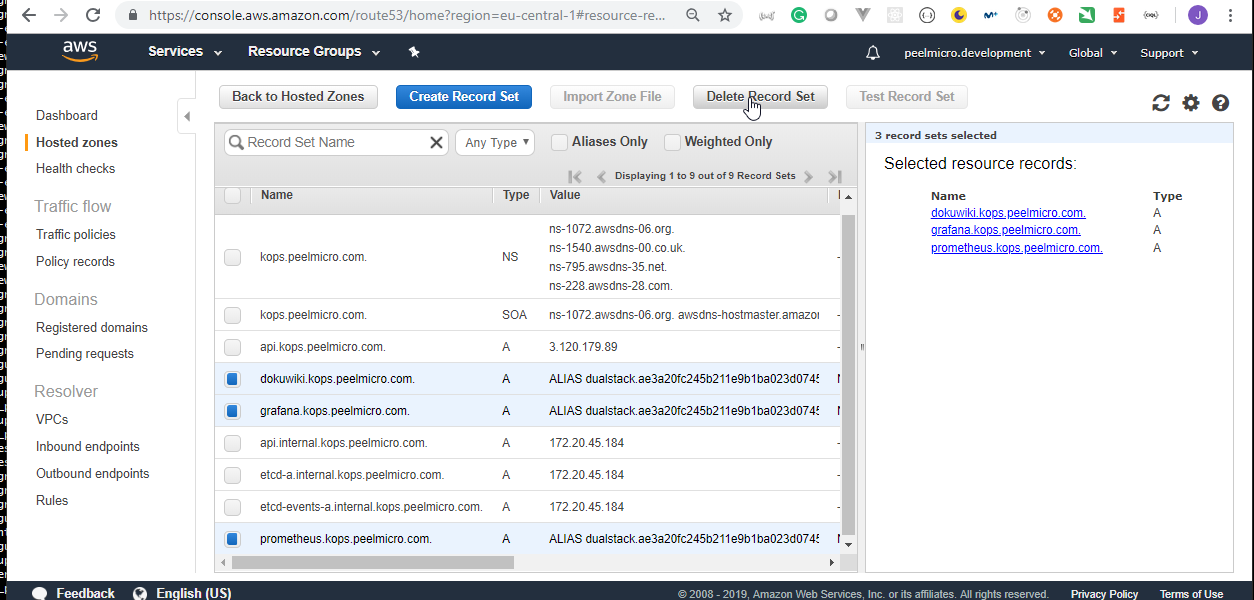
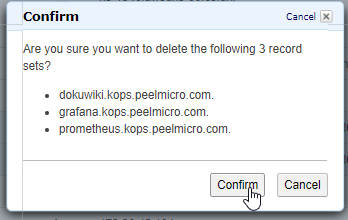
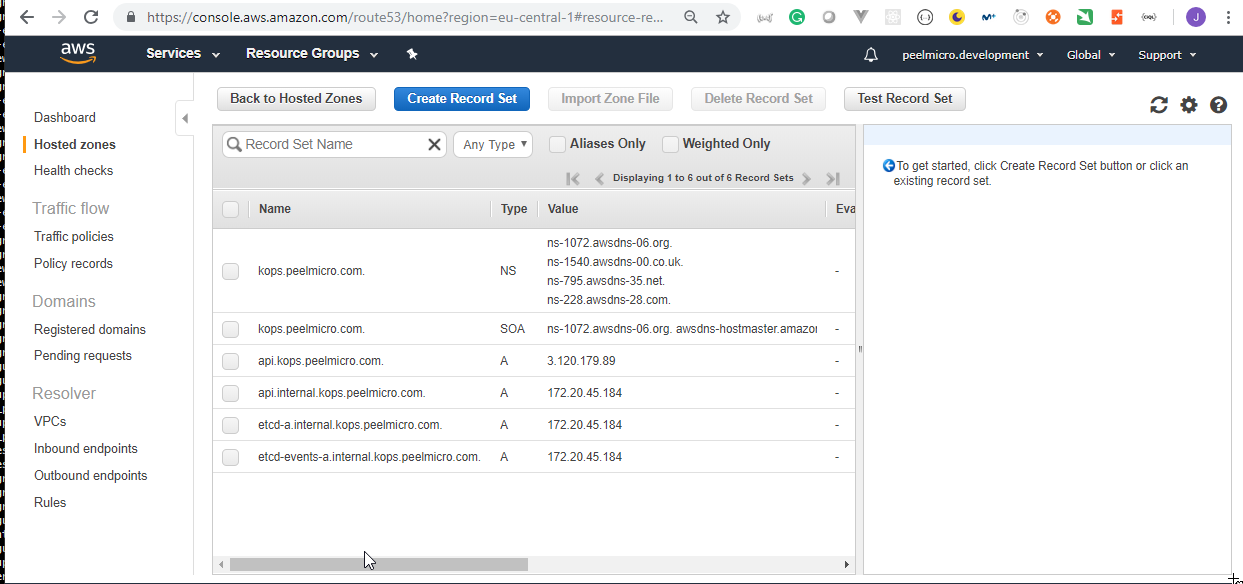
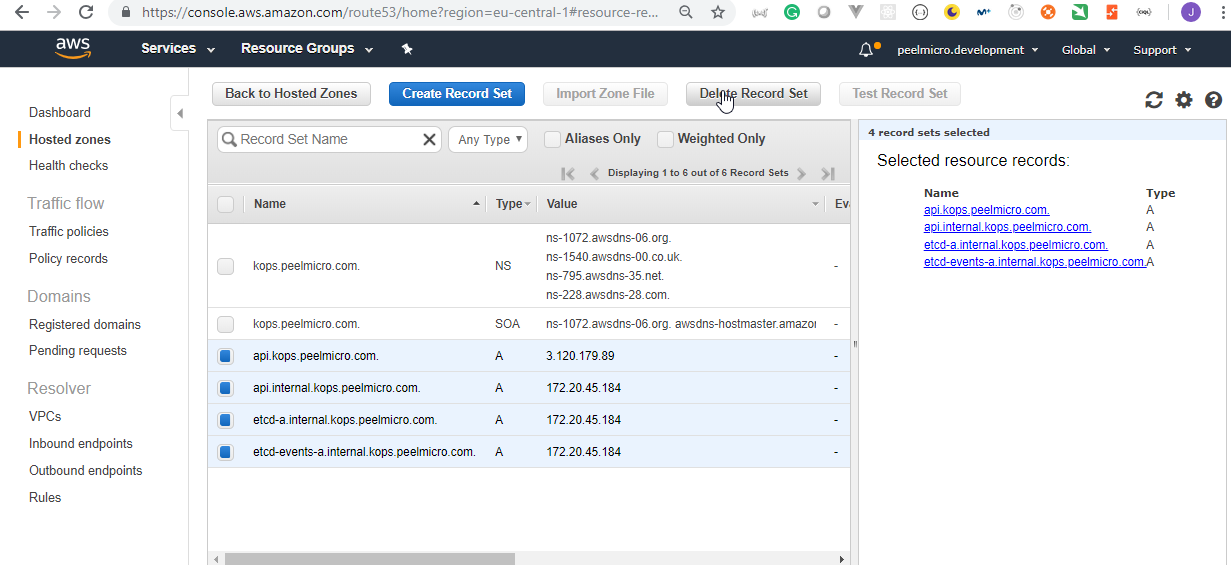
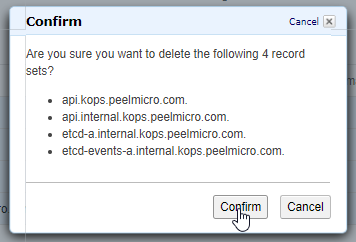
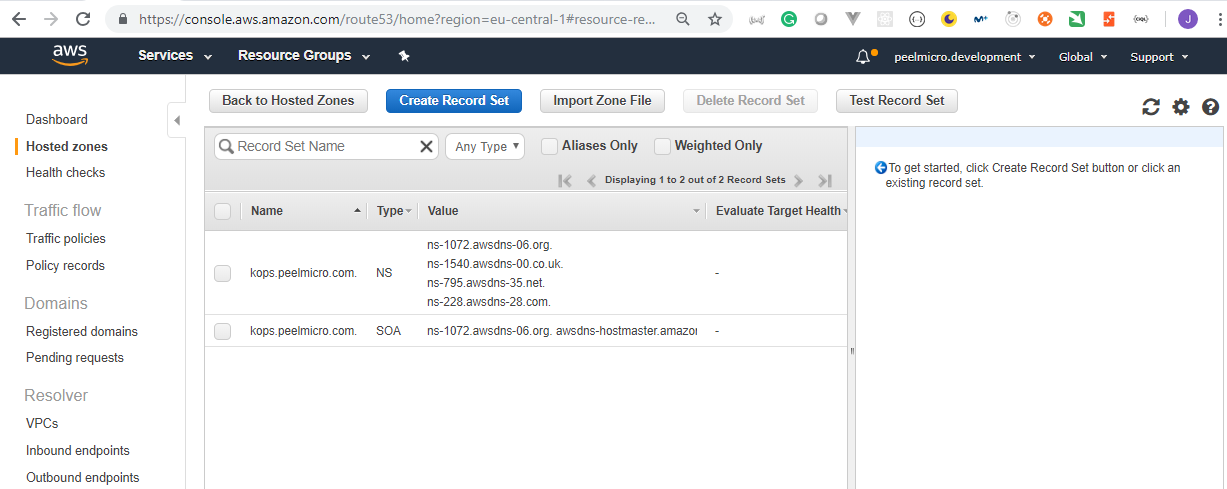
61. Congratulations
